5154
Circumferential and Radial Variations in T2, T2* and T1rho in the Osteoarthritic Meniscus1Mechanical Engineering, Stanford University, Stanford, CA, United States, 2Radiology, Stanford University, Palo Alto, CA, United States
Synopsis
The menisci of the knee are important for distributing load at the knee joint, and meniscal damage has been shown to precede cartilage degeneration in the knee. We examined radial and circumferential meniscal variation in T2, T2* and T1rho relaxation times in osteoarthritic menisci. Menisci were divided into 3 circumferential regions (anterior, body, and posterior) and then further into 3 radial regions (inner, middle, and outer). Significant differences were found between circumferential and radial regions for T2, but only between circumferential regions for T2* and T1rho. Changes in meniscal regional variations could be important in tracking osteoarthritis disease progress.
Purpose
The menisci of the knee play an important role in distributing load at the knee and providing joint stability. Osteoarthritis of the knee is a degenerative, debilitating disease that affects menisci, cartilage, synovium, and bone, however there has long been an almost exclusive focus on end-stage cartilage degeneration1. Meniscal degeneration plays a significant role in osteoarthritis, and with meniscectomies being the most commonly performed orthopedic procedure in the United States2, it is necessary that we better understand degenerative changes to menisci. The meniscus is a complex structure exhibiting regional variation in biochemical components, vascularity, and its collagen network. Developing methods to detect regional differences in the meniscus could allow for a better understanding of meniscal degeneration. The objective of this study was to examine circumferential and radial variation in T2, T2* and T1rho relaxation times in osteoarthritic menisci.Methods
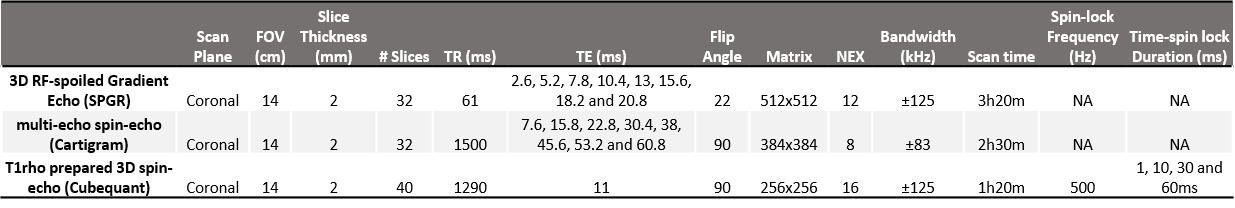
Five menisci (3-medial and 2-lateral) from total knee arthroplasty patients were frozen in phosphate-buffered-saline with protease-inhibitors and thawed before use. Menisci were embedded in a cylindrical agar mold, which was designed so the long axis of the mold ran parallel to the main magnetic field, and the menisci were aligned as if a patient was lying supine in the scanner to avoid magic angle artifact. Menisci were imaged in a 3.0T scanner (GE Healthcare, Milwaukee, WI) using multi-echo 3D RF-spoiled gradient echo (SPGR), multi-echo spin-echo (cartigram), and T1rho-prepared 3D spin echo (cubequant) (Figure 1). Scan parameters were chosen to allow for short TEs, and long scan-times were used to obtain high SNR.
Meniscal signal was segmented in coronal images from the surrounding agar signal using Amira image analysis software (FEI, Hillsboro, OR). The segmentations excluded meniscal pixels closest to the agar to remove any potential partial-volume artifact from the agar-meniscus interface. A pixel-by-pixel mono-exponential fit was used to determine T2, T2* and T1rho from cartigram, multi-echo SPGR, and cubequant, respectively.
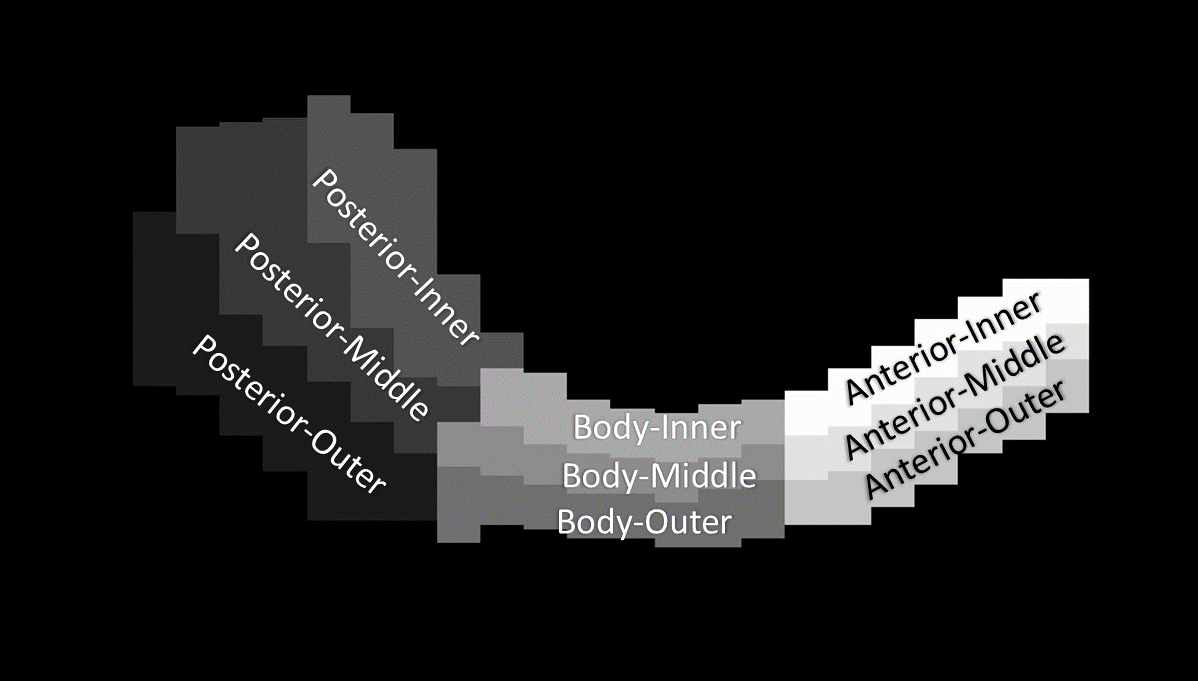
Meniscal segmentations were re-sliced in the transverse-plane and a maximum-intensity projection image was created in this plane. This meniscal maximum-intensity projection was then manually segmented into 9 regions, dividing the meniscus by circumferential regions (anterior, body and posterior) as well as radial regions (inner, middle and outer), as has been previously done3 (Figure 2). This 2D segmentation was then applied to every transverse slice of the 3D volume to divide the meniscus into its 9 regions. To evaluate differences among circumferential and radial regions, quantitative data were analyzed using a two-factor general linear model with p<0.05 and Bonferroni's test for pairwise comparisons.
Results
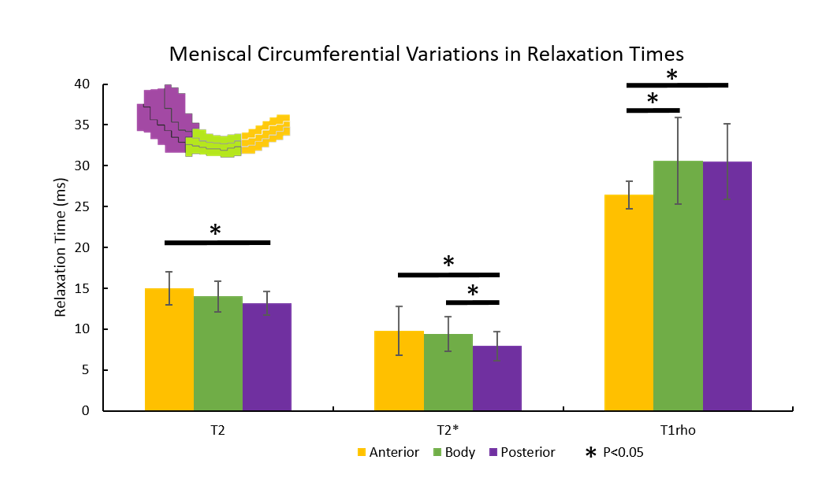
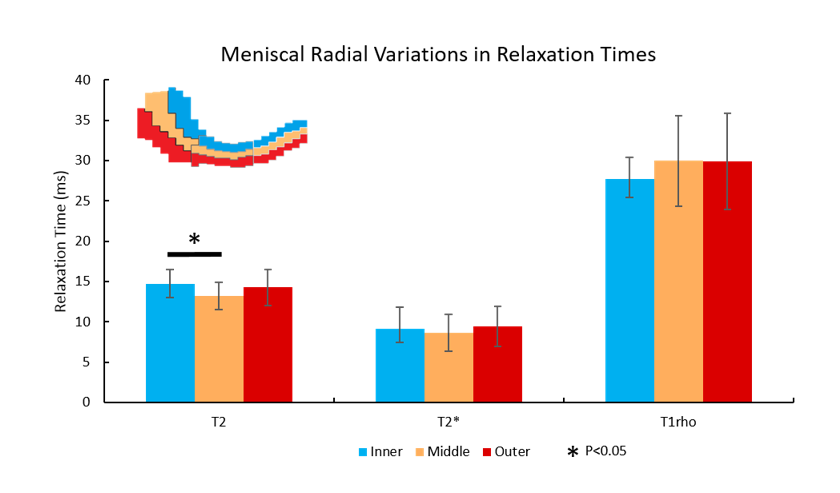
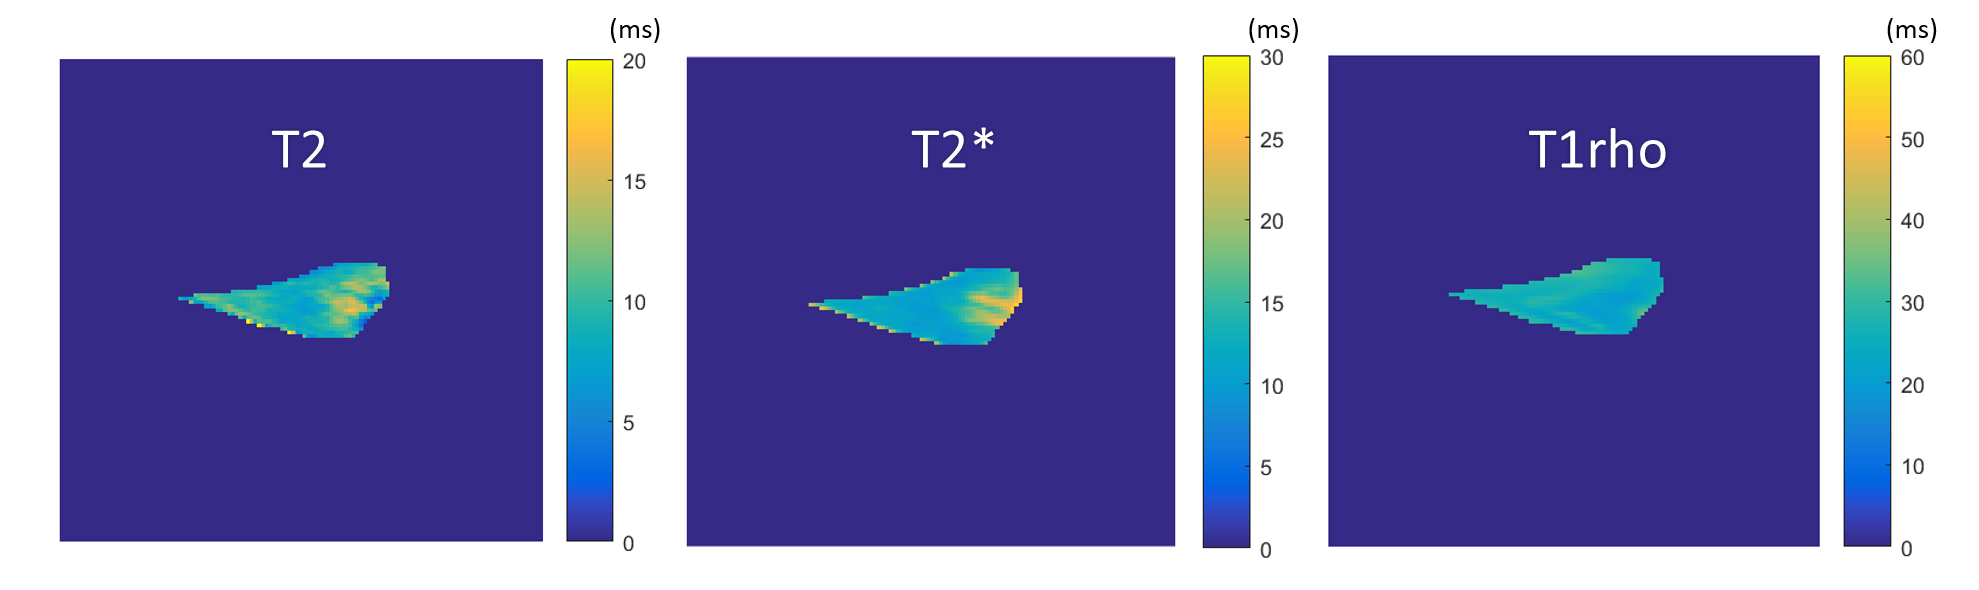
T2 values in the anterior meniscus section were significantly higher than those in the posterior section, and T2 values in the inner section were significantly higher than those in the middle section. For T2* values, the anterior and body sections were significantly higher than the posterior section. Finally, for T1rho values, the body and posterior section were significantly higher than the anterior section (Figures 3 and 4). Sample T2, T2* and T1rho maps are shown in Figure 5.Discussion
We investigated circumferential and radial variation in T2, T2* and T1rho. Regional variations in menisci for T2 and T1rho values have been previously investigated3, as well as T2* separately as an indicator for degeneration4. Average values for T2 and T1rho are consistent with literature looking in vivo at osteoarthritic menisci5,6, and values for T2* are consistent with literature for in situ osteoarthritic menisci4 (in vivo work could not be found). The posterior region’s differences from other circumferential regions is particularly noteworthy as the posterior region has been described as an important area for investigating early osteoarthritic changes based on previous work involving T1rho6,7. T2, T2* and T1rho relaxation times have been linked to loss of collagen and sulfated-glycosaminoglycan3 content, as well as sub-clinical meniscal degeneration4, respectively. Mapping regional differences for these parameters can elicit an improved understanding of early changes in the meniscus, particularly those which can lead to osteoarthritis as meniscal damage has been suspected to precede and accelerate cartilage damage in osteoarthritis8,9. For future work, we will examine regional variations in non-osteoarthritic menisci to investigate how regional differences change over disease progression, and if early regional differences could be used as a biomarker for osteoarthritis. Expanded studies including a spectrum of normal, mildly degenerate and grossly degenerate menisci will allow identification of imaging metrics quantitatively sensitive to moderate changes typical of early disease states and improvements in diagnosis and assessment of osteoarthritis progression.Conclusion
Regional differences detected in T2, T2* and T1rho values of osteoarthritic menisci could be important in detecting changes to the state of degeneration in menisci.Acknowledgements
NIH R01 AR0063643, NIH R01 EB002524, NIH K24 AR062068, and GE Healthcare.References
1. Poole, a R. (2012). Osteoarthritis as a whole joint disease. HSS Journal?: The Musculoskeletal Journal of Hospital for Special Surgery, 8(1), 4–6. http://doi.org/10.1007/s11420-011-9248-6
2. Harrast, J., Paul Derosa, G., Garrett, W. E., Swiontkowski, M. F., Weinstein, J. N., Callaghan, J., … Berry, D. J. (2006). Surgeon: Part-II, Certification Examination Case Mix American Board of Orthopaedic Surgery Practice of the Orthopaedic American Board of Orthopaedic Surgery Practice of the Orthopaedic Surgeon: Part-II, Certification Examination Case Mix. J Bone Joint Surg Am. COPYRIGHT © BY THE JOURNAL OF BONE AND JOINT SURGERY. http://doi.org/10.2106/JBJS.E.01208
3. Son, M., Goodman, S. B., Chen, W., Hargreaves, B. a, Gold, G. E., & Levenston, M. E. (2013). Regional Variation in T1ρ and T2 Times in Osteoarthritic Human Menisci: Correlation with Mechanical Properties and Matrix Composition. Osteoarthritis and Cartilage / OARS, Osteoarthritis Research Society, 21(6), 796–805. http://doi.org/10.1016/j.joca.2013.03.002
4. Williams, A., Qian, Y., Golla, S., & Chu, C. R. (2012). UTE-T2* mapping detects sub-clinical meniscus injury after anterior cruciate ligament tear. Osteoarthritis and Cartilage, 20(6), 486–494. http://doi.org/10.1016/j.joca.2012.01.009
5. Rauscher, I., Stahl, R., Cheng, J., Luke, A., & Link, T. M. (2008). Meniscal Measurements of T1 and T2 at MR Imaging in Healthy Subjects and Patients with Methods?: Results?: Conclusion?:, 249(2), 591–600.
6. Wang, L., Chang, G., Xu, J., Vieira, R. L. R., Krasnokutsky, S., Abramson, S., & Regatte, R. R. (2012). T1rho MRI of menisci and cartilage in patients with osteoarthritis at 3T. European Journal of Radiology, 81(9), 2329–2336. http://doi.org/10.1016/j.ejrad.2011.07.017
7. Zarins, Z. A., Bolbos, R. I., Pialat, J. B., Link, T. M., Li, X., Souza, R. B., & Majumdar, S. (2010). Cartilage and meniscus assessment using T1rho and T2 measurements in healthy subjects and patients with osteoarthritis. Osteoarthritis and Cartilage, 18(11), 1408–1416. http://doi.org/10.1016/j.joca.2010.07.01
8. Bennett, L. D., & Buckland-Wright, J. C. (2002). Meniscal and articular cartilage changes in knee osteoarthritis: a cross-sectional double-contrast macroradiographic study. Rheumatology, 41(8), 917–23. http://doi.org/10.1093/rheumatology/41.8.917
9. Berthiaume, M.-J., Raynauld, J.-P., Martel-Pelletier, J., Labonté, F., Beaudoin, G., Bloch, D. A., … Raynauld, J.-P. (2005). Meniscal tear and extrusion are strongly associated with progression of symptomatic knee osteoarthritis as assessed by quantitative magnetic resonance imaging. Ann Rheum Dis, 64, 556–563. http://doi.org/10.1136/ard.2004.023796
Figures