5153
Meniscus T2 Relaxation Time in Patients with Varying Degrees of Knee Joint DegenerationRichard Kijowski1, Benjamin Beduhn1, Michael G Fazio1, and Fang Liu1
1Department of Radiology, University of Wisconsin-Madison, Madison, WI, United States
Synopsis
This study was performed to investigate changes in meniscus T2 relaxation time at various stages of knee joint degeneration. T2 mapping was performed on the knees of 121 patients with meniscus tears. T2 of the torn and untorn portions of the medial and lateral meniscus were measured. The severity of radiographic osteoarthritis was assessed using the Kellgren-Lawrence (KL) grading scale. There was a significant difference (p<0.001) in meniscus T2 between KL0, KL1, and KL2 subjects in both the torn and untorn portions of the meniscus with KL2 subjects having the highest T2 and KL0 subjects having the lowest T2.
Introduction
The spin-spin (T2) relaxation time of meniscus has been shown in ex-vivo studies to correlate strongly with the water content and moderately with the dynamic compressive and shear modulus of the tissue [1]. Thus, meniscus T2 may provide information regarding disease-related and treatment-related changes in meniscus composition, microstructure, and biomechanical properties [1-3]. This study was performed to investigate changes in meniscus T2 in patients with varying degrees of knee joint degeneration.Methods
A multi-echo spin-echo T2 mapping sequence was acquired on the knees of 121 patients with isolated tears of the posterior horn of the medial or lateral meniscus identified on subsequently performed arthroscopic knee surgery. Images were acquired using a 3T scanner (Sigma Excite HDx, GE Healthcare) and 8-channel phased-array extremity coil with a TR=1500ms, TE=7,16, 25, 34, 43, and 52ms, 90o flip angle, 16cm field of view, 256 x 192 matrix, 3mm slice thickness, and one signal average. T2 maps were created in MATLAB using a previously described mono-exponential fitting method [1-3]. Regions of interest were placed around the anterior and posterior horns of the medial and lateral meniscus on T2 maps to measure T2 of the torn posterior horn and untorn anterior horn of the meniscus with a tear and T2 of the entire contralateral untorn meniscus. Radiographs were reviewed to determine the severity of knee joint degeneration using the Kellgren-Lawrence grading scale (KL0=no osteoarthritis, KL1=minimal osteoarthritis, KL2=established osteoarthritis) [4]. The severity of cartilage loss within the knee joint at arthroscopy was numerically scored. The type of meniscus tear (vertical, horizontal, complex, or root) was also documented at arthroscopy. Kruskal-Wallis tests, Chi-square tests, and Spearman correlation coefficients were used to investigate the relationship between KL grade and meniscus tear type and the various measured variables.Results
KL2 patients had the highest meniscus T2 and KL0 patients had the lowest meniscus T2 in all meniscus segments (Figure 1). There was a significant difference (p<0.001) in meniscus T2 between KL0, KL1, and KL2 patients in the torn posterior horn and untorn anterior horn of the meniscus with a tear and within the untorn contralateral meniscus (Figures 2 and 3). There was a significant direct moderate correlation (rho=0.535, p<0.001) between meniscus T2 and the severity of cartilage loss in the same compartment of the knee joint. Patients with vertical meniscus tears had significantly lower age, KL grade, T2 of the torn posterior horn of the meniscus with a tear and the untorn contralateral meniscus, and severity of cartilage loss within the tibiofemoral joint when compared to patients with all other tear types. Patients with complex tears had significantly higher T2 of the torn posterior horn of the meniscus with a tear than patients with horizontal and root tears. No significant differences were noted in other variables between patients with complex, horizontal, and root tears (Figures 4 and 5).Discussion and Conclusion
T2 of the entire medial and lateral meniscus has been previously shown to be significantly higher in patients with higher KL grades [3]. However, patients with higher KL grades in this study had much higher frequencies of medial and lateral meniscus tears which raises questions whether the higher meniscus T2 was due to meniscus degeneration or fluid between the fibers of a torn meniscus. Our study has shown that meniscus T2 is significantly higher in both the torn and untorn portions of the medial and lateral meniscus in patients with higher KL grades. Thus, T2 can detect early changes in the composition and microstructure of intact meniscus due to knee joint degeneration prior to the development of meniscus tear. The direct correlation between meniscus T2 and the severity of adjacent cartilage loss observed in our study reflects the important inter-relationship between changes in meniscus and cartilage during knee joint degeneration. Our study confirms the findings of previous studies that vertical meniscus tears tend to occur in younger individuals who have less meniscus degeneration and less overall knee joint degeneration when compared to other tear types as vertical tears are thought to be due to trauma as opposed to joint degeneration [5]. The only distinguishing feature between complex, horizontal, and root tears in our study was that complex tears had higher T2 in the torn portion of the meniscus. Various semi-quantitative grading systems are currently used to assess the degree of meniscus degeneration in osteoarthritis research studies [6-8]. Our results suggest that these methods should be modified to distinguish between vertical tears, root and horizontal tears, and complex tears in their classification schemes.Acknowledgements
We acknowledge support from NIH R01-AR068373-01, GE Healthcare, University of Wisconsin School of Medicine Shapiro Student Research Fellowship Program, and University of Wisconsin Department of Radiology Research and Development Committee.References
[1] M. Son, S.B. Goodman, W. Chen, B.A. Hargreaves, G.E. Gold, M.E. Levenston, Regional variation in T1rho and T2 times in osteoarthritic human menisci: correlation with mechanical properties and matrix composition, Osteoarthritis and cartilage / OARS, Osteoarthritis Research Society, 21 (2013) 796-805. [2] Z.A. Zarins, R.I. Bolbos, J.B. Pialat, T.M. Link, X. Li, R.B. Souza, S. Majumdar, Cartilage and meniscus assessment using T1rho and T2 measurements in healthy subjects and patients with osteoarthritis, Osteoarthritis and cartilage / OARS, Osteoarthritis Research Society, 18 (2010) 1408-1416. [3] I. Rauscher, R. Stahl, J. Cheng, X. Li, M.B. Huber, A. Luke, S. Majumdar, T.M. Link, Meniscal measurements of T1rho and T2 at MR imaging in healthy subjects and patients with osteoarthritis, Radiology, 249 (2008) 591-600. [4] J.H. Kellgren, J.S. Lawrence, Radiological assessment of osteo-arthrosis, Annals of the rheumatic diseases, 16 (1957) 494-502. [5] M. Englund, A. Guermazi, D. Gale, D.J. Hunter, P. Aliabadi, M. Clancy, D.T. Felson, Incidental meniscal findings on knee MRI in middle-aged and elderly persons, The New England journal of medicine, 359 (2008) 1108-1115. [6] C.G. Peterfy, A. Guermazi, S. Zaim, P.F. Tirman, Y. Miaux, D. White, M. Kothari, Y. Lu, K. Fye, S. Zhao, H.K. Genant, Whole-Organ Magnetic Resonance Imaging Score (WORMS) of the knee in osteoarthritis, Osteoarthritis and cartilage / OARS, Osteoarthritis Research Society, 12 (2004) 177-190. [7] D.J. Hunter, G.H. Lo, D. Gale, A.J. Grainger, A. Guermazi, P.G. Conaghan, The reliability of a new scoring system for knee osteoarthritis MRI and the validity of bone marrow lesion assessment: BLOKS (Boston Leeds Osteoarthritis Knee Score), Annals of the rheumatic diseases, 67 (2008) 206-211. [8] D.J. Hunter, A. Guermazi, G.H. Lo, A.J. Grainger, P.G. Conaghan, R.M. Boudreau, F.W. Roemer, Evolution of semi-quantitative whole joint assessment of knee OA: MOAKS (MRI Osteoarthritis Knee Score), Osteoarthritis and cartilage / OARS, Osteoarthritis Research Society, 19 (2011) 990-1002.Figures
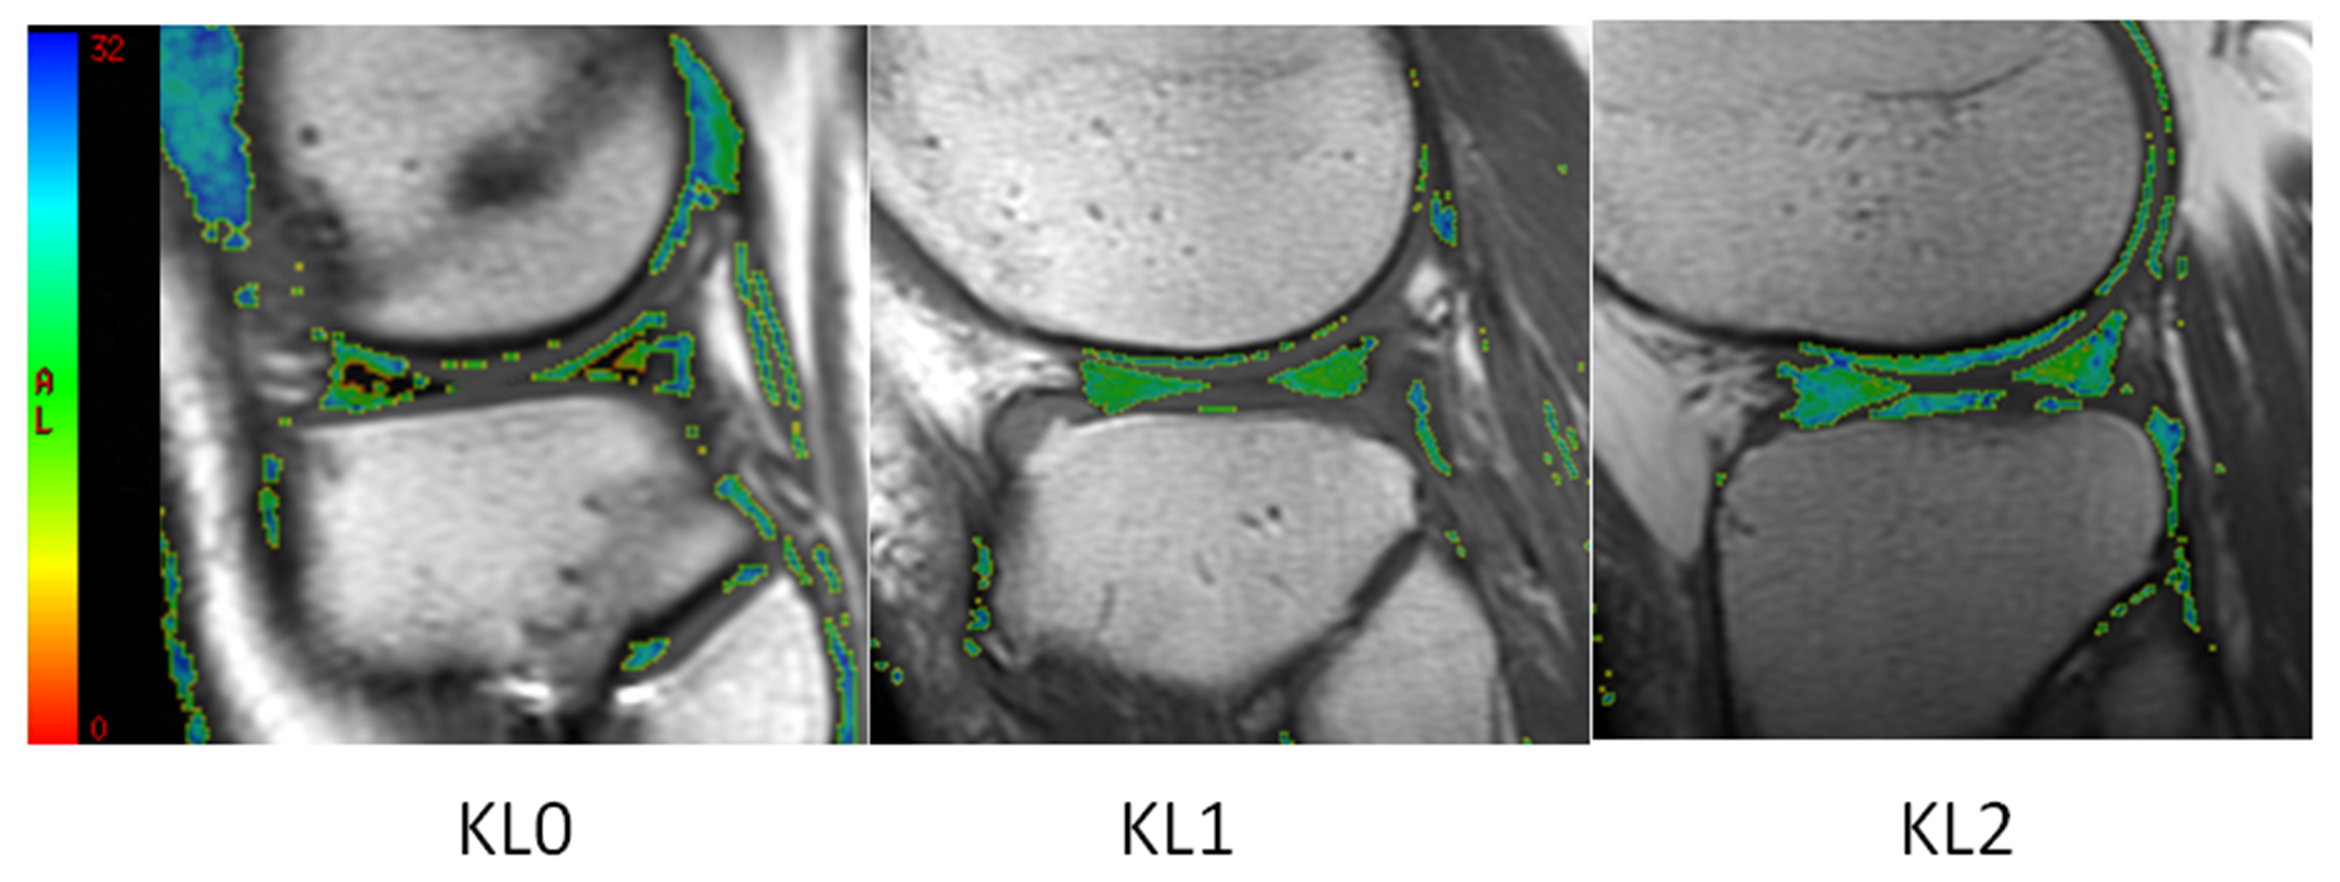
Figure 1: T2 maps
of a surgically confirmed untorn lateral meniscus in patients with KL0, KL1,
and KL2 osteoarthritis show higher meniscus T2 within the anterior and
posterior horns in patients with higher KL grades. Note that the black signal
in the meniscus on the T2 maps of the KL0 patient corresponds to T2 values below
the lower limit of the color scale.
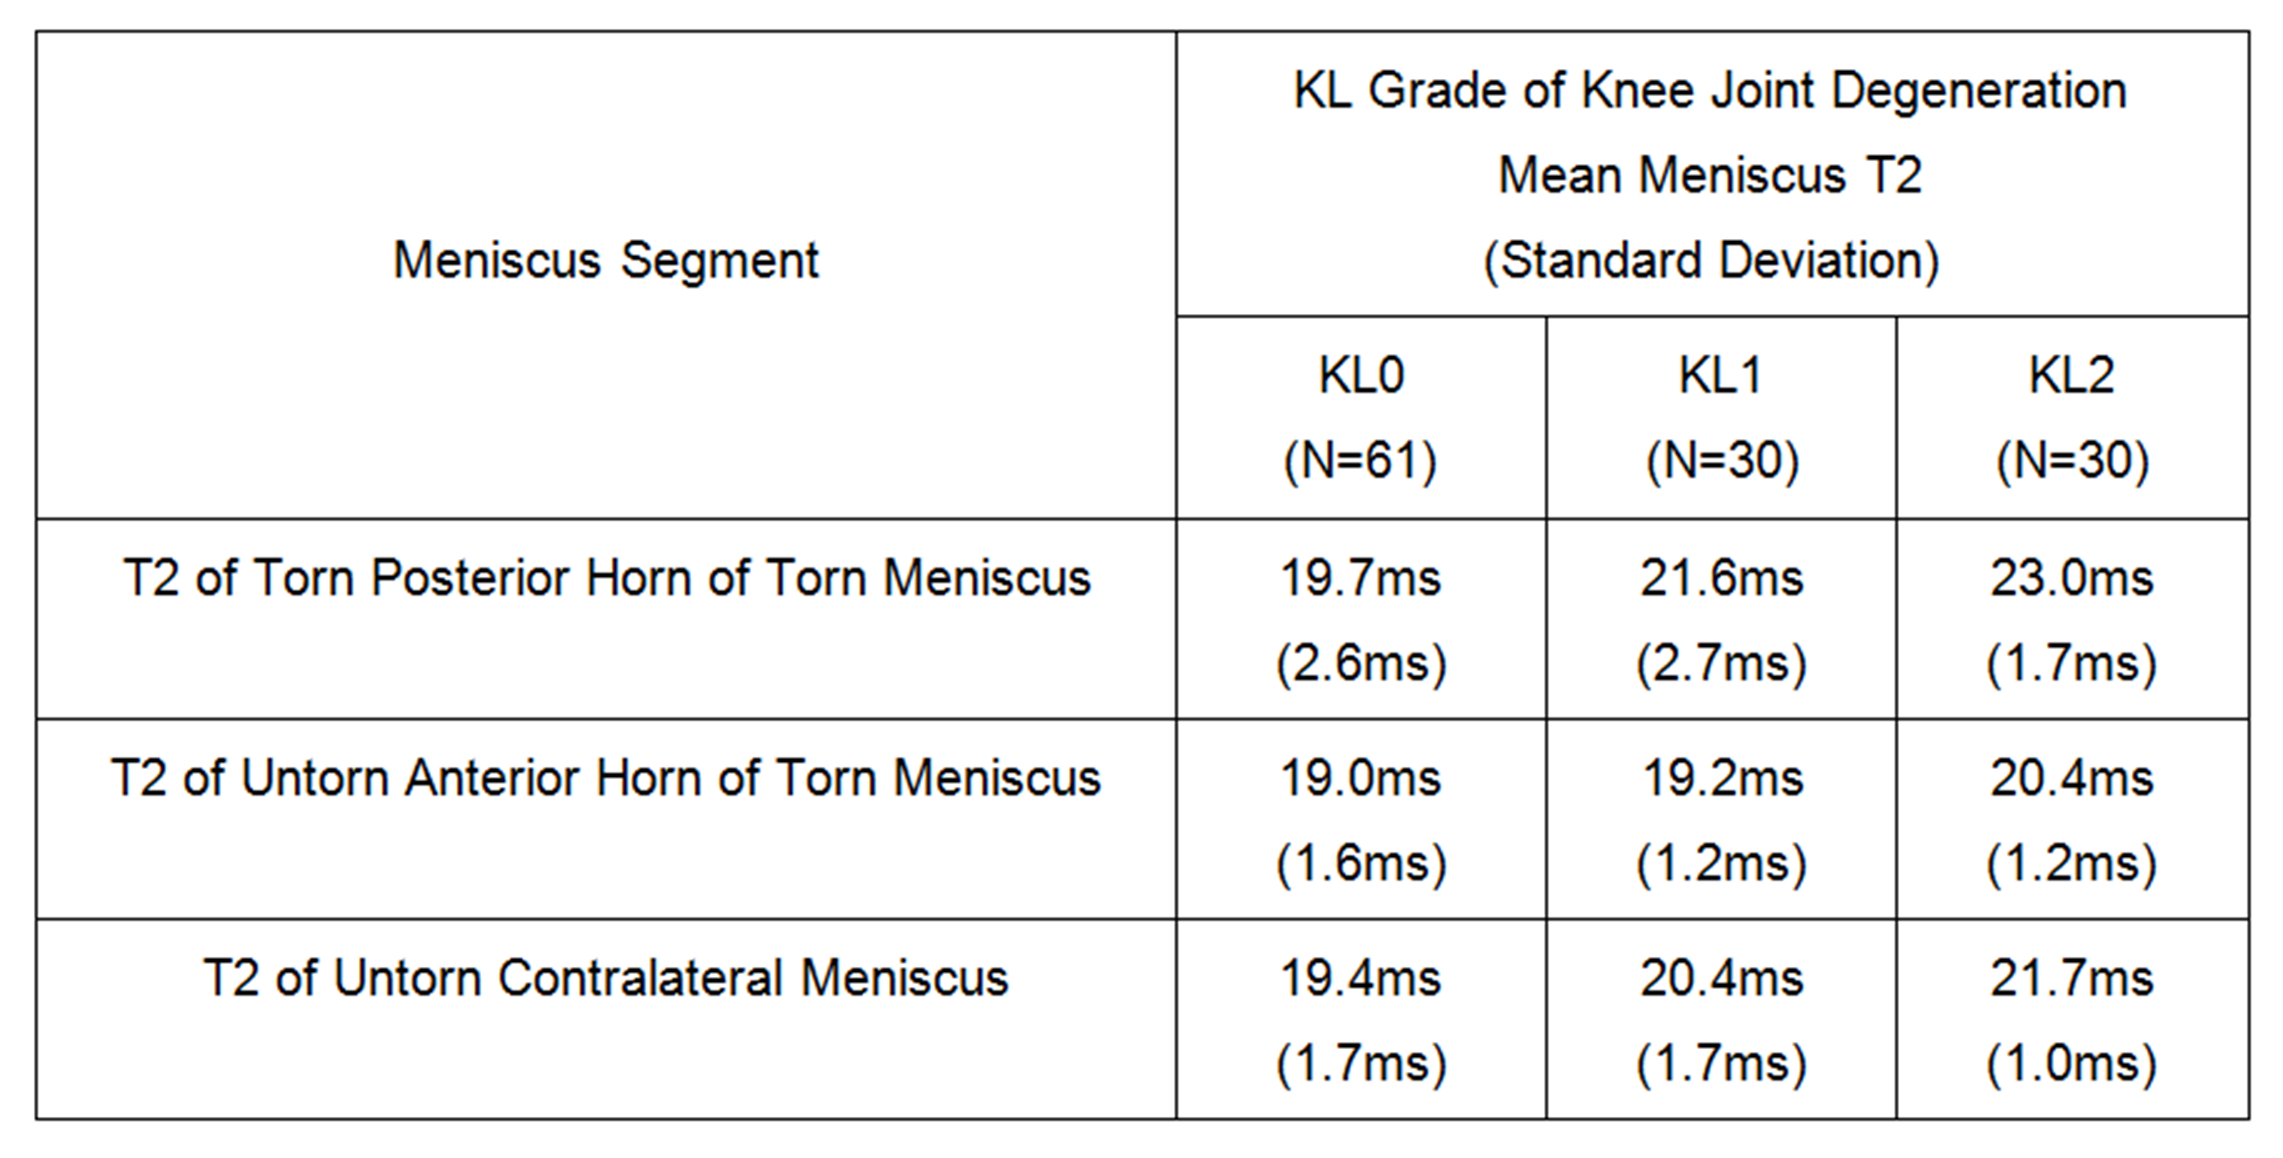
Figure 2: Meniscus
T2 in patients with varying degrees of knee joint degeneration.
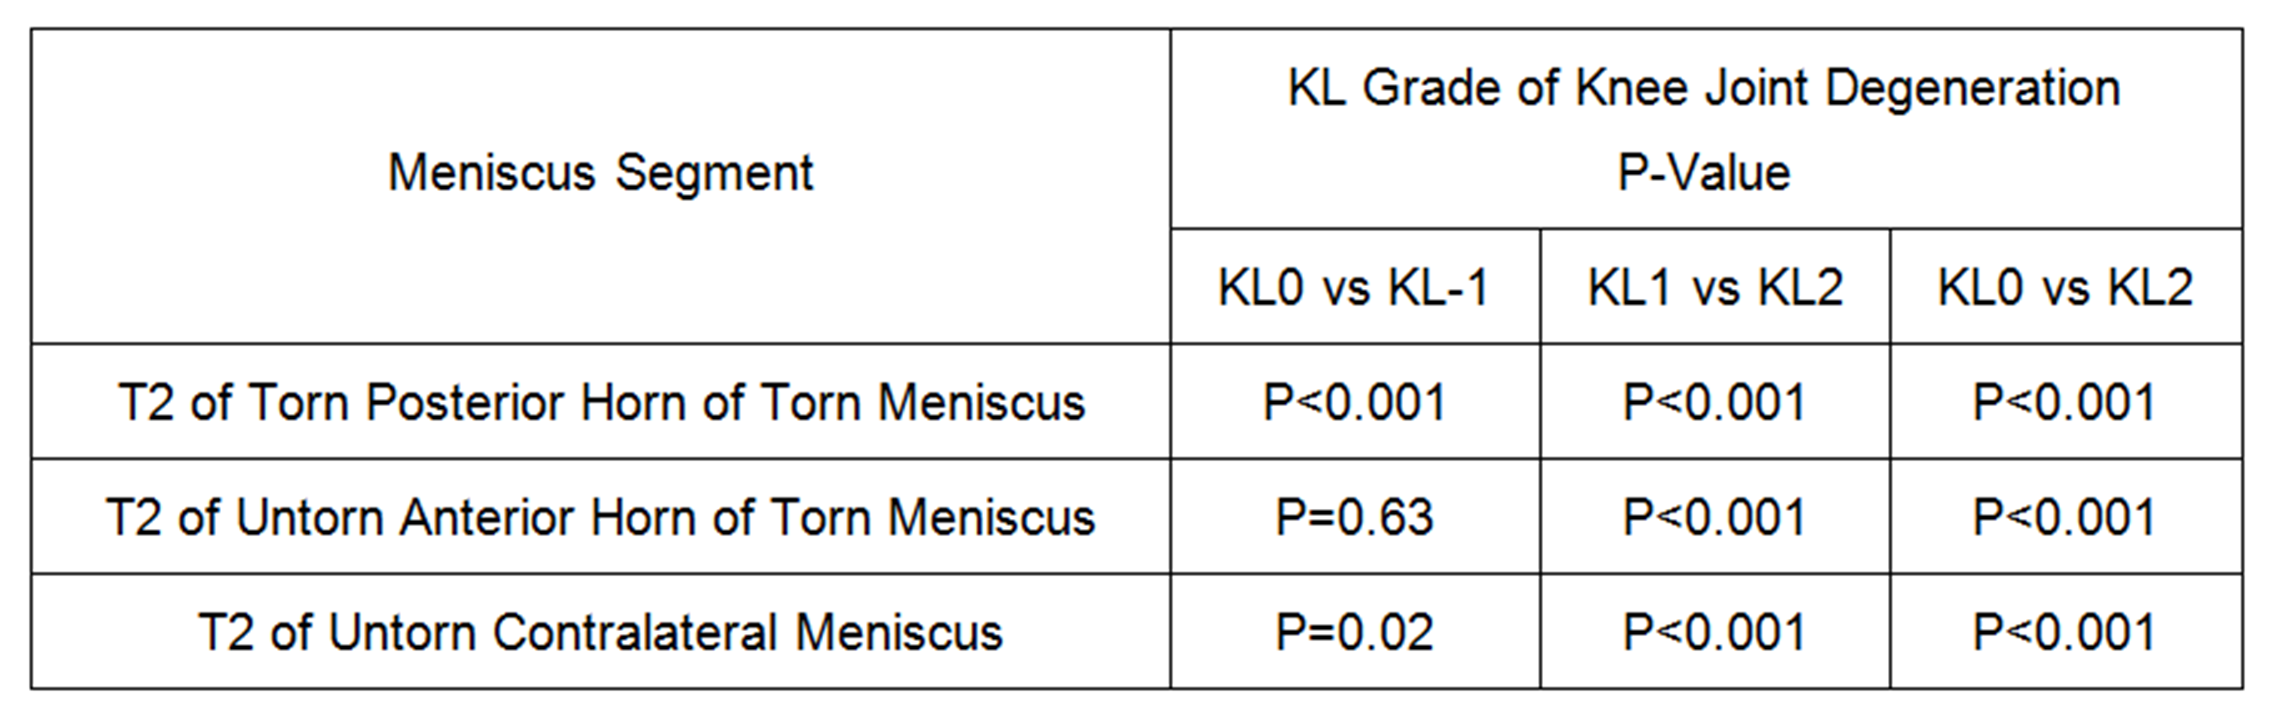
Figure 3: P-values
for differences in meniscus T2 between patients with varying degrees of knee joint
degeneration.
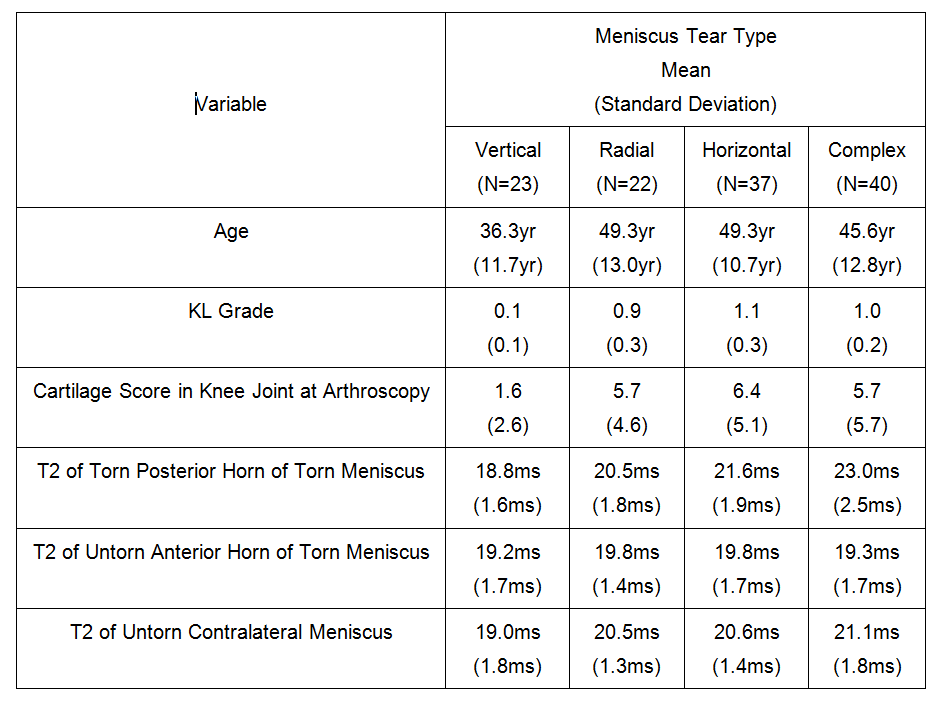
Figure 4:
Demographic, radiographic, arthroscopic, and meniscus T2 variables in
patients with different meniscus tear types.
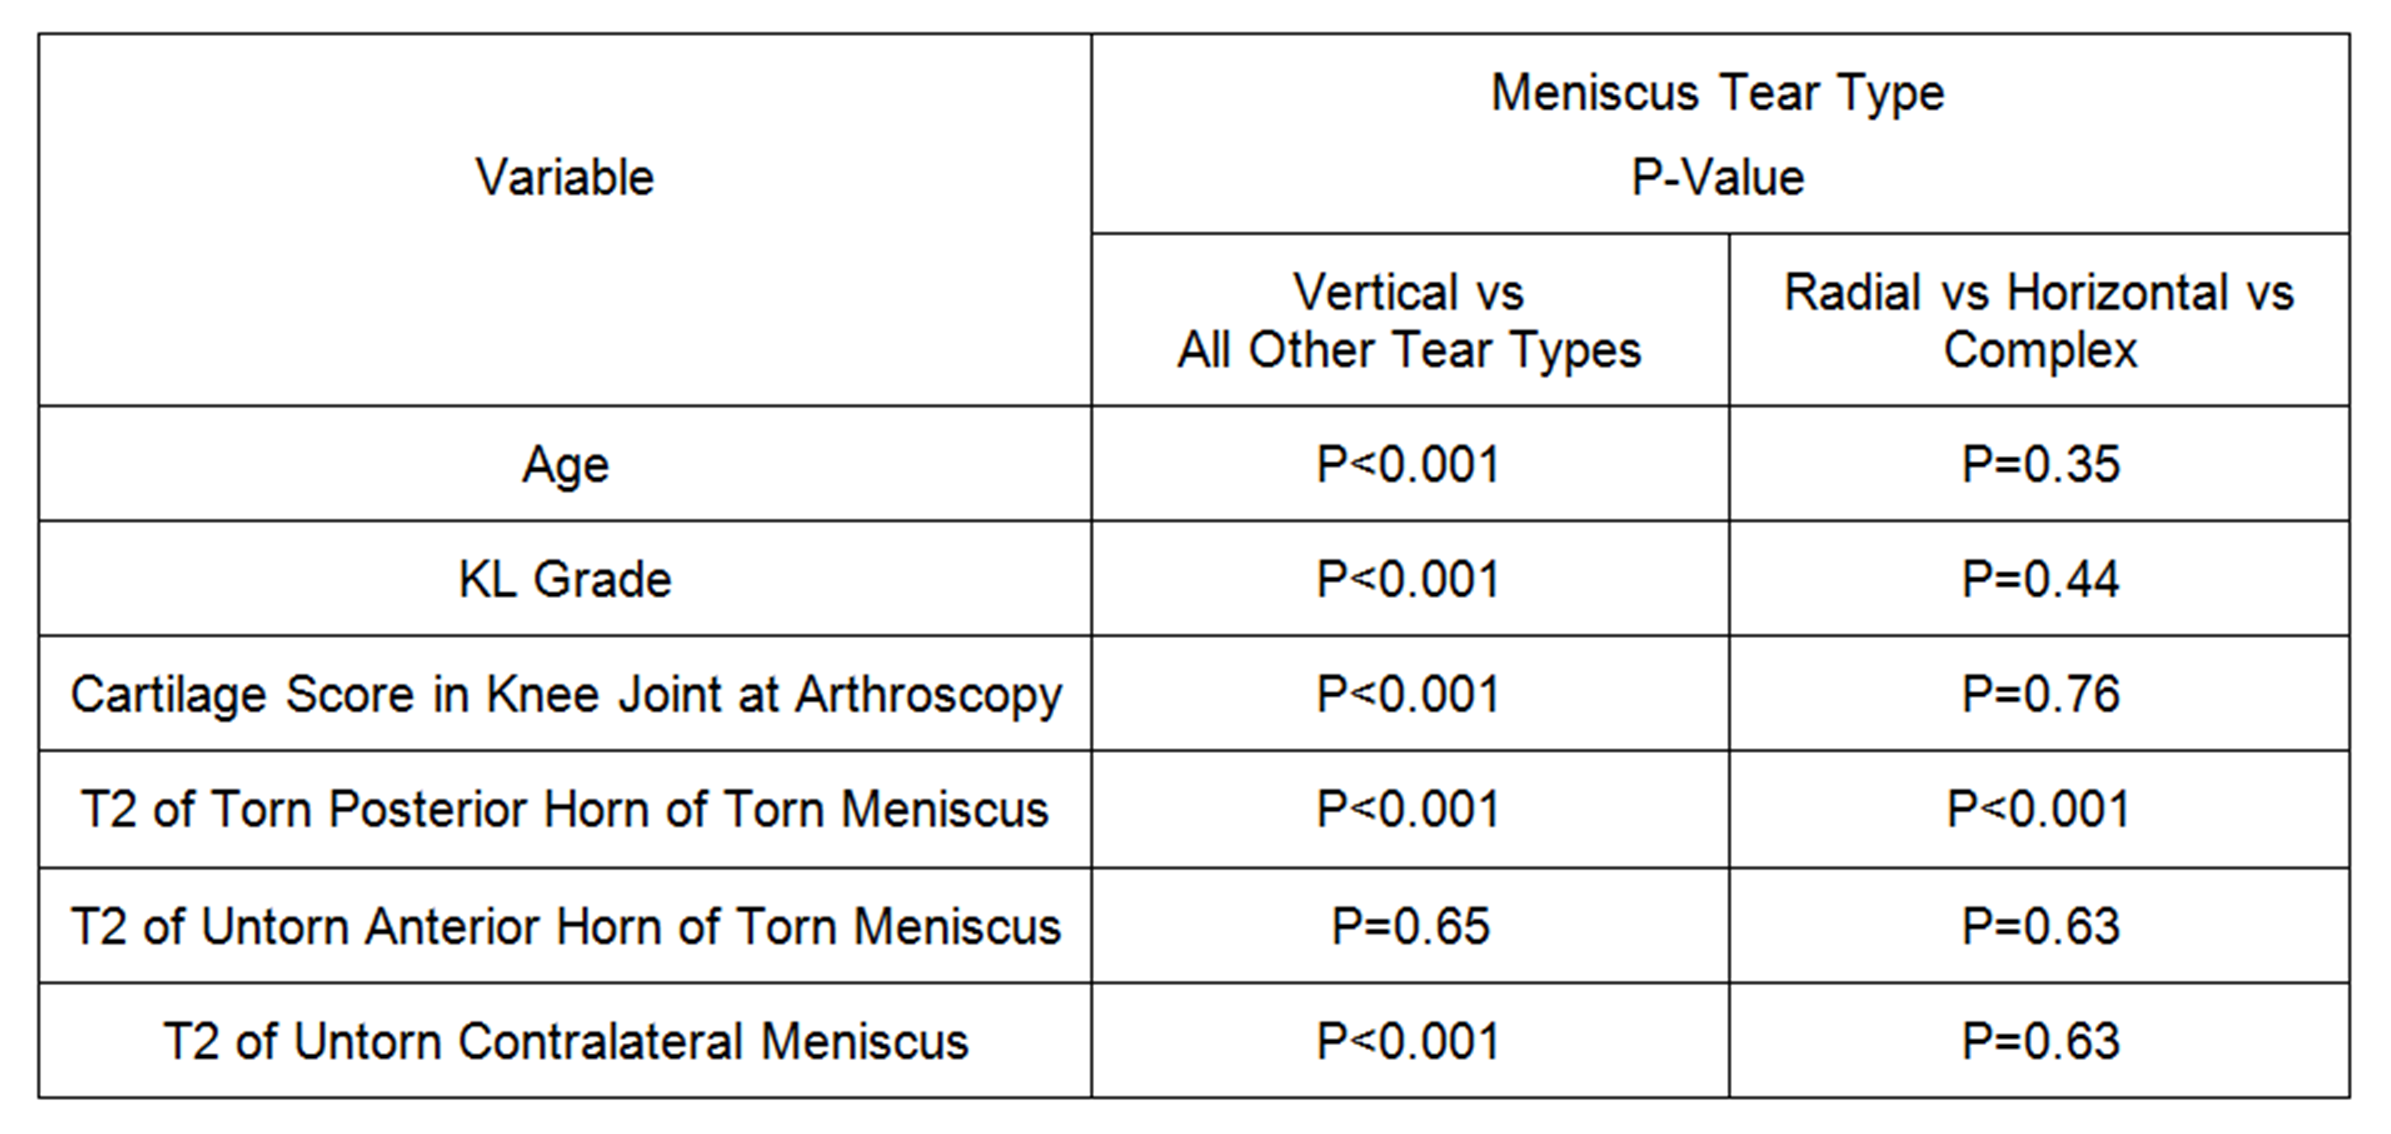
Figure 5:
P-values for differences in
demographic, radiographic, arthroscopic, and meniscus T2 variables between
patients with different meniscus tear types.