5146
Comparison of whole-body morphologic and functional MRI with automated "bone subtraction" CT-image analysis for monitoring of longitudinal spine involvement in patients with multiple myeloma1Radiology, Eberhard-Karls-University Tuebingen, Tuebingen, Germany, 2Radiology, Eberhard-Karls-Univesity Tuebingen, Tuebingen, Germany
Synopsis
Imaging diagnosis and therapy monitoring of multiple myeloma (MM) is challenging due to the combined bone and bone marrow involvement and at the same time often imperative due to possible failure of hematological markers (e.g. non-secretory myeloma). MRI is the most powerful MM-imaging technique for visualization of medullar involvement whereas CT optimally detects myeloma bone-disease (BMD). A new CT post-processing software (bone subtraction-BS) is generating subtraction (difference) maps of baseline and follow-up non-enhanced CT exams highlighting the course of BMD. Hence, the purpose of this study was to assess strengths and limitations of these two imaging modalities for longitudinal disease monitoring.
Synopsis (Rationale)
Imaging
diagnosis and therapy monitoring of multiple myeloma(MM) is challenging due to
the combined bone and bone marrow involvement and at the same time often
imperative due to possible failure of hematological markers (e.g. non-secretory
myeloma).
MRI is the most
powerful MM-imaging technique for visualization of medullar involvement whereas
CT optimally detects myeloma bone-disease (BMD). A new CT post-processing
software (bone subtraction-BS) is generating subtraction(difference) maps of baseline
and follow-up non-enhanced CT exams highlighting the course of BMD.
Hence, the
purpose of this study was to assess strengths and limitations of these two
imaging modalities for longitudinal disease monitoring.Manuscript body
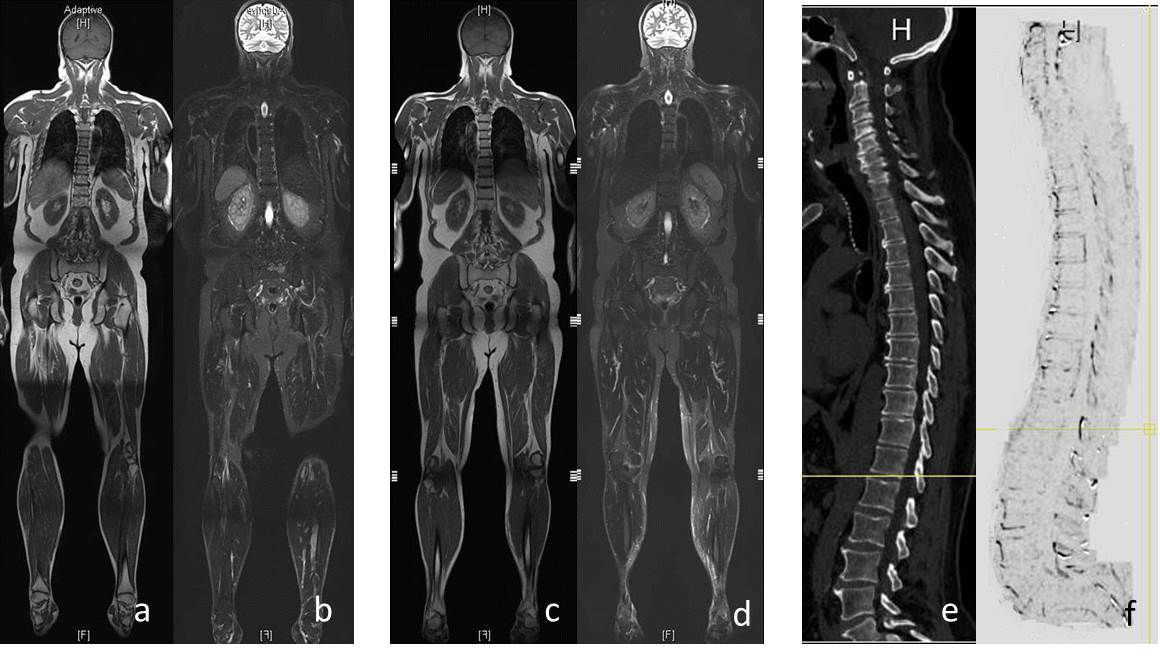
Material and Methodics: Included were 31 consecutive myeloma patients (17 male; mean age, 59.20 ± 8.08y) who underwent 154 repeated whole-body MRI(76) and whole-body reduced-dose MDCT(78) at our institution between June 2013 and September 2016.
Bone marrow involvement was evaluated by qualitative MR-image analysis using coronal T1w-TSE and STIR and ROIs for signal-intensity measurements both in the lesions and at apparently non-involved medullar areas generating ratios to the paraspinal musculature as well as quantitative image analysis using DWI(b, 0/400/800s/mm2) measurements quantifying the mean apparent diffusion coefficient(ADC).
Disappearance of focal lesions or significant increase in T2-signal intensity was considered remission. No change was classified stable disease. New/enlarging lesions were classified disease progression(PD). These parameters were correlated with hematological myeloma response according to standard criteria[1].
Additionally, non-enhanced wb-CT was performed using thin-collimation, 120 kV tube voltage and 70 mAs effective tube current time product[2]. Reconstructed section thickness was 1 mm using an intermediate (B50) tissue spatial resolution kernel. Subtraction maps were created for the entire spine[3].
Changes in bone attenuation were classified as new or enlarging (progression) vs. stable/remission. On resulting gray shaded maps darkening means loss of bone(+bone marrow) attenuation in either focal or diffuse fashion whereas whitening represents increased bone(+bone marrow) attenuation. Quantification using ROIs was performed in apparently not focally(but presumably diffusely) involved bone(pelvis and thoracic + lumbar spine) regions for comparison with MRI signal intensity changes.
Bone subtraction maps were read in combination with hematological markers and classified as PD vs. SD/remission. For statistical purposes, we sub-grouped hematological response categories similarly to those applied for CT-imaging(progression vs. stable/response).
RESULTS: According to hematologic al parameters 47 follow up-time points were evaluated resulting in 14 patients achieving CR, 18 PR and 15 PD at FU.
Qualitative and semiquantitative MRI diagnosis using lesion-to- musculature signal intensity ratios yielded: 13 complete remission(CR), 20 partial remission(PR) and 14 progression(PD). Patients with PD: T1w-TSE signal changed in focal lesions from 286.42±94.97 to 218.34 ±31.23(p=0.140); T2w signal changed in lesions from 45.30±10.44 into 85.80±37.54(p=0.173) and ADC from 1.25 ±0.3 to 0.97±0.2(p=0.500). T1w-TSE signal change in non-involved medullar areas from 344.30±116.86 into 313.60±152.08(p=0.547) and T2w signal change in lesions from 66.93±43.71 into 77.05 ±50.95(p=0.206). Patients with (SD)/remission: T1w-TSE signal change in focal lesions from 324.54±150.47 to 269.74 ±136.76(p=0.114), T2w signal change in lesions from 127.04 ±141.58 to 146.12 ±98.28 (p=0.518) and in ADC from 1.10 ±0.67 to 0.94 ± 0.66(p=0.139). T1w-TSE signal changed in non-involved medullar areas from 450.38± 220.19 into 295.2±101.24(p=0.499) and T2w signal change in lesions from 68.85. ±48.76 into 48.8 ±23.06(p=0.022).
Quantitative CT-analysis: Bone subtraction classified patients based on new occurrence/enlarging lytic bone lesions into PD(12 patients) or into (SD)/remission (35 patients) if the bone status remained unchanged.
Quantification of bone (+ bone marrow) attenuation at apparently non-involved yielded following results: Progressive patients: Maximum HU(Hounsfield Units) in bone(+ bone marrow) changed in PD from 377.92 ±116.77 to 342.56±145.06(p=0.014). Mean HU in bone changed in PD from 80.15±86.08 to 82.13±85.61(p=0.657). Minimum HU in bone changed in PD from -122.74±169.14 into -89.67±143.89(p=0.085). Patients with (SD)/remission: Maximum HU minimally changed from -278.12 ±159.95 to 254.01±153.59(p=0.018). Mean HU changed from 72.82±73.16 to 74.93±80.59(p=0.517). Minimum HU changed from -89.13±110.61 to -51.40±112.61(p=0.001).
Changes of mean HU units in bone(+ bone marrow) in CT correlates significant with changes in measured ADC values(p=0.050,r=0.602). Changes of minimum HU units in bone marrow in CT correlates significant with changes in T1w- signal intensity in measured lesions(p=0.018,r=-0518).
DISCUSSION: Considering hematologic laboratory as the standard-of-reference the use of qualitative and semiquantitative MRI for focal longitudinal lesion evaluation was indicative for the course of the disease but did not reach statistical significance contrary to most parameters assessed by CT bone attenuation measurements on bone subtraction maps. Nevertheless, there was good correlation between the course of bone attenuation measurements, T1w-signal and the course of ADC-values.
CONCLUSION: Longitudinal CT-attenuation measurements showed better correlation with hematological diagnosis as MRI.
Acknowledgements
No acknowledgement found.References
1. International Myeloma Working G. Criteria for the classification of monoclonal gammopathies, multiple myeloma and related disorders: a report of the International Myeloma Working Group. British Journal of Haematology 2003; 121:749-757
2. Horger M, Kanz L, Denecke B, Vonthein R, Pereira P, Claussen CD, Driessen C. The benefit of using whole-body, low-dose, nonenhanced, multidetector computed tomography for follow-up and therapy response monitoring in patients with multiple myeloma. Cancer. 2007 Apr 15;109(8):1617-26.
3. Viola P. W.W., Alignment by maximization of mutual information, International Journal of Computer Vision. 24 (1997) 137-54.
Figures