5145
Radiomics of Musculoskeletal Masses Using T2-Weighted Magnetic Resonance Images1Radiology, UT Southwestern, Dallas, TX, United States, 2Radiation Oncology, UT Southwestern, Dallas, TX, United States
Synopsis
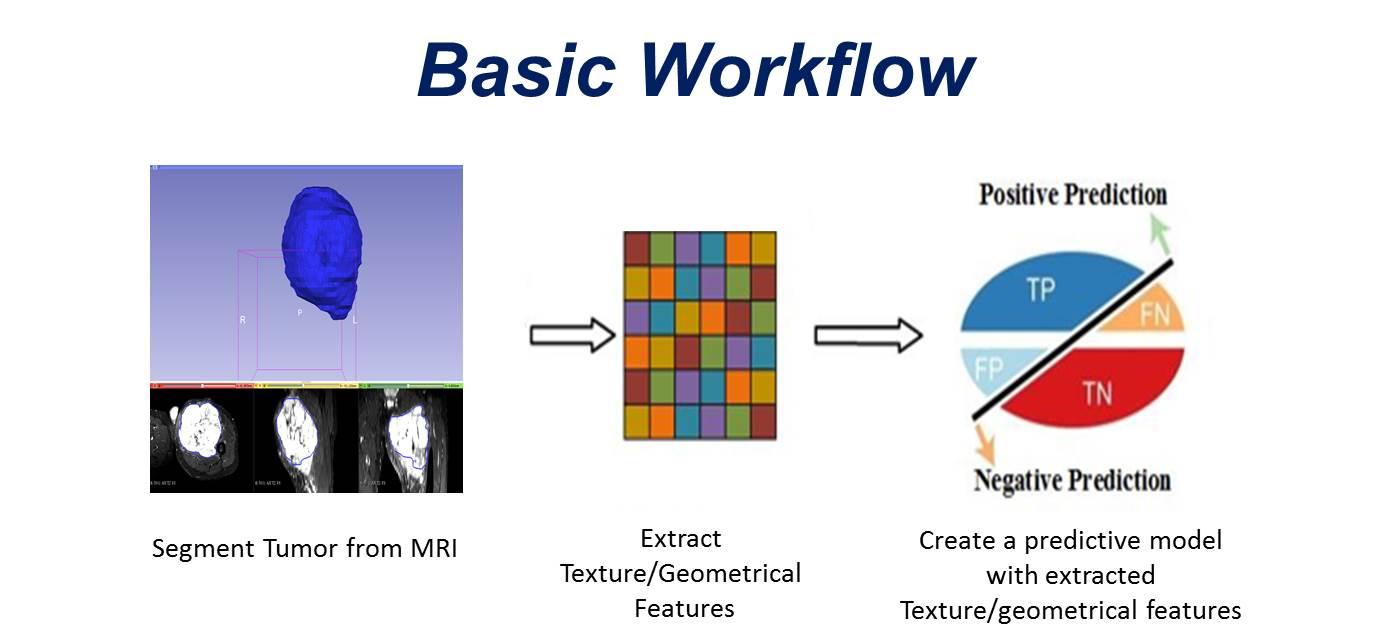
Texture analysis has yet to be exploited in musculoskeletal tumors. In this study we aimed to create a novel predictive model based on features of benign and malignant musculoskeletal masses and test this model against existing methods used in other parts of the body. Our workflow shows promise for creating accurate classifiers of benign and aggressive tumors based on T2-weighted MRI images.
Introduction
Texture analysis has been used as an image processing technique to create statistical information from the geometry of MRI data – the so called "agnostic features" as described in the radiomics literature1. These techniques have shown value in evaluation of tumor prognosis in lung cancer2, intracranial glioma3, and prostate cancer4, but have yet to be validated in the musculoskeletal system. The purpose of this study was to build a predictive model using radiomics to differentiate benign and malignant musculoskeletal masses.Methods
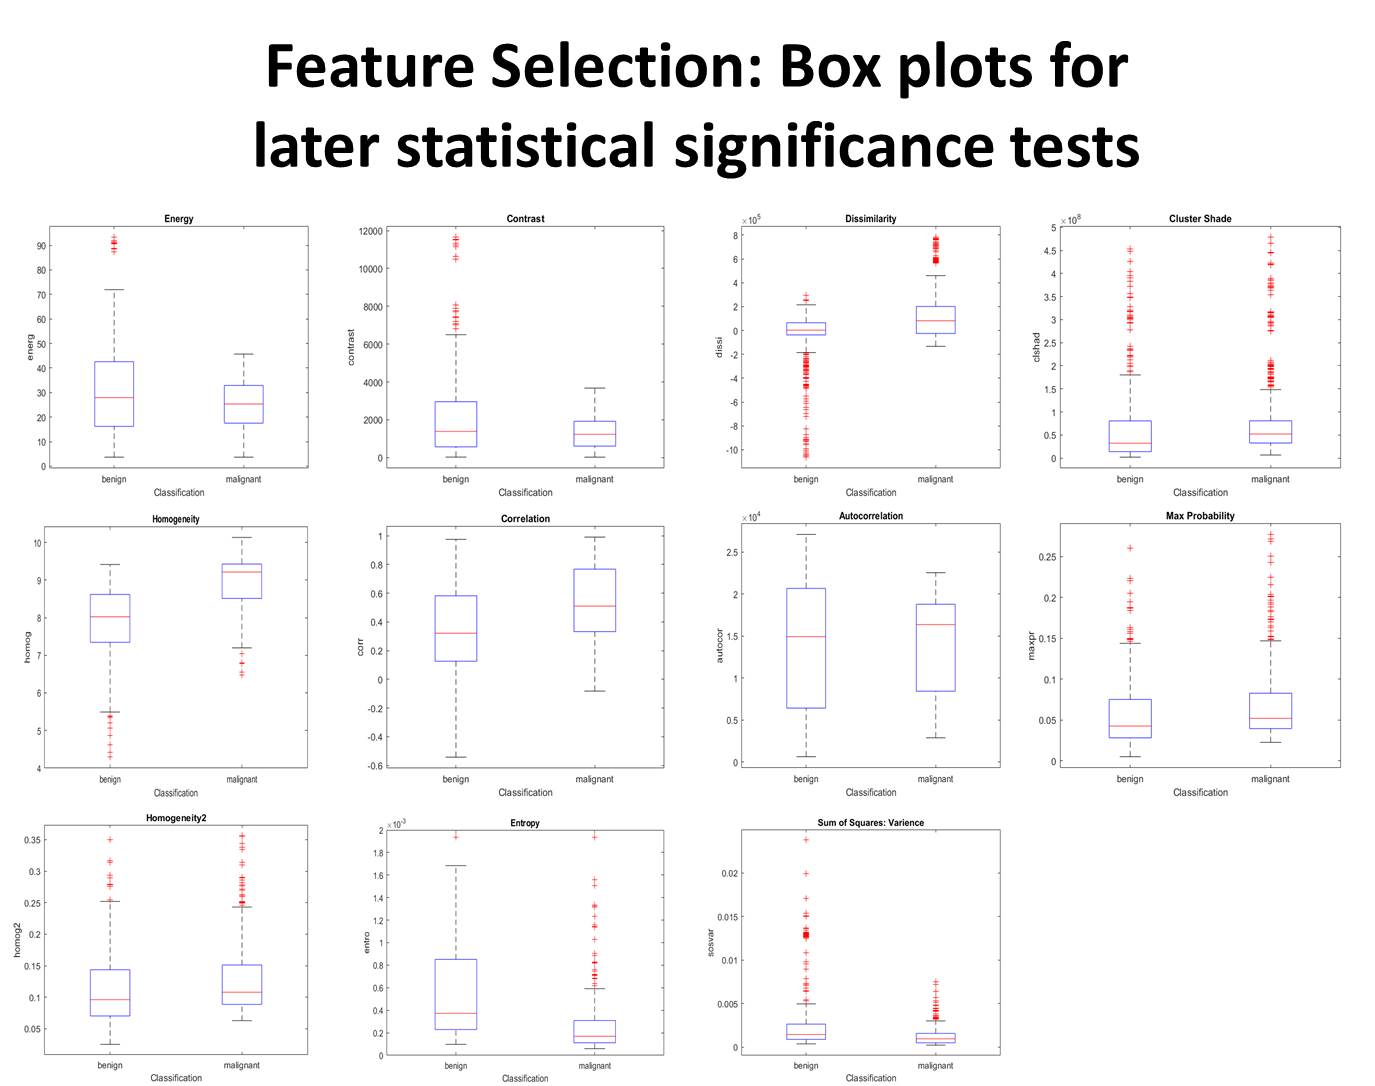
Volumes of interest were drawn for benign and malignant musculoskeletal tumors on fat saturated T2 weighted MR images. 3D grey level co-occurrence matrices (GLCM) were obtained in 13 directions with 256 grey levels and 3 pixel offsets for each lesion. Predictive models were trained via logistic regression and Sequential Minimal Optimization for Support Vector Machine Learning using polykernel and Radial Basis Function kernels, and Multilayer Perceptron by employing Waikato Environment for Knowledge Analysis software. Models were three-fold cross-validated, 7 geometric and 21 textural features were analyzed and receiver operator (ROC) characteristics were calculated. Each textural parameter was subjected to boxplot, logistic regression, and Spearman Rank Correlation coefficient analysis.Results
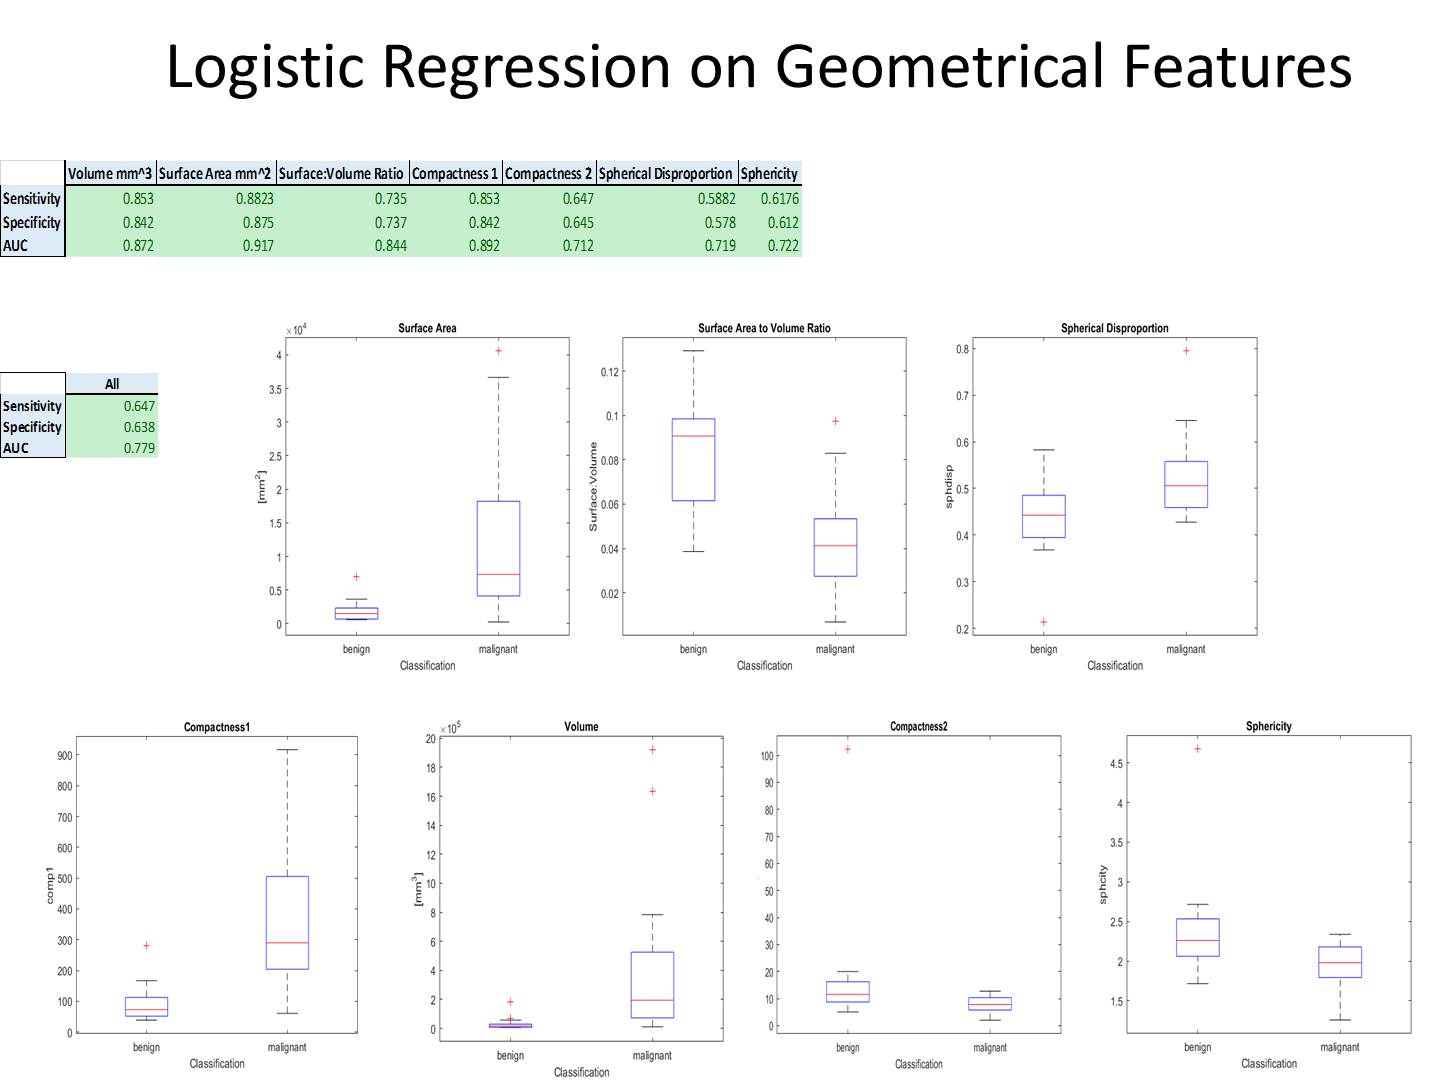
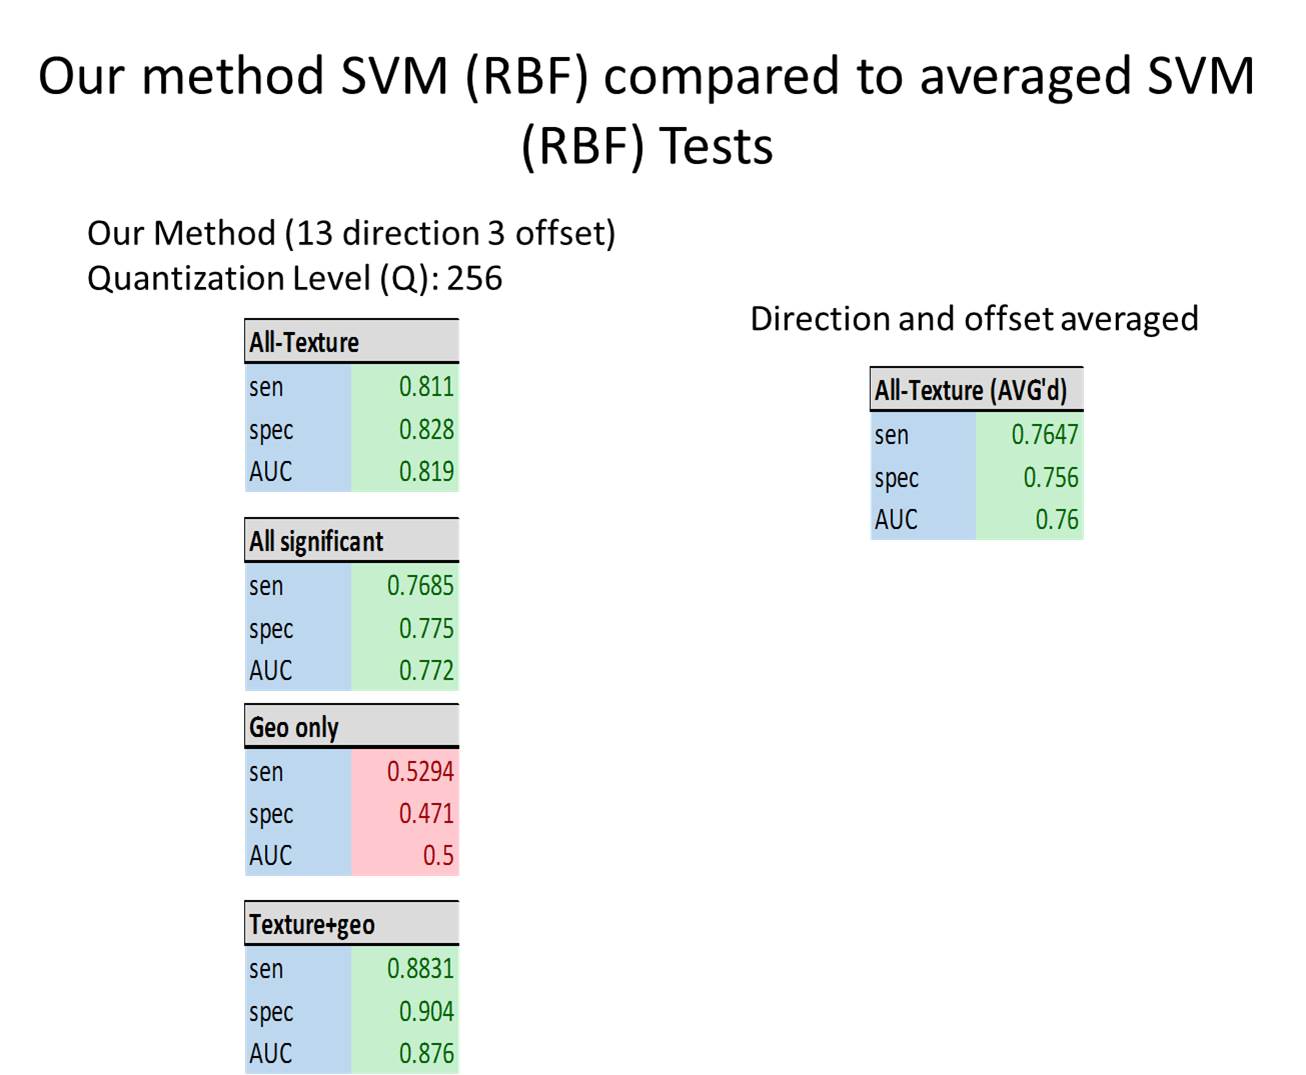
Among 34 masses (18 benign and 16 malignant), the geometric feature analysis with logistic regression for texture and geometric features were as follows (sensitivity, specificity, AUC): volume (0.853,0.842,0.872), surface area (0.882,0.875,0.917), surface area:volume ratio (0.735,0.737,0.844), compactness1 (0.853,0.842,0.892), compactness2 (0.647,0.645,0.712), spherical disproportion (0.588,0.578,0.719), sphericity (0.618,0.612,0.722), and overall (0.647,0.638,0.779). Spearman Rank Correlation test showed greater statistical significance in the 21 features (15/21) with 13 phases 3 pixel offset GLCM compared to averaging over all directions (5/21). Additionally, our GLCM models based on texture parameters (0.811,0.828,0.819) and combined texture/geometric parameters (0.883,0.904,0.876) outperformed prior directional averaging methods (0.765,0.756,0.760).Discussion
Combination of geometrical and textural features have demonstrated good performance even before optimization of feature selection. An advantage of our predictive model is that it consists of two phases, Pareto solution generation and best solution selection. Additionally our use of 13 directions and grey level quantization (Q) of 256 preserves texture information greater than typically used (Q ~64)5.Conclusion
These preliminary results show that the novel radiomics predictive model to classify benign and malignant musculoskeletal masses is an encouraging technical development that shows higher accuracy for combined texture/geometric analysis as compared to prior directional averaging method. Future investigations will compare accuracy with other MRI sequences including diffusion weighted images and post-contrast T1 weighted images.Acknowledgements
No acknowledgement found.References
1. Gillies RJ, Kinahan PE, Hricak H. Radiomics: Images are more than pictures, they are data. Radiology. 2016;278(2):563-577.
2. Grove O, Berglund AE, Schabath MB, et al. Quantitative computed tomographic descriptors associate tumor shape complexity and intratumor heterogeneity with prognosis in lung adenocarcinoma. PLos One. 2015;10(3);e0118261.
3. Gevaert O, Mitchell LA, Achrol AS, et al. Glioblastoma multiforme: exploratory radiogenomic analysis by using quantitative image features. Radiology. 2014;273(1):168-174.
4. Vignati A, Mazzetti S, Giannini V, et al. Texture features on T2-weighted magnetic resonance imaging: new biomarkers prostate cancer aggressiveness. Phys Med Biol. 2015;60(7):2685-2701.
5. Depeursinge A, Foncubierta-Rodriguez A, Van De Ville D, et al. Three-dimensional solid texture analysis in biomedical imaging: Review and opportunities. Medical Image Analysis. 2014;18(1):176-96.
Figures