5144
Differential Diagnosis of Myeloma, Lymphoma, and Metastatic Cancer in the Spine Using DCE-MRI Kinetic ParametersNing Lang1, Huishu Yuan1, and Min-Ying Su2
1Department of Radiology, Peking University Third Hospital, Beijing, People's Republic of China, 2Tu and Yuen Center for Functional Onco-Imaging, Department of Radiological Sciences, University of California, Irvine, CA, United States
Synopsis
A retrospective DCE-MRI of 23 patients with confirmed myeloma and 13 patients with spinal lymphoma were found. A group of 76 patients with different metastatic cancers in the spine was used as a comparison group. Three heuristic parameters: the steepest wash-in enhancement ratio, the initial area under the curve (IUAC) enhancement ratio, and the wash-out slope were measured. In the ROC analysis based on the wash-out slope, myeloma can be differentiated from lymphoma with AUC=0.913, and from mets with AUC=0.828. The wash-out slope can also differentiate lung mets from breast mets with AUC=0.812, and from thyroid mets with AUC=0.891.
Introduction
Patients presenting pain in the spine are suspected to have lesions compressing the spinal cord, and often recommended to receive MRI for diagnosis. For patients who do not have a known disease, a correct diagnosis of the detected lesion is critical for guiding subsequent workup procedures (such as additional test, imaging or biopsy). Very often the morphological appearance of bone erosion and soft tissue masses that compress the spinal cord are similar on pre- and post-contrast MRI, and difficult to be differentiated. DCE-MRI may provide additional information to further characterize the detected lesion for diagnosis, staging or therapy monitoring. For patients who do not have history of cancer, if the type of metastatic cancer can be predicted, it will be very helpful to decide the imaging examination that need to be done next to find the primary cancer.Methods
In a retrospective review of spinal MRI that included a DCE sequence, a total of 23 patients with confirmed myeloma (11 patients with multiple lesions, and 12 patients with a solitary lesion, 11 male 12 female, mean age 54) and 13 patients with spinal lymphoma (8 male 5 female, mean age 56) were found. We have previously reported a group of 76 patients with metastatic cancer (41 male 35 female, mean age 56), and they were used as a comparison group. The primary cancer types were: 35 Lung, 11 Thyroid, 12 Breast, 7 Prostate, 7 Liver, 4 Kidney. MR scans were performed on a 3T Siemens system. After the abnormal region was identified, DCE-MRI was performed using the 3D VIBE sequence, with TR=4.1ms, TE=1.5 ms, flip angle=10°, matrix=256×192 and FOV=250×250 mm. Approximately 30 slices with 3-mm thickness were prescribed to cover the abnormal vertebrae. The contrast agents, 0.1 [mmol/kg] Gd-DTPA, was injected after one set of pre-contrast images was acquired. A total of 12 frames were acquired, and the total DCE-MRI time period was about 160 seconds. For each case, two ROI were manually placed on an area that showed the strongest enhancement, and the signal intensity time course was measured. Three heuristic parameters were measured: the steepest wash-in enhancement ratio [(S2-S1)/S0] (S1 and S2 were two adjacent time points that showed the greatest signal enhancement); The initial area under the curve (IAUC) enhancement ratio by averaging the signal intensities of all data points upto around 67 seconds, and normalized to the pre-contrast S0 [(S2+S3+S4+S5)/4/S0]; and the wash-out slope [(Slast-Speak)/Speak x 100%], or if no peak using the signal intensity at 67 seconds as the reference [(Slast-S67s)/S67s x 100%]. These parameters were used in the ROC analysis for making differential diagnosis.Results
For the 36 myeloma+lymphoma cases, two region of interest (ROI’s) were manually drawn to measure the DCE time course for reproducibility analysis, results shown in Figure 1. Figures 2-4 show 3 case examples with DCE enhancement kinetics. The two myeloma cases clearly show the wash-out DCE pattern, and the lymphoma shows the plateau DCE pattern. This wash-out vs. plateau DCE patterns were commonly observed for all myeloma and lymphoma cases, respectively, and was the best diagnostic feature. In ROC analysis, there was no significant difference between multiple and solitary myeloma cases, so they were combined. We also analyzed the differential diagnosis capability with respect to the metastatic cancers. The scatter plot of the wash-out slope for three groups of lesions is shown in Figure 5. In the ROC analysis based on the wash-out slope, myeloma can be differentiated from lymphoma with AUC= 0.913, and from mets with AUC = 0.828. The diagnostic performance of the wash-in and IAUC enhancement ratio were not as good as that of the wash-out slope. The wash-out slope can also differentiate breast mets from lung mets with AUC=0.812, and between thyroid mets and lung mets with AUC=0.891.Discussion
Our results show that a simple heuristic analysis to calculate the wash-out slope from the measured DCE kinetics can yield parameters to differentiate myeloma from lymphoma and metastatic cancer with a very high AUC. Metastatic disease to bone is the most common malignant process in the skeleton. It is 25 to 35 times more common than any primary bone tumor. Myeloma is the most common malignant primary bone tumor, accounting for approximately 10% of all hematologic malignancies. Primary lymphoma of bone is uncommon, accounting for approximately 5% of malignant primary bone tumors. Although their incidence rates are lower than mets, these are encountered often in clinical practice, and DCE-MRI wash-out slope may provide a simple, and very easy-to-measure, criterion to aid in diagnosis.Acknowledgements
No acknowledgement found.References
No reference found.Figures
Figure
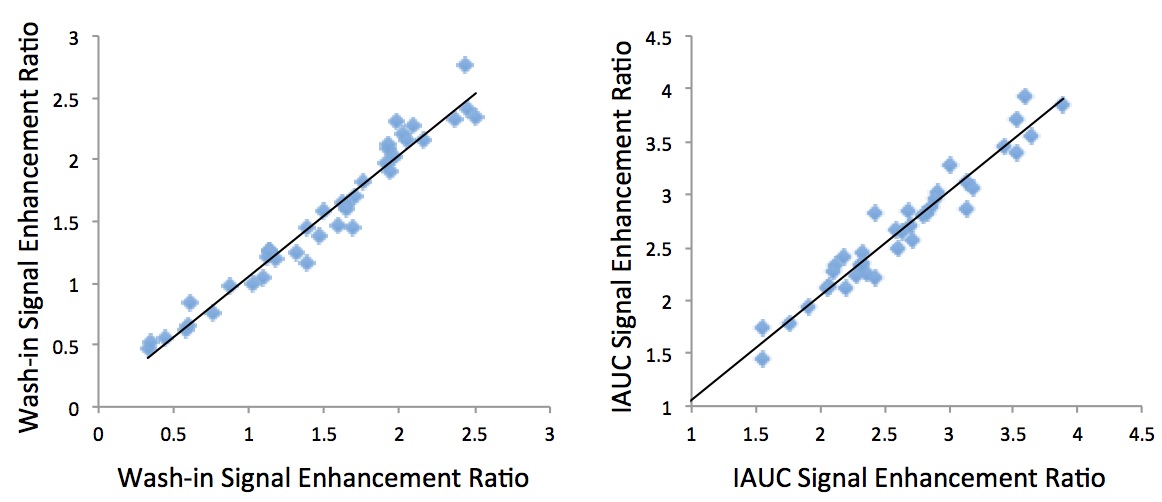
1 shows the Pearson correlation of the analyzed
wash-in enhancement ratio and the IAUC enhancement ratio from two separately
drawn ROI’s for the reproducibility analysis. The correlation is extremely high
with coefficient r=0.98.
Figure
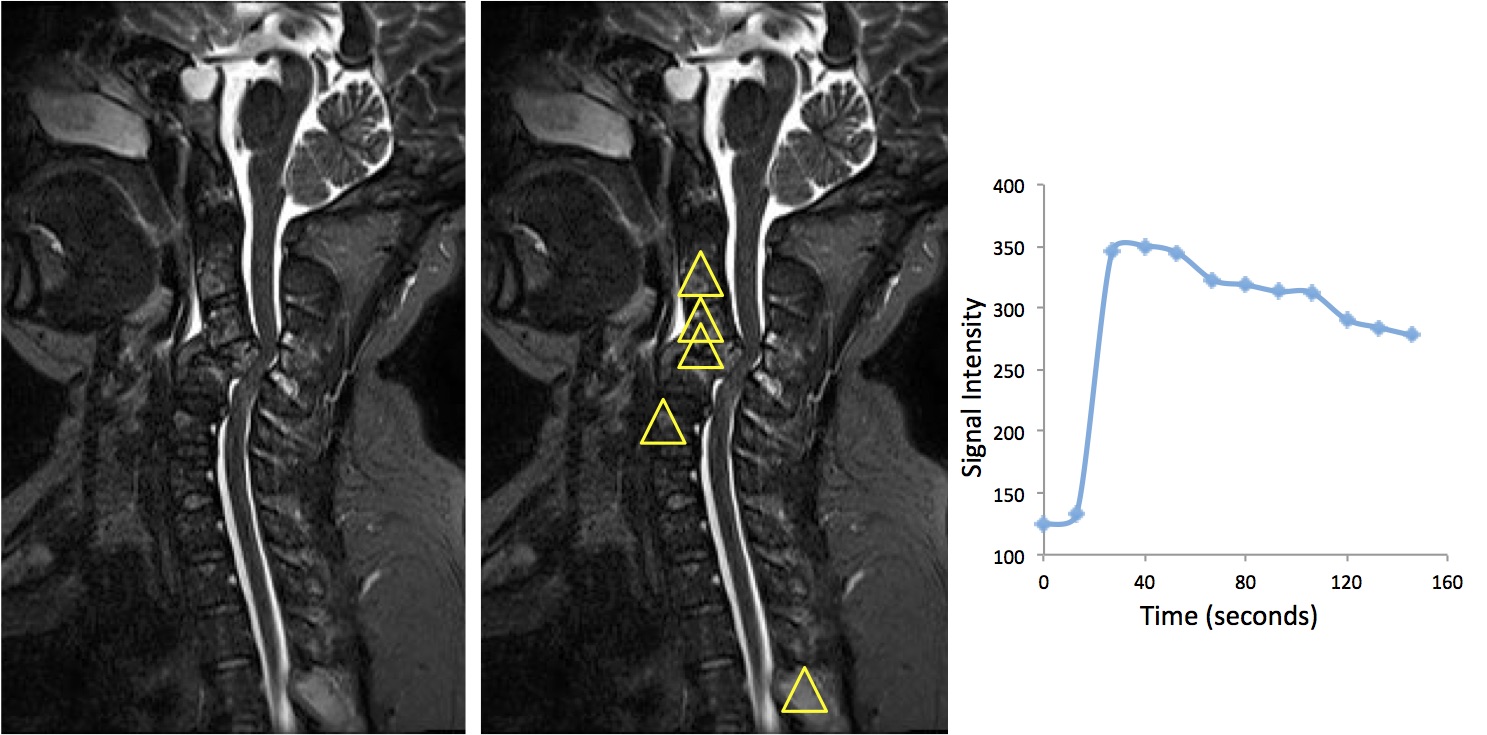
2 shows a female 45-years-old patient with
multiple myeloma involving several different spinal segments. DCE-MRI
enhancement kinetics clearly shows the wash-out pattern.
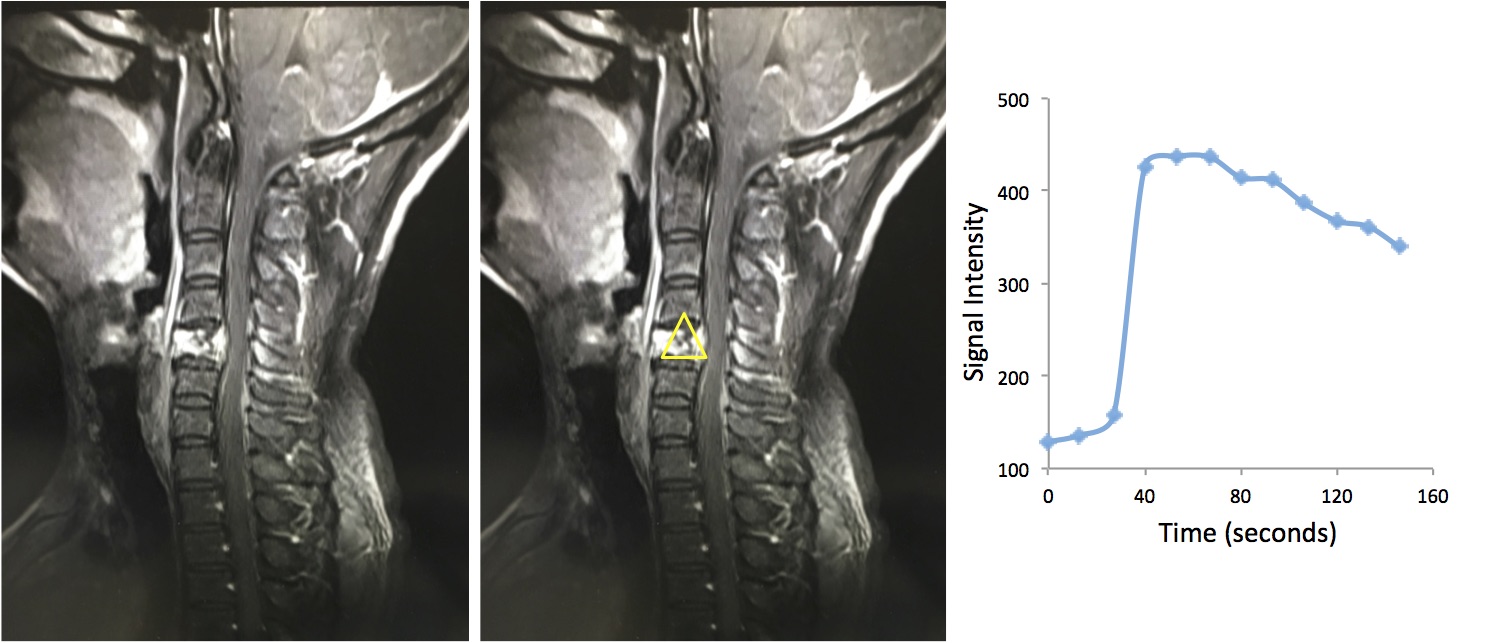
Figure
3 shows a male 41-years-old patient with myeloma
that is only seen in one vertebral segment. DCE-MRI enhancement kinetics
clearly shows the wash-out pattern.
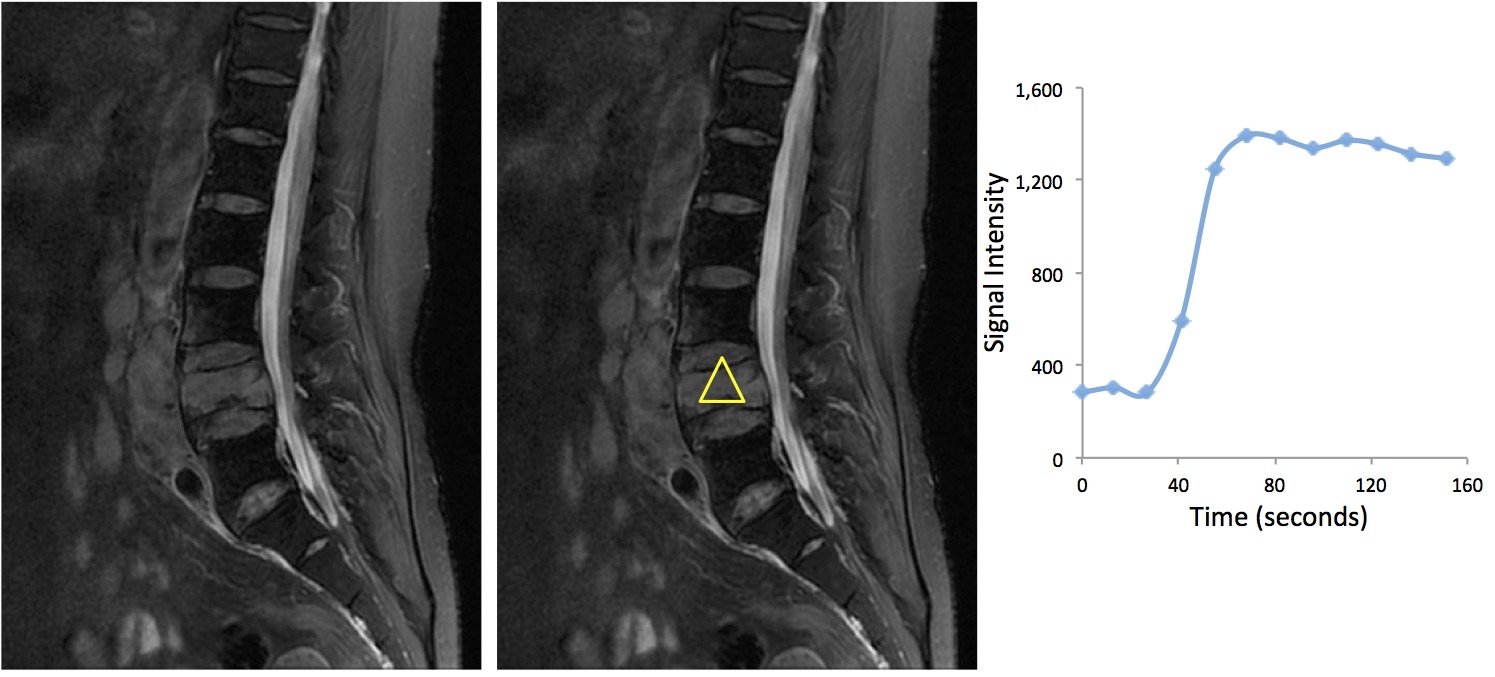
Figure 4 shows a female
72-years-old patient with lymphoma involving one vertebral segment. DCE-MRI
enhancement kinetics shows the plateau pattern.
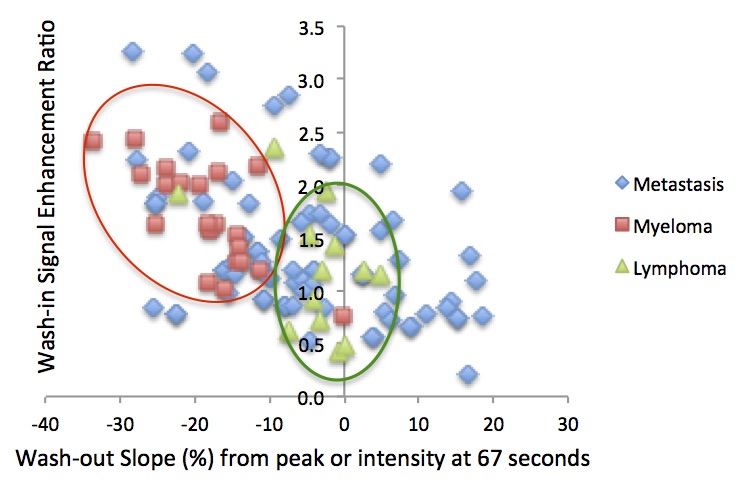
Figure 5 shows the scatter plot of
the wash-out slope for three groups of lesions: myeloma, metastatic cancers,
and lymphoma. It can be seen that the washout slope of the myeloma is clustered
with a high negative value (fast wash-out rates).