5140
Q-space imaging is a novel technique to evaluate intervertebral disc degeneration.1Department of Orthopaedic Surgery, Keio University School of Medicine, Tokyo, Japan, 2Department of Physiology, Keio University School of Medicine, Tokyo, Japan, 3Central Institute for Experimental Animals, Kawasaki, Japan, 4Department of Orthopaedic Surgery, Murayama Medical Center, Japan, 5Department of Radiology, Keio University School of Medicine, Tokyo, Japan
Synopsis
Pfirrmann classification on T2WI has been the qualitative grading of intervertebral disc (IVD) degeneration which is difficult to classify subtle changes of degeneration. A quantitative and more sensitive classification system has been sought.
In this research, probability at zero displacement obtained from Q-space imaging (QSI) which is a quantitative diffusion-weighted MRI procedure made it possible to observe the effect of the regenerative antioxidant drug: N-Acetyl Cystaine on IVD degeneration which could not be observed by using T2 mapping.
Probability at zero displacement obtained from QSI has the possibility to be a novel biomarker of IVD degeneration.
INTRODUCTION
The grading of intervertebral disc (IVD) degeneration has historically been evaluated with the Pfirrmann classification on T2-weighted magnetic resonance imaging (MRI)1. However, it is still difficult to classify subtle changes of degeneration using this method, which is qualitative and based on morphological changes over the progression of degeneration. For this reason, a quantitative and more sensitive classification system has been sought. Q-space imaging (QSI) is a quantitative diffusion-weighted MRI procedure that makes it possible to detect delicate changes in the microstructure of environments in which free water movement is restricted2. We have previously verified the efficacy of antioxidant N-acetylcysteine (NAC) on rat IVD degeneration using a semi-quantitative molecular techinque3. The purpose of this study was to explore the possibility of using QSI to detect delicate changes in rat IVD degeneration using this model.METHODS
A rat degenerative model was generated in which the IVD was punctured using a 23-gauge needle on the third through tenth coccygeal vertebral levels. NAC (1000mg/mL) was given orally to degenerative model rats 1 week before puncture. We designated rats without IVD puncture as the control group, punctured rats without oral administration of NAC as the puncture group, and rats punctured with NAC as the NAC group (n=5 in each group). All rats were transcardially perfused with 4% paraformaldehyde. MRI was performed using a 7-Tesla Biospec 70/16 MRI (Bruker BioSpin :Ettlingen,Germany). For the QSI pulse sequence, we used the diffusion-weighted stimulated-echo method pulse sequence. The imaging parameters used in the present study were as follows: repetition time (TR)/echo time (TE), 3500/33.7ms; Δ/δ, 16.0/10.0 ms; input b-value, 0 - 8000 s/mm2; field of view (FOV), 54 × 54 mm2; matrix size, 360 × 360; slice thickness, 1 mm; motion probing gradient (MPG) moment, Three axes (x, y and z). To determine the anatomical locations of the skeletal muscles, T2WI - Fast spin echo was used. IVD areas were measured by in-house analyzing software (Fig. 1). IVD degeneration grading was evaluated by T2 mapping values [ms] and QSI parameters including probability at zero displacement (arbitrary unit [a.u.]), kurtosis (a.u.), and full width at half maximum (FWHM) [µm]. This study was approved by the local Animal Experiment Committee of Keio University and was conducted in accordance with the Guidelines for Conducting Animal Experiments of Keio University.RESULTS
There were significant differences in T2 mapping values and all QSI parameters between the control and puncture groups (p<0.001). However, T2 mapping values were not significantly different between the puncture and NAC groups. On the other hand, all QSI parameters in the NAC group were significantly decreased compared to the puncture group (p<0.001). Interestingly, probability at zero displacement measurements for the control and NAC groups showed little variance compared to the other parameters (Fig. 2).DISCUSSION
An established method for evaluation of the grading of IVD degeneration is necessary, along with the progression of basic research for IVD degeneration. In this study using QSI, we succeeded in evaluating IVD degeneration grading, which was otherwise not distinguished by T2 values. Kurtosis and FWHM have been widely used independently as QSI parameters for the evaluation of demyelination4 and historical characters of malignant tumors5. Meanwhile, probability at zero displacement has been used in combination with other parameters. However, in this study, probability for zero displacement was a useful parameter that worked well alone. Our findings lend strong support to the hypothesis that probability at zero displacement obtained from QSI is a novel method for evaluating IVD degeneration.CONCLUSION
Probability at zero displacement obtained from QSI is a novel biomarker of IVD degeneration.Acknowledgements
Authors state that there is no financial relationship to disclose.References
1 Pfirrmann, C. W., Metzdorf, A., Zanetti, M., Hodler, J. & Boos, N. Magnetic resonance classification of lumbar intervertebral disc degeneration. Spine (Phila Pa 1976) 26, 1873-1878 (2001).
2 Callaghan, P. T., Coy, A., MacGowan, D., Packer, K. J. & Zelaya, F. O. Diffraction-like effects in NMR diffusion studies of fluids in porous solids. Nature 351, 467-469 (1991).
3 Suzuki, S. et al. Excessive reactive oxygen species are therapeutic targets for intervertebral disc degeneration. Arthritis Res. Ther. 17, 316, doi:10.1186/s13075-015-0834-8 (2015).
4 Fujiyoshi, K. et al. Application of q-Space Diffusion MRI for the Visualization of White Matter. J. Neurosci. 36, 2796-2808, doi:10.1523/jneurosci.1770-15.2016 (2016).
5 Yamada, I. et al. Diffusion-tensor MRI and tractography of the esophageal wall ex vivo. J. Magn. Reson. Imaging 40, 567-576, doi:10.1002/jmri.24411 (2014).
Figures
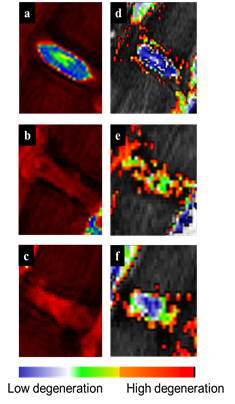
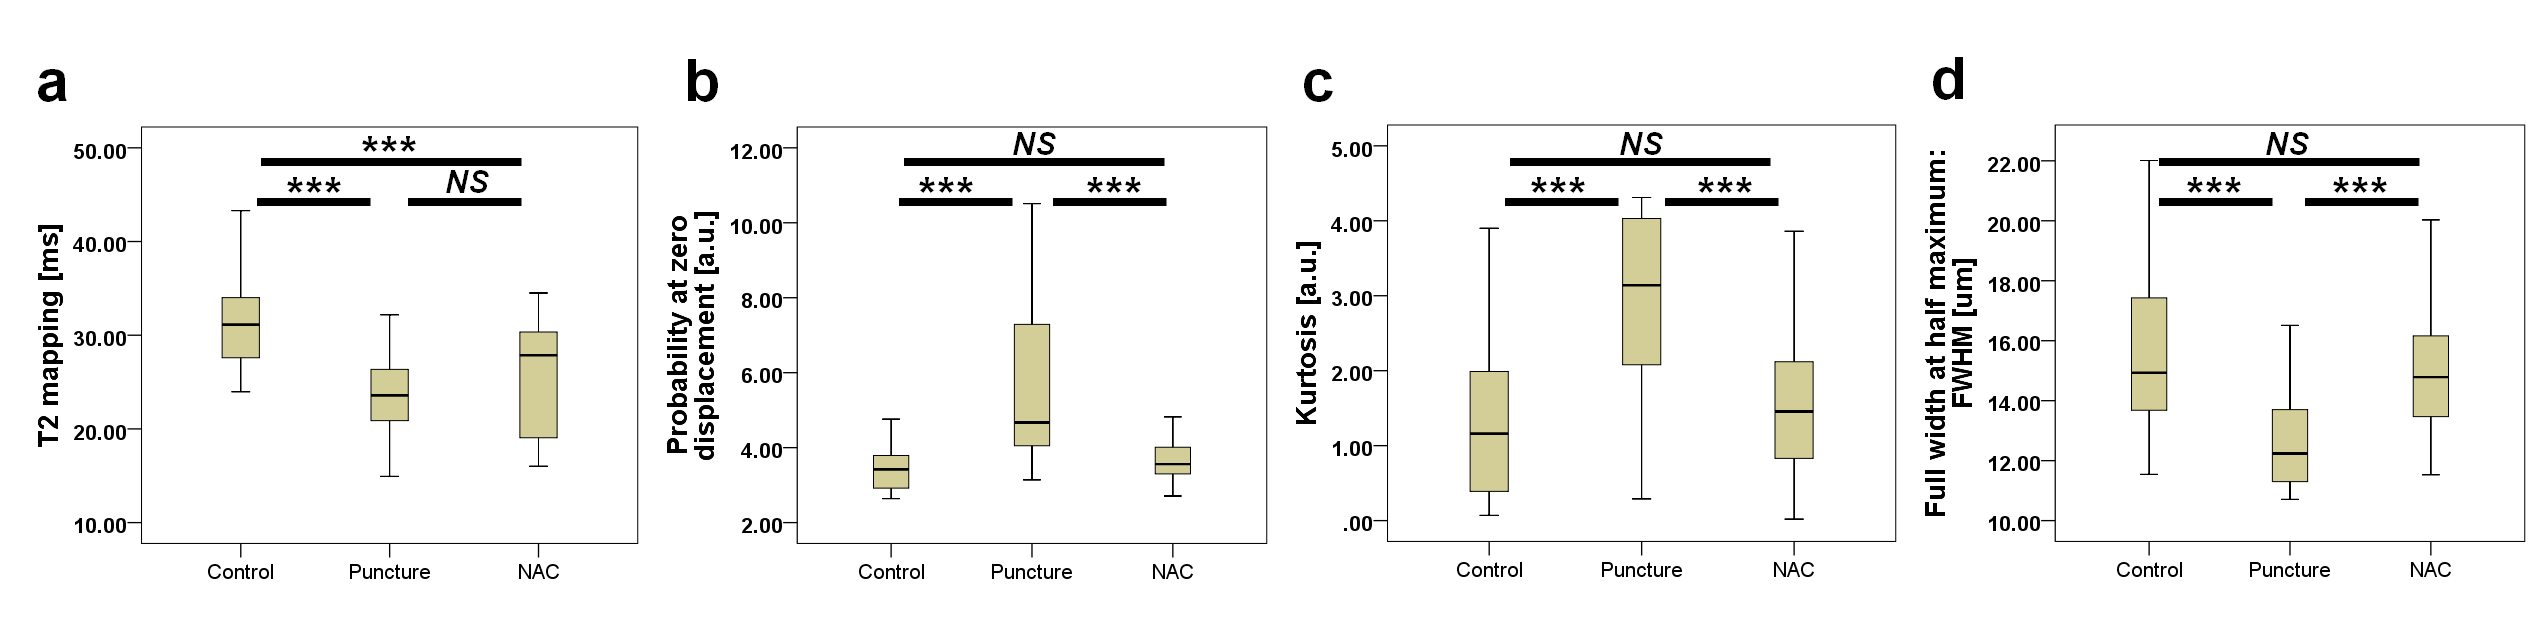
Figure 2 Box-and-whisker plots: the bottom and top of the box are the first and third quartiles; the band inside the box is the second quartile (the median). The ends of the whiskers represent the minimum and maximum of all of the data.
The Wilcoxon signed-rank test was used to evaluate the relationships among the control, puncture, and NAC groups for each imaging parameter: T2 mapping (a), probability at zero displacement (b), kurtosis (c), and full width at half maximum: FWHM (d), respectively. NS, not significant; ***p<0.001