5139
Preliminary investigation: Gaussian and non-Gaussian measurements of water diffusion in diagnostic differentiation of focal lesions of malignant spinal bone tumors1Diagnostic Radiology, Hiroshima University Hospital, Hiroshima, Japan, 2Diagnostic Radiology, Keio University School of Medicine, Japan
Synopsis
We compared the potential of various diffusion parameters obtained from Gaussian and non-Gaussian diffusion models in differentiating focal lesions of malignant spinal tumors. Mean signal intensity was calculated by placing ROIs within focal lesions for 9 b-values in each subject. ADC, frac<1, frac>3, and PG(D) differed significantly between focal lesions of myeloma and LCA. Frac>3 and PG(D) was significantly different between focal lesions of myeloma and MMK. Non-Gaussian diffusion parameters may provide additional information and improve the differentiation of malignant focal lesions compared with conventional diffusion parameters, which would be helpful in improving therapy strategies.
Purpose
The apparent diffusion coefficient (ADC) of metastatic bone tumors does not differ significantly according to the type of primary malignancy1. However, no studies have compared the capability of diffusion-weighted (DW) imaging to distinguish focal lesions of multiple myeloma from metastatic bone tumors. The purpose of this study was to compare the potential of various diffusion parameters obtained from Gaussian and non-Gaussian diffusion models in differentiating focal lesions of malignant spinal tumors.Materials and Methods
Theoretical Background
ADC values were calculated using the following monoexponential model:
S(b)/S(0) = exp(-b·ADC)
where S(b) represents the signal intensity in the presence of diffusion sensitization, b, and S(0) represents the signal intensity in the absence of diffusion sensitization.
The three parameters of perfusion fraction (f), pseudo-ADC (ADCfast), and true ADC (ADCslow) were calculated using biexponential intravoxel incoherent motion analysis:
S(b)/S(0)= [f·exp (-b·ADCfast)] +[(1 - f )·exp(-b·ADCslow)]
The gamma distribution model (GDM) assumes a continuous distribution of diffusion coefficients, P (D). The DW signal can be written as follows:
$$S(b)=\int_{}^{} P(D)exp(-bD)dD$$ (1)
The gamma distribution function, PG (D) has been suggested recently as2:
$$P_{G}(D,\kappa,\theta)=D^{\kappa-1}\frac{exp(-D/\theta)}{Γ(\kappa)\theta^{\kappa}}$$ (2)
where Γ is the gamma function, θ is the scale parameter of the same dimensionality as diffusivity, and κ is the shape parameter. Replacing P(D) in Eq. (1) with PG (D) from Eq. (2), gives the following expression for DW signal attenuation:
$$S(b)=(1+b\theta)^{-\kappa}$$ (3)
MRI examination
DW images of the lumbar spines of 63 subjects were categorized as follows: patients with focal lesion of multiple myeloma (MM, n=23); patients with metastatic bone tumor from breast cancer (MMK, n=21); and patients with metastatic bone tumor from lung cancer (LCA, n=19).
MRI was performed on a 3-T system (Ingenia; Philips Healthcare) equipped with an anterior coil and integrated posterior coil. Single-shot DW EPI with 9 values (0, 40, 80, 140, 200, 500, 1000, 1500, 2000) on 3 orthogonal axes was performed with the following acquisition parameters: TR/TE =8000/84 ms; FOV= 35×35 cm2; matrix size, 192×192; in-plane voxel size, 1.8×1.8 mm2; slice thickness, 4 mm; number of slices, 11; slice gap, 1 mm; factor of 3 SENSE in the phase direction, and 1 average.
Image data analysis
Mean signal intensity was calculated by placing operator-determined regions of interest within the largest focal lesions for each b-value in each subject. For each subject, ADC, f, ADCfast, ADCslow, scale parameter θ, scale parameter κ, area fraction of D < 1.0mm2/s (frac<1), area fraction of D > 3.0 mm2/s (frac>3), and PG (D) were measured using Equations 1-3.
Statistical analysis
Parameters of the 3 groups were compared using the Kruskal-Wallis test. Multiple regression analysis was performed to identify potential associations of diffusion model parameters for differentiating focal lesions. Receiver operating characteristic analyses were then performed.
Results
Table 1 summarizes MR parameters for the 3 groups. ADC, frac<1, frac>3, and PG (D) differed significantly between focal lesions of myeloma and LCA. Frac>3 and PG (D) were significantly different between focal lesions of myeloma and MMK. Three parameters from biexponential models were not significantly different among the three groups. No parameters differentiated between focal lesions of LCA and MMK.
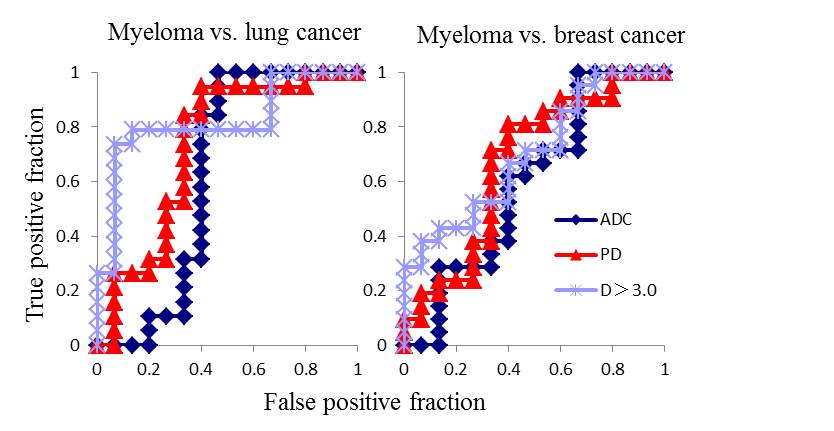
Multiple regression analysis demonstrated that frac>3 (P=0.03) differentiated focal lesions of MM from MMK. Areas under the curve (AUCs) were 0.821 for frac>3, 0.726 for PG (D), and 0.625 for ADC for differentiation between focal lesions of MM from LCA and 0.698 for frac>3, 0.670 for PG (D), and 0.597 for ADC for differentiation between focal lesions of MM from MMK (Fig. 1).
Discussion
In this study, parameters calculated from GDM were shown to be useful for differentiating focal lesions of MM from LCA and MMK. We consider that higher frac>3 in focal lesions of MM than in LCA and MMK was caused by higher architectural complexity due to necrosis, stromal invasion, or glandular formation in LCA and MMK compared with MM, in which monoclonal plasma cells proliferate more uniformly. Differentiating focal lesions of MMK from MM is sometimes challenging because breast cancer cell dormancy can result in a long latency of metastasis development3, resulting in similar clinical courses and findings on conventional imaging studies with MM. GDM might be useful to distinguish MM lesions from recurrence of breast cancer in this clinical setting.Conclusion
Non-Gaussian diffusion parameters may provide additional information and improve the differentiation of malignant focal lesions compared with conventional diffusion parameters, which would be helpful in improving therapy strategies. This also refers to differentiation of focal lesions of myeloma from breast cancer, in which both frac>3 and PG(D) calculated from GDM proved to be useful.Acknowledgements
No acknowledgement found.References
1. Cha MJ, Yoon YC. Clinical relevance of the apparent diffusion coefficient value of metastatic bone tumours on diffusion-weighted MRI images: differences according to the types of primary tumour, the affected bones, and clinical factors. Clin Radiol. 2015 ;70(10):1116-1121.
2. Oshio K, Shinmoto H, Mulkern RV. Interpretation of diffusion MR imaging data using a gamma distribution model. Magn Reson Med Sci. 2014;13:191-195.
3. Marlow R, Honeth G, Lombardi S, et al. A Novel Model of Dormancy for Bone Metastatic Breast Cancer Cells. Cancer Res. 2013;73(23); 6886–6899.
Figures
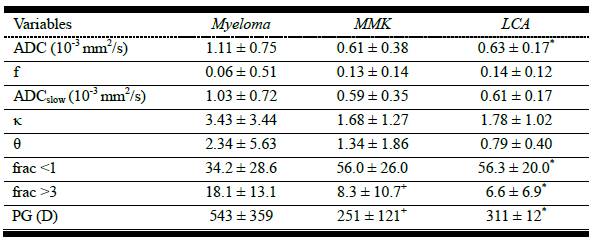
Table 1 MR parameters for the 3 groups.
Note. Values represent means ± standard deviation. *P < 0.05, MM vs. LCA. +P < 0.05, MM vs. MMK.