5137
Vertebral strength prediction in diabetic patients: quantification of bone marrow fat content obtained by IDEAL-IQ1Radiology, University of Occupational and Environmental Health, Kitakyushu, Japan, 2First department of Internal Medicine, University of Occupational and Environmental Health, Kitakyushu, Japan
Synopsis
Although bone mineral density (BMD) by dual X-ray absorptiometry (DXA) has been used to predict bone strength, diabetes mellitus (DM) patients have an elevated fracture risk despite normal BMD. We evaluated the availability of the fat fraction (FF) using IDEAL-IQ for vertebral strength prediction in DM patients. The correlation between the failure load by CT-based finite-element method and the BMD with age and the FF using IDEAL-IQ was significantly higher than that between the failure load and the BMD alone (p<.001). FF using IDEAL-IQ in combination with BMD measurements can potentially be used in predicting bone strength in DM patients.
PURPOSE:
Bone marrow is a dynamic organ which is composed of fat, water, and protein, and the proportion is thought to be related to the remodeling capacity of the bone.1 Although bone mineral density (BMD) by dual X-ray absorptiometry (DXA) has been used to predict bone strength, diabetes mellitus (DM) patients have an elevated fracture risk despite normal BMD.2 The purpose of this study is to determine the value of the quantitative chemical shift-based water-fat separation method with a multiecho gradient echo sequence (known as IDEAL-IQ) of MRI to BMD in vertebral bone strength prediction of DM patients.METHODS:
Patients
Sixty-six consecutive DM patients were included in this study. They underwent DXA, IDEAL-IQ, and CT covering the vertebral body of L1 to L4 within a week.
MRI
All MRI scans were performed using a 3.0T MR scanner (Discovery MR750W, GE Healthcare) with GEM spine coil. For IDEAL-IQ, the following pulse sequences were used: 6 echoes/TR, TR: 5.8 ms, TE min: 0.8 ms, TE spacing: 0.66 ms, slice thickness: 8 mm, FOV: 44×44 cm, matrix size: 128×128, scan time: 16 seconds.
Images Analysis
Quantitative fat fraction (FF) using IDEAL-IQ of 4 lumbar vertebrae was analyzed (Fig. 1, left). Maximum circular ROI was drawn on the lumbar vertebral bodies for measurements of FF. Failure load of the vertebra, determined by the CT-based finite-element method (FEM), was used as the gold standard for bone strength (Fig. 1, right).
Statistical Analysis
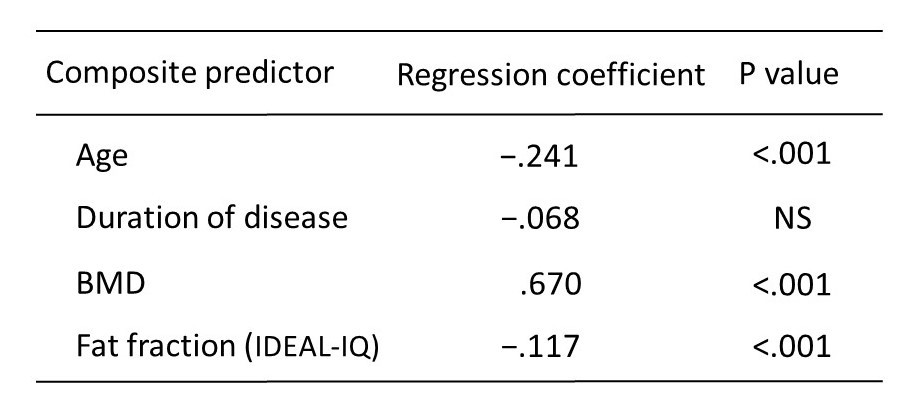
A forward stepwise multiple regression analysis for evaluating was used to identify variables that predicted bone strength. Independent variables considered in the analysis were age, disease duration, BMD, and FF using IDEAL-IQ.
RESULTS:
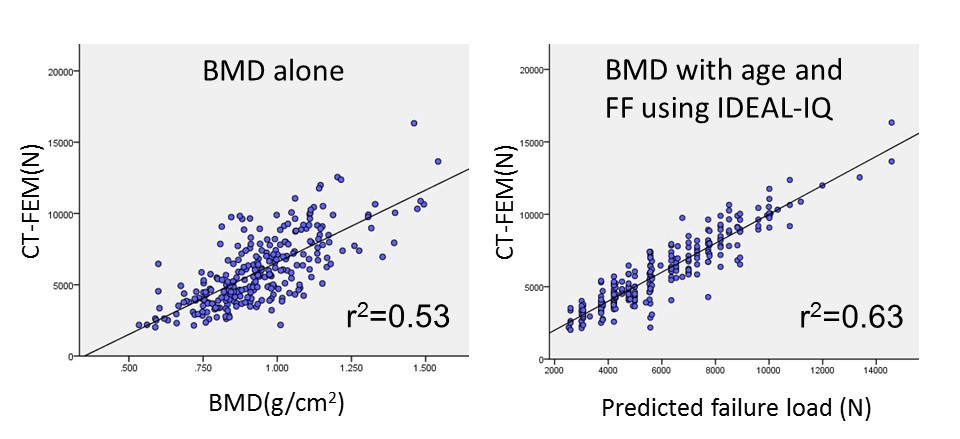
The combination of age, BMD, and the FF using IDEAL-IQ showed the highest correlation to the failure load by CT-FEM (Fig. 2). The correlation between the failure load and the BMD with age and the FF using IDEAL-IQ (r2=0.63) was significantly higher than that between the failure load and the BMD alone (r2=0.53; p<.001) (Fig. 3).DISCUSSION:
Diabetes mellitus is associated with higher bone marrow fat in mice,3 though the association is not clarified in human. Patsch et al reported that bone marrow fat composition by MR spectroscopy is linked with fragility fractures in postmenopausal women and may serve as a novel tool for BMD independent fracture risk assessment.4 With regard to the correlation of the failure load by CT-FEM, our results demonstrated that the combination of age, BMD, and the FF using IDEAL-IQ increased by 10% in comparison with BMD alone. FF using IDEAL-IQ can provide additional information to BMD in bone strength prediction of vertebral body strength in DM patients.
In vivo IDEAL-IQ is simple to perform in a short time (16 seconds). Although MR spectroscopy is thought to be the most accurate method in quantifying fat-water content, an improvement in scan time and resolution is offered as practical quantitative imaging.5, 6 The use of IDEAL-IQ as a fat quantification technique has been increasingly discussed in the literature,7 and Meisamy et al. recently reported IDEAL-IQ can accurately quantify fat by using MR spectroscopy as the reference standard in the liver.8 Clinically, IDEAL-IQ may represent an interesting alternative for the evaluation of bone marrow fat fraction.
CONCLUSION:
Fat fraction using IDEAL-IQ in combination with BMD measurements can potentially be used in predicting bone strength in DM patients.Acknowledgements
No acknowledgement found.References
[1] Vogler JB 3rd, Murphy WA. Bone marrow imaging. Radiology 1988;168(3):679–93.
[2] Schwartz AV, Vittinghoff E, Bauer DC, et al. Association of BMD and FRAX score with risk of fracture in older adults with type 2 diabetes. JAMA. 2011;305(21):2184–92.
[3] Botolin S, McCabe LR. Bone loss and increased bone adiposity in spontaneous and pharmacologically induced diabetic mice. Endocrinology. 2007;148(1):198–205.
[4] Patsch JM, Li X, Baum T, et al. Bone marrow fat composition as a novel imaging biomarker in postmenopausal women with prevalent fragility fractures. J Bone Miner Res 2012;28(8):1721–8.
[5] Bernard CP, Liney GP, Manton DJ, et al. Comparison of fat quantification methods: a phantom study at 3.0T. J Magn Reson Imaging 2008;27(1):192–7.
[6] Kim H, Taksali SE, Dufour S, et al. Comparative MR study of hepatic fat quantification using single-voxel proton spectroscopy, two-point dixon and three-point IDEAL. Magn Reson Med. 2008 59(3):521–7.
[7] Yu H, McKenzie CA, Shimakawa A, et al. Multiecho reconstruction for simultaneous water-fat decomposition and T2* estimation. J Magn Reson Imaging. 2007; 26(4):1153–61.
[8] Meisamy S, Hines CD, Hamilton G, et al. Quantification of hepatic steatosis with T1-independent, T2-corrected MR imaging with spectral modeling of fat: blinded comparison with MR spectroscopy. Radiology 2011;258(3):767-75.
Figures
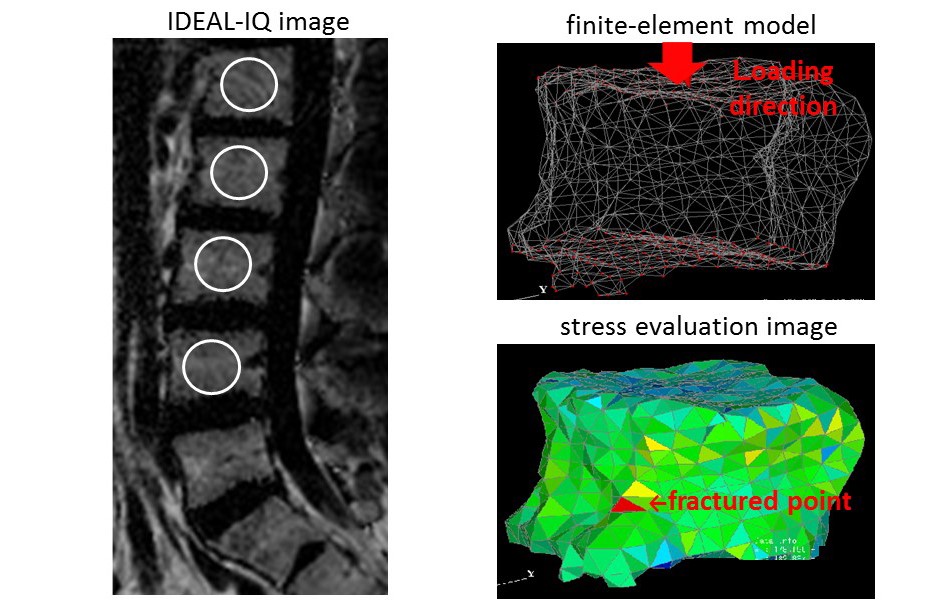
Fig. 1 IDEAL-IQ image indicating the measurement of fat fraction (left). A representative CT-FEM model of a 64-year-old DM patient (right).