5135
Changes in tracer kinetics in the endplates of degenerating intervertebral discs1Department of Neurosurgery, Medical College of Wisconsin, Milwaukee, WI, United States, 2Department of Radiology, Medical College of Wisconsin, Milwaukee, WI, United States, 3Department of Biophysics, Medical College of Wisconsin, Milwaukee, WI, United States
Synopsis
This study investigated changes in perfusion and diffusion in the cartilaginous endplates and subchondral bones around the degenerating discs. It has been suggested that such abnormalities might indicate inflammatory changes that might lead to chronic low back pain. A high spatial and temporal resolution DCE-MRI technique was implemented and tested on a group of volunteers. Pharmacokinetic model was used to quantify the changes in the regions of interest. Results demonstrated significant changes in contrast agent uptake and washout in the cartilaginous and bony endplate regions as the adjacent disc degenerated.
Purpose
Vertebral endplates adjacent to degenerating discs might also undergo some degenerative changes. Several groups reported angiogenesis, neurogenesis and inflammatory mediators in those endplate regions, possibly sensitizing the area to stimulation and pain4, 6. Our group is studying such endplate changes in vivo using Dynamic Contrast Enhanced MRI (DCE-MRI). Earlier studies using this technique demonstrated significant changes in the endplates of degenerating discs1, 8. However, they used low temporal resolution, which made it challenging to accurately quantify such changes using pharmacokinetic models. With higher temporal resolutions, a tracer kinetics model10 could be employed to better understand pathological changes in endplates. This could eventually help investigate associations between endplate changes and low back pain. To achieve this goal, we used a high spatial and temporal resolution DCE-MRI technique introduced recently7. This is based on a radial imaging technique called Linogram2, 5.Methods
The study was approved by the IRB and written consents were obtained from participants. The subjects were interviewed and their medical charts were reviewed to rule out other clinical conditions, such as malignancies or bone disease. Lumbar spines of 11 adult participants (mean age:41, std:12.5) were scanned using a 3T GE MR750 system. 3D-Linogram acquisition was implemented using stack-of-stars sampling technique and with a golden angle-like spoke organization3 and compressed sensing reconstruction. The acquisition parameters were: FOV=25.6cm, 6mm thick 12 slices, TR/TE=7.6ms/2.2ms, 128 radial spokes reconstructed to 256×256 images. Fat saturation was also used. 68 volumes with a frame rate of 9.8s was acquired. Contrast agent gadobenate dimeglumine was administered as a bolus (0.1 mmol/kg) after the 10th dynamic frame. A set of inversion recovery images were acquired before DCE-MRI for T1 mapping (for estimating contrast agent concentration). T2 weighted images were reviewed by a radiologist for Pfirrmann classification9 of disc degeneration. A trained operator drew regions of interest (ROI) on pre-contrast images to segment out the 10 cartilaginous endplates (EP) and adjacent subchondral bones (SB) in the lumbar area. Tofts’ pharmacokinetic model10 parameters were estimated from the average enhancement signal in each ROI. A group-averaged arterial input function derived from the descending aorta was used for the model. For statistical analysis, the lumbar discs of the subjects were sorted into three pools according to the level of degeneration. Low: Grades I and II (27 discs); Medium: Grade III (17 discs) and High: Grades IV and V (11 discs). Group differences were tested using one-way ANOVA.Results
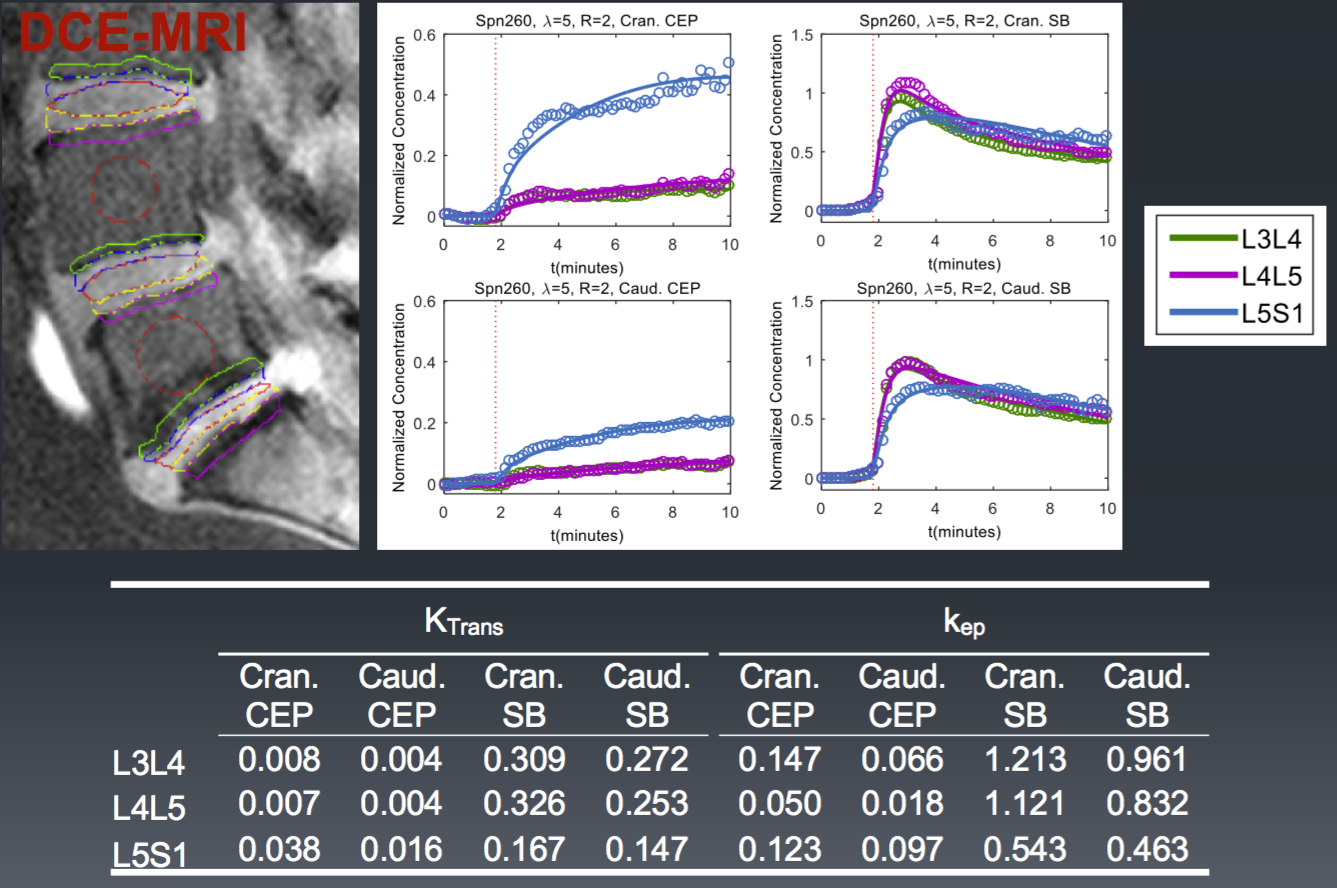
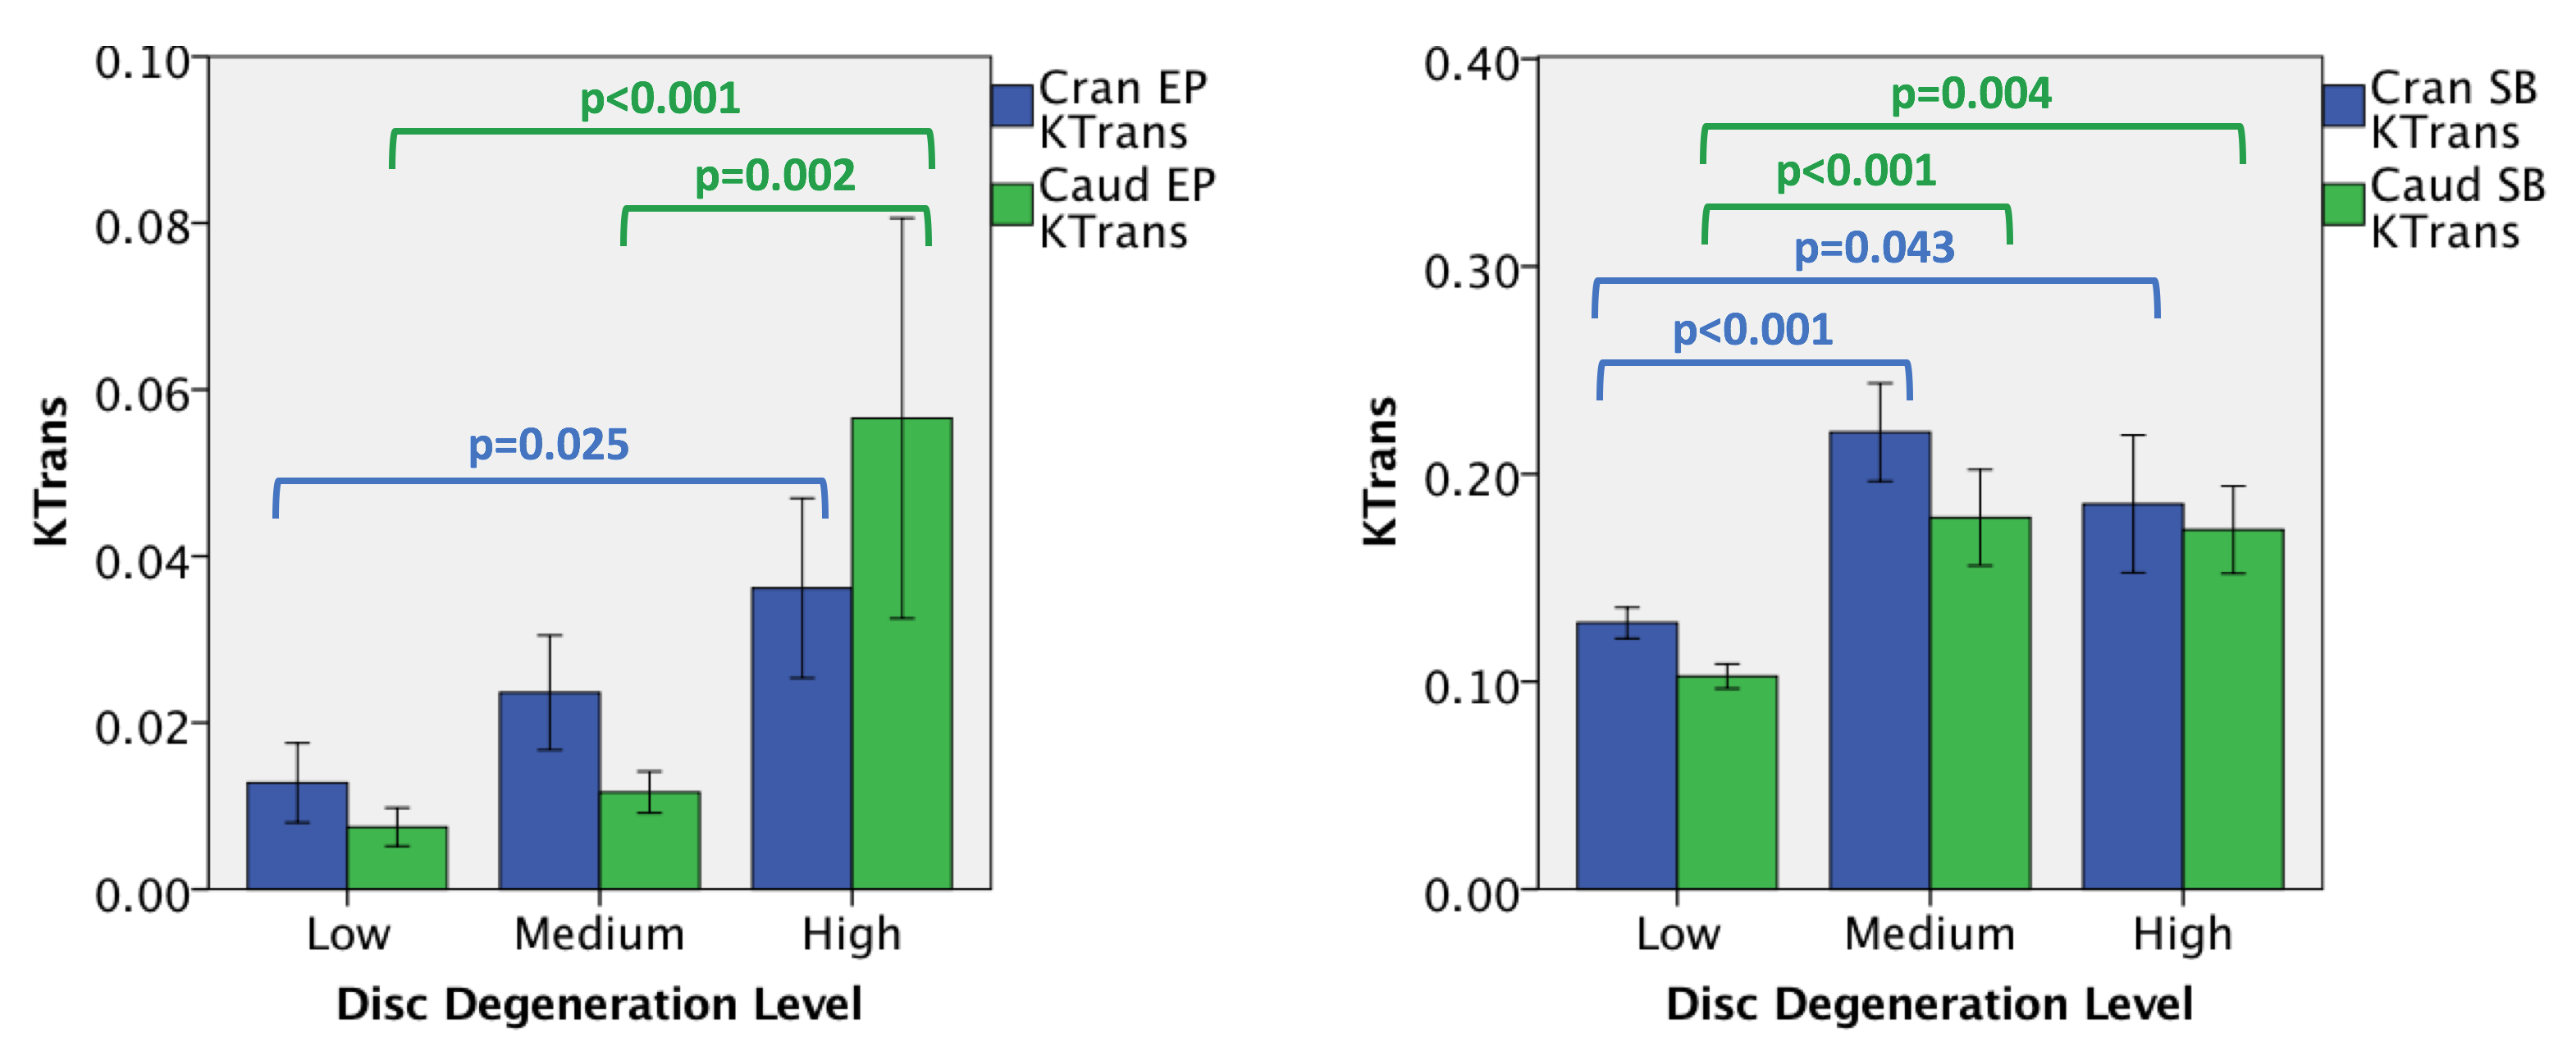
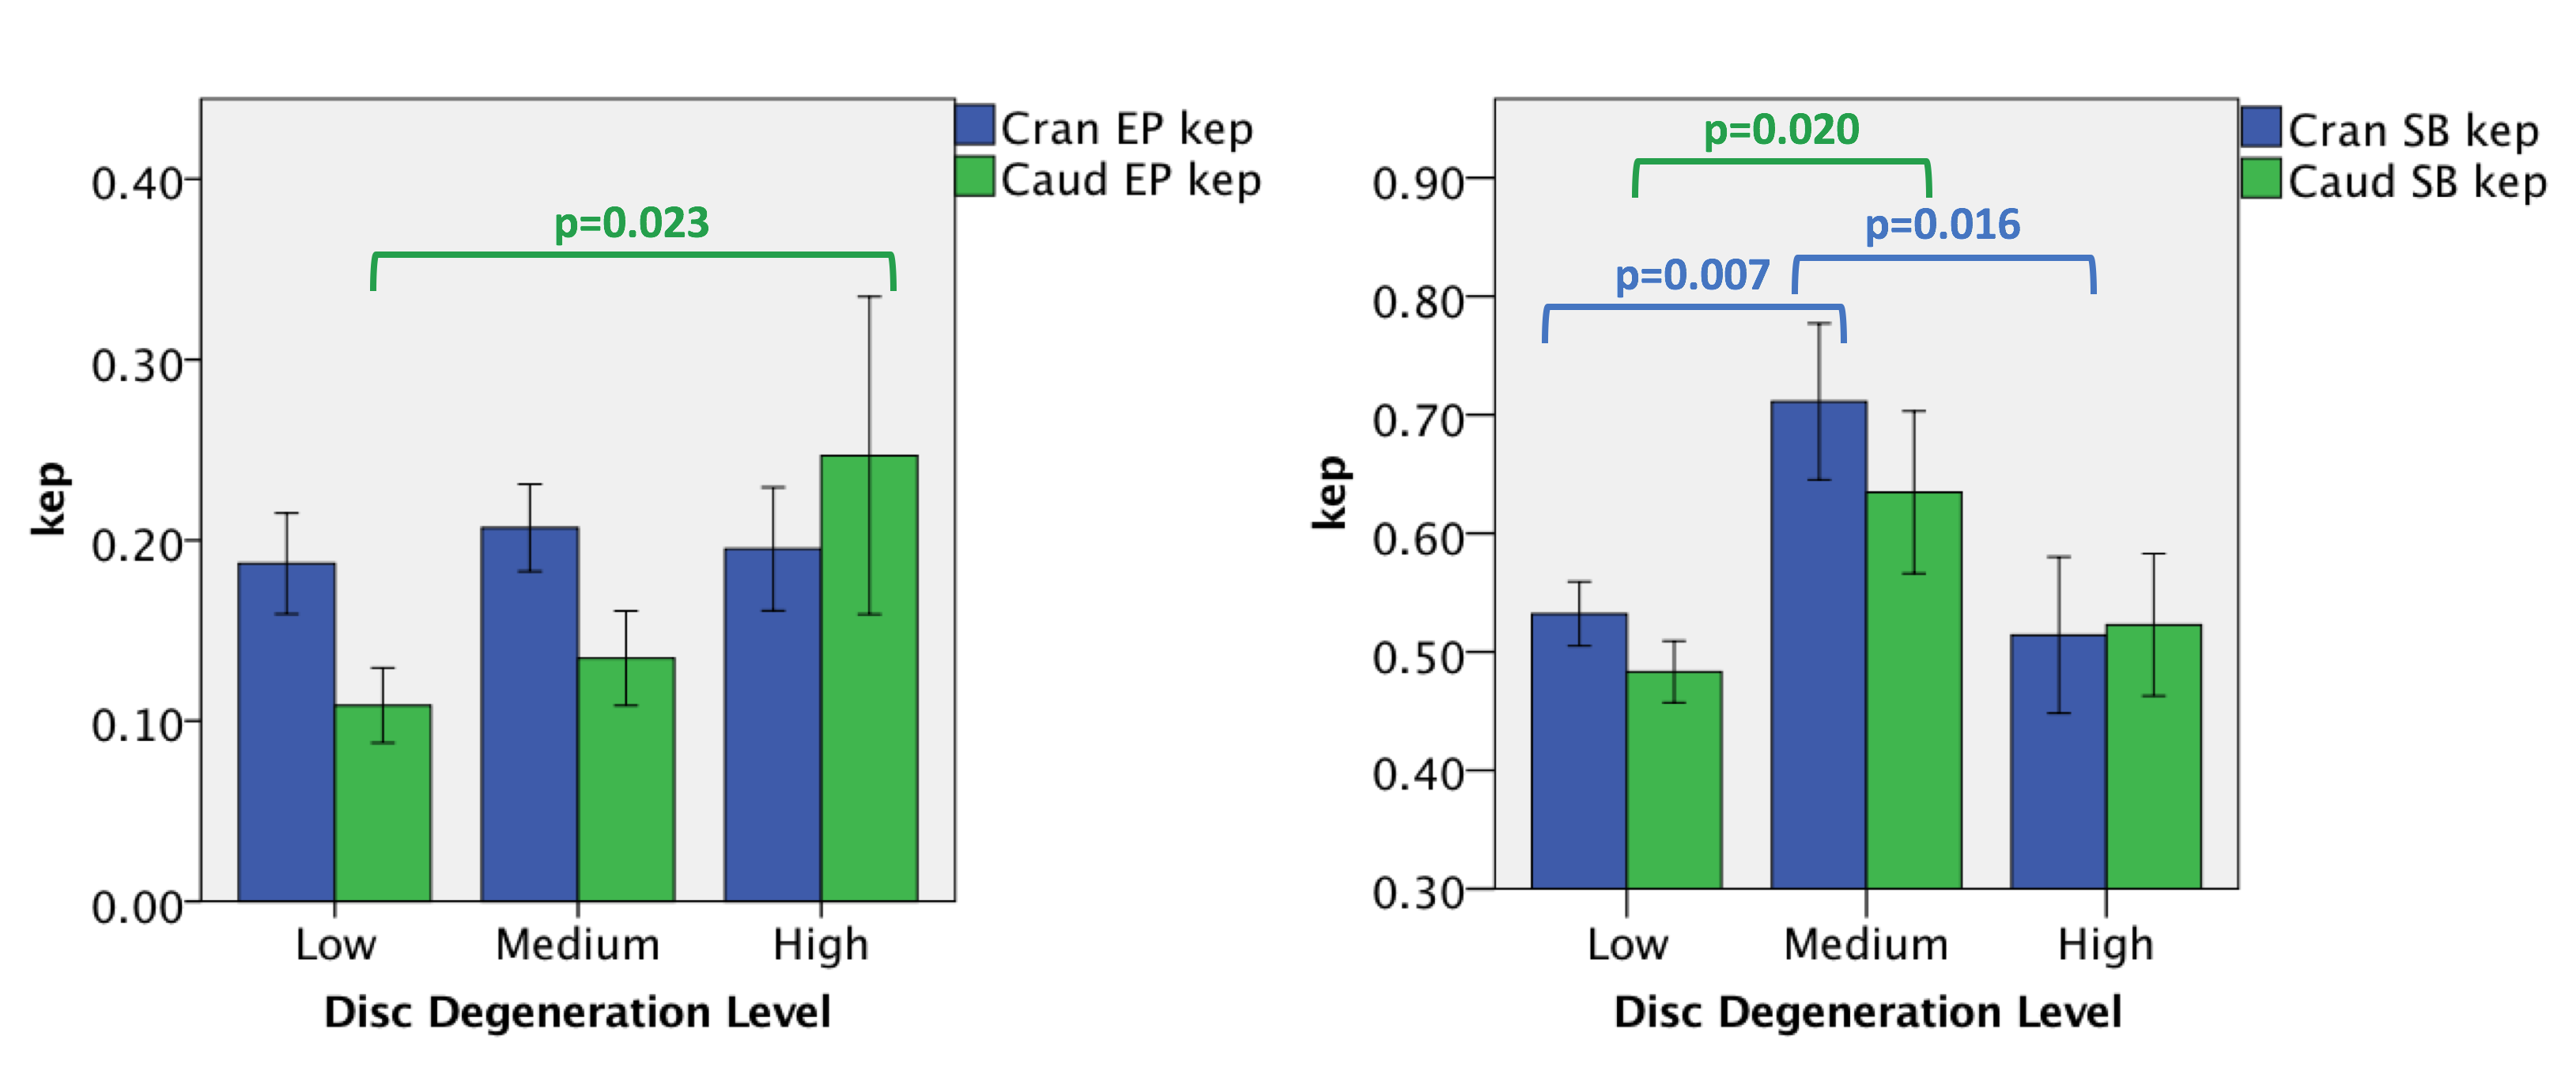
Fig.1 shows image from one subject with ROIs outlined. Enhancement plots and a list of Ktrans (wash-in) and kep (washout) values for each ROI were also shown. Figures 2 and 3 illustrate differences in Ktrans and kep in the SBs and EPs. The bar plots show the means and standard errors for Ktrans and kep across the three disc degeneration levels. ANOVA’s Post Hoc test results are shown on the graphs. There is a clear increasing trend in Ktrans in the EP regions. On the other hand, Ktrans increased significantly in the Medium and High disc degeneration groups compared to the health discs (group Low). Another interesting trend was observed in kep in the SBs. There was an increased washout in the Medium degeneration group, but it returned to normal levels in highly degenerated discs. However, kep in the EPs monotonically increased only in the caudal side.Discussion
We demonstrated significant differences in both contrast uptake and washout in the SB and EP regions of the lumbar spine. Increase in contrast agent accumulation in the EP regions might be a result of increased vascularity and microfractures in the subchondral bone regions, allowing more contrast agent to diffuse into the EPs in a short time. On the other hand, results from the SB region show that major changes took place when the discs were in intermediate stage of degeneration and somewhat stabilized afterwards. It is possible that the aberrations in the SB region had a role in the progression of disc degeneration. Early changes in SB region might have contributed to the disc degeneration, and then did not change much afterwards. Contrast agent washout also showed the biggest increase in the intermediate disc degeneration phase in the SB regions, while the trend continued in the EP region. These findings overall might indicate a leakier EP structure around degenerated discs.
Although the findings here demonstrated clear differences in contrast agent perfusion and diffusion in the EP and SB regions of degenerating discs, the results need to be validated with larger cohorts. Furthermore, potential associations with chronic low back pain and endplate abnormalities need to be investigated.
Acknowledgements
This study is supported in part by funds from Advancing a Healthier Wisconsin AHW28 FP00002161 and AOSpine Clinical Priority program. We would like to thank the study coordinator Judeen Richeen for her help and study participants for their contributionsReferences
1. Arpinar, V.E. et al., Changes in perfusion and diffusion in the endplate regions of degenerating intervertebral discs: a DCE-MRI study., Eur Spine J, 24 (2015) 2458-2467.
2. Axel, L. et al., Linogram reconstruction for magnetic resonance imaging (MRI)., IEEE Trans Med Imaging, 9 (1990) 447-449.
3. Feng, L. et al., Golden-?angle radial sparse parallel MRI: Combination of compressed sensing, parallel imaging, and goldenâ?angle radial sampling for fast and flexible dynamic volumetric MRI, Magnetic resonance in medicine, 72 (2014) 707-717.
4. Fields, A.J., Liebenberg, E.C. and Lotz, J.C., Innervation of pathologies in the lumbar vertebral end plate and intervertebral disc., Spine J, 14 (2014) 513-521.
5. Gai, N. and Axel, L., A dual approach to linogram imaging for MRI., Magn Reson Med, 38 (1997) 337-341.
6. Lotz, J.C., Fields, A.J. and Liebenberg, E.C., The role of the vertebral end plate in low back pain., Global Spine J, 3 (2013) 153-164.
7. Muftuler, L.T., Ersoz, A. and Arpinar, V.E., High spatial and temporal resolution DCE-MRI of intervertebral disc endplates using GRAPPA accelerated 3D-Linogram acquisition, ISMRM 24th scientific meeting, Singapore, (2016) 1063.
8. Muftuler, L.T. et al., Association between intervertebral disc degeneration and endplate perfusion studied by DCE-MRI., Eur Spine J, 24 (2015) 679-685.
9. Pfirrmann, C.W. et al., Magnetic resonance classification of lumbar intervertebral disc degeneration., Spine (Phila Pa 1976), 26 (2001) 1873-1878.
10. Tofts, P.S., Modeling tracer kinetics in dynamic Gd-DTPA MR imaging., J Magn Reson Imaging, 7 (1997) 91-101.
Figures