5132
Measurement and Correction for the Magnetic Susceptibility Effects of Fat in Venous Oximetry: Application in the Quantification of Muscle Oxygen Consumption (VO2) with Plantar Flexion Exercise1Biomedical Engineering, University of Alberta, Edmonton, AB, Canada
Synopsis
The magnetic field shift within cylindrical blood vessels can be used to estimate venous oxygen saturation, based on the magnetic susceptibility of deoxyhemoglobin. However, conduit veins in the periphery are often surrounded by fat, which has a larger magnetic susceptibility than water and the venous blood pool. It is shown that the magnetic susceptibility effects of fat can confound estimation of venous oxygen saturation. A new method to correct for these effects is described with
Purpose
Measure and correct for the unwanted magnetic susceptibility effects of fat in venous oxygen saturation imaging and illustrate the application for lower leg muscle oxygen consumption (VO2) with plantar flexion exercise.Methods
Background: Imaging of venous oxygen saturation enables non-invasive study of oxygen consumption/metabolism. The magnetic susceptibility of blood (χBlood) is linearly related to oxygen saturation (SvO2), χBlood=χdo*Hct*(1-SvO2), where χdo=4π*0.27 ppm for fully deoxygenated blood, Hct=hematocrit. For cylindrical vessels at an angle of θ to B0, χBlood shifts the magnetic field (ΔBO2) in relation to the venous oxygen saturation, SvO2(%)=100*{1-2*ΔBO2/(γ*χdo*Hct*B0*(cos2θ-1/3))}.1, 2 Additional static field inhomogeneities are removed by estimation and subtraction of a background field, ΔBBackground.3 For applications in skeletal muscle oxygen consumption4, 5, the conduit veins of interest (e.g. popliteal/ femoral vein) are commonly surrounded by fat (χFat=0.65 ppm), particularly where smaller veins converge to the larger targeted veins. The potentially complex magnetic field perturbation from the fat (ΔBFat) may extend into the vein and the surrounding muscle reference tissue, potentially confounding estimation of the targeted ΔBO2 (i.e. the measured magnetic field, ΔBMeasured, will be the sum of ΔBO2, ΔBBackground and ΔBFat).
Approach: Part 1 - We propose that Dixon fat-water separated imaging (multi-echo acquisitions)6 can be used to quantify fat/water distributions, which can be used to generate a susceptibility model of the fat (for the estimation of ΔBFat), and to quantify off-resonance frequency (ΔBMeasured) to estimate SvO2. ΔBBackground can be measured using a low spatial frequency fit of the off-resonance field from the reference tissues surrounding the targeted vein.3 Part 2 - We further propose that the measured ΔBFat can be used in subsequent single-slice time-resolved studies of SvO2, in conjunction with isolated muscle exercise.
MRI Acquisition: Imaging studies (3T PRISMA; Siemens Healthcare; Erlangen, Germany) of the popliteal vein (i.e. venous return from lower leg) were performed in 10 healthy individuals. Part 1 - A slice interleaved multi-echo gradient echo sequence provided spatial coverage from the knee to lower thigh (TE=[2.44,4.26,6.08,8.90,9.72,11.54] ms, TR=700ms, flip=30°, 192x102 matrix, 49x4mm slice thickness) (Fig 1). Part 2 - a single slice version of the sequence from Part 1 (TR = 18.9 ms,flip=20°) was used for dynamic studies with exercise (3.75 sec/image, 50 time-points). Flow-encoding gradients were added to the single-slice sequence to enable phase-contrast evaluation of venous blood flow in the same acquisition.4, 5
Exercise: All subjects performed incremental plantar flexion exercise targeting the gastrocnemius (4-9 Watts, increasing 1 Watt/minute) for 3-6 minutes, to a perceived level of 75% of maximum (Ergospect; Austria). Exercise imaging started within 1 second of the completion of exercise (to capture peak and recovery dynamics).
Analysis: The VARPRO method was used to calculate water, fat and off-resonance (ΔBMeasured) maps6 for both multi-slice (3D) and post-exercise time-resolved acquisitions. Volumetric susceptibility maps were calculated using fat-fraction from the VARPRO analysis (Fig. 2a), for calculation of ΔBFat7 (Fig. 2b). Venous field shift was calculated according to ΔBO2=ΔBMeasured -ΔBFat-ΔBBackground for both multi-slice acquisitions (at rest), and time-resolved single-slice dynamic data, to calculate dynamic SvO2. VO2 = blood flow*Ca*Hgb*(SaO2-SvO2), where Ca=1.34ml O2/g of Hb, and hemoglobin was assumed to 14.6 g/dL (with Hct=0.43). Arterial blood oxygen (SaO2) was measured with a pulse oximeter.
Results
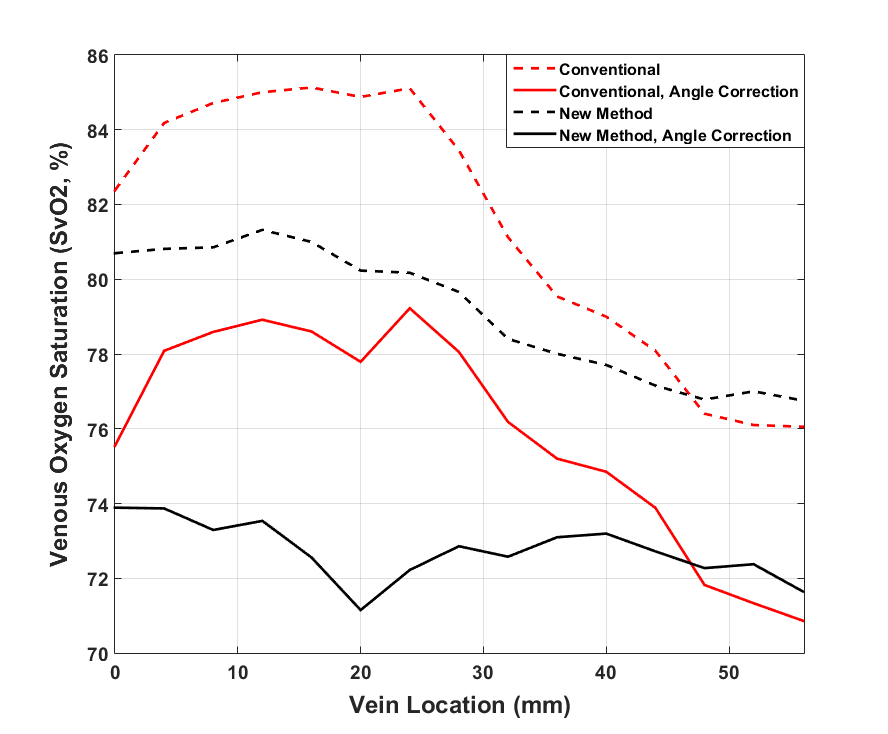
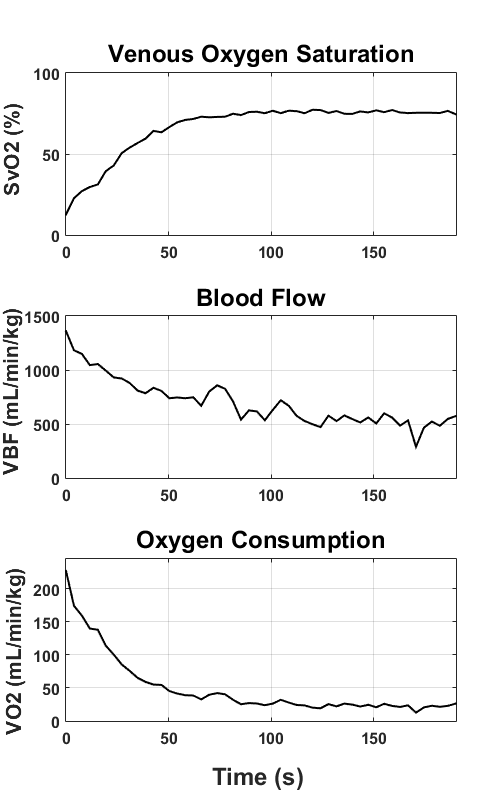
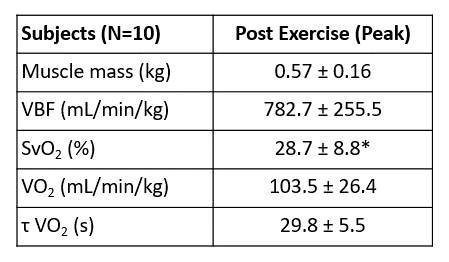
Fig. 1 shows three sample slices (of 49) showing water, fat and ΔBMeasured images. Fig. 2 shows a) a sample fat fraction map, b) the corresponding χFat image (based on fat fraction), c) the calculated ΔBFat image, d) ΔBMeasured and e) the resulting ΔBO2 image (one of 49 slices shown). Popliteal vein SvO2 at rest was measured in all subjects (from ΔBO2 images), as a function of vein position, as summarized in Fig. 3. The four plots compare of conventional (i.e. no correction for ΔBFat) and our proposed method, with and without correction for the effects of the vein angle; SvO2 is shown to depend on ΔBFat and vein angle. Fig. 4 shows typical SvO2, flow and calculated VO2 time-curves following exercise5, with a summary of results in all subjects in Table 1.Discussion and Conclusions
The magnetic susceptibility of fat gives rise to potentially complex variations in the static magnetic field in skeletal muscle, which was shown to give rise to errors in the estimated venous oxygen saturation. On a subject-by-subject basis, Dixon fat-water separated imaging can be used to measure the magnitude of (and to correct) these effects (ΔBFat), while also measuring the targeted magnetic field, ΔBMeasured, used to estimate SvO2. These methods are compatible with the targeted dynamic exercise applications, which are essential for the study of the mechanisms of reduced exercise capacity (e.g. reduced oxygen extraction, blood flow or delayed recovery following exercise).8
Acknowledgements
Canadian Institutes of Health ResearchReferences
1. Fernandez-Seara MA, Techawiboonwong A, Detre JA and Wehrli FW. MR susceptometry for measuring global brain oxygen extraction. Magn Reson Med. 2006;55:967-73.
2. Haacke EM, Lai S, Reichenbach JR, Kuppusamy K, Hoogenraad FG, Takeichi H and Lin W. In Vivo measurement of blood oxygen saturation using magnetic resonance imaging: a direct validation of the blood oxygen level-dependent concept in functional brain imaging. Hum Brain Mapp. 1997;5:341-6.
3. Li C, Langham MC, Epstein CL, Magland JF, Wu J, Gee J and Wehrli FW. Accuracy of the cylinder approximation for susceptometric measurement of intravascular oxygen saturation. Magn Reson Med. 2012;67:808-13.
4. Langham MC, Floyd TF, Mohler ER, 3rd, Magland JF and Wehrli FW. Evaluation of cuff-induced ischemia in the lower extremity by magnetic resonance oximetry. J Am Coll Cardiol. 2010;55:598-606.
5. Mathewson KW, Haykowsky MJ and Thompson RB. Feasibility and reproducibility of measurement of whole muscle blood flow, oxygen extraction, and VO2 with dynamic exercise using MRI. Magn Reson Med. 2015;74:1640-51.
6. Hernando D, Kellman P, Haldar JP and Liang ZP. Robust water/fat separation in the presence of large field inhomogeneities using a graph cut algorithm. Magn Reson Med. 2010;63:79-90.
7. Salomir R, De Senneville BD and Moonen CTW. A fast calculation method for magnetic field inhomogeneity due to an arbitrary distribution of bulk susceptibility. Concept Magn Reson B. 2003;19b:26-34.
8. Thompson RB, Tomczak CR and Haykowsky MJ. Evaluation of Cardiac, Vascular, and SkeletalMuscle Function With MRI: Novel Physiological End Points in Cardiac Rehabilitation Research. Can J Cardiol. 2016;32:S388-S396.
Figures
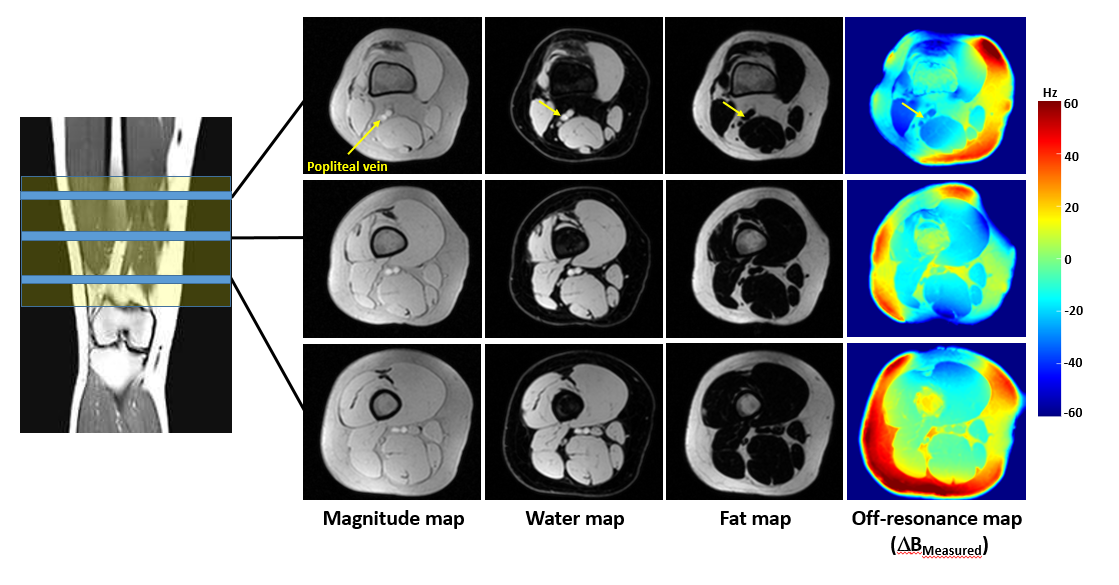
Figure 1: Spatial coverage and slice prescription of fat, water and off-resonance images, showing the popliteal vein locations (3 sample slices shown). Water, fat, and off-resonance maps were calculated using a multi-echo DIXON acquisition with VARPRO processing.
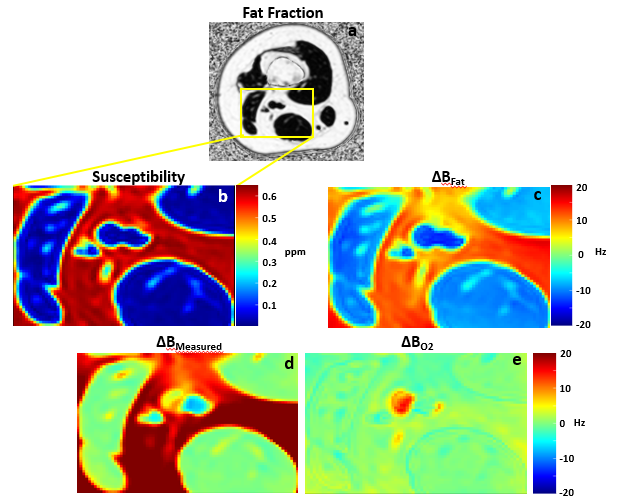
Figure 2: Measurement of and correction for the magnetic field shift from fat. The fat-fraction map (a) is used to generate a fat-susceptibility map (b) and to calculate a resulting field shift (c). The measured magnetic field (d) is corrected for the fat-induced field shift from c to yield the final venous oxygen field shift (e), for calculation of SvO2.