5131
Non-Gaussian diffusion of human skeletal muscle water and metabolites observed using proton diffusion-weighted spectroscopy1National Institute on Aging, NIH, Baltimore, MD, United States, 2C.J. Gorter Center for High Field MRI, Department of Radiology, Leiden University Medical Center, Leiden, Netherlands
Synopsis
Micro- and ultrastructural properties of skeletal muscle have a direct impact on function and modulate the diffusion of both water and metabolites. Anomalous diffusion models can be used to characterize non-Gaussian diffusion and specifically subdiffusive dynamics, which are expected to reflect ultra-structural tissue properties. Here, we present fits of the single-parameter Mittag-Leffler diffusion model to diffusion weighted spectroscopy data, showing subdiffusive motions of skeletal muscle water and metabolites.
Purpose
Skeletal muscle is an anisotropic tissue for which the organization and orientation of the muscle fibers has a direct impact on muscle mechanics and function.1 Diffusion-weighted (DW) imaging is frequently used to probe the microstructural properties of normal and pathological human tissues2 and is increasingly applied to the study of skeletal muscle.3,4 Disruptions in muscle fibers at both the microstructural (cellular) and ultrastructural (sub-cellular) scale have been associated with both myopathology2,5 and functional decline with aging.6,7 While DW imaging studies are limited to the observation of tissue water which exists in multiple compartments both within the cell and outside the cell, DW spectroscopy can be used to observe individual metabolites;8 some of these metabolites have been identified in specific cellular compartments providing improved specificity over diffusion measurements of water alone.9 While diffusion studies typically adhere to Gaussian models for molecular motions, non-Gaussian diffusion is expected in complex environments with evidence suggesting subdiffusive dynamics, characterized by a power-law relationship between the mean-squared displacement and time.10 Subdiffusion measurements in skeletal muscle are particularly challenging using standard DW imaging methods due to the more slowly diffusing lipid signals which persist longer than that of water at high b-values; imperfect suppression or separation of lipid signals from water can result in fit errors biased towards apparent subdiffusive behavior. Here, we use DW spectroscopy measurements with multiple b-values showing subdiffusive behavior of metabolites and water in human skeletal muscle.Materials & Methods
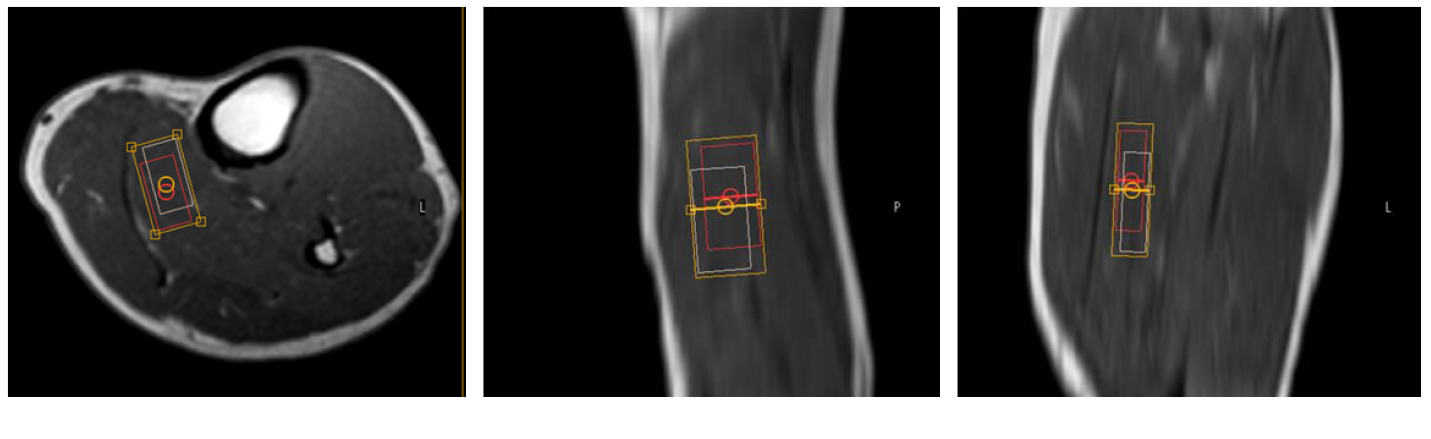
11 healthy volunteers (age range 23-70 years old, 5 female, 6 male) were studied using a 3T Philips Achieva MRI system (Philips, Best, The Netherlands). The center of the subject’s lower left leg was positioned in an 8 channel SENSE knee coil and an 8 cm3 voxel was positioned in the soleus muscle (Figure 1) using an axial T1-weighted image for voxel planning. DW spectra were acquired using a STEAM sequence with cardiac synchronization.8 Three orthogonal diffusion directions were selected, coinciding with the voxel axes and approximately aligned with the fiber direction in the soleus muscle. DW spectra were obtained using a TR of every third cardiac cycle, TE=55ms, Δ=175ms, δ=15ms, and 7 gradient amplitudes with b-values ranging from 0- 4,250s/mm2. Spectra were analyzed using a linear-prediction singular value decomposition algorithm to quantify the amplitudes of metabolite signals.11 The following signal model was fit to the data as a function of b-value (b):
$$S(b)/S(0) = Eɑ (-bD),$$
where Eɑ is the single-parameter Mittag-Leffler function with the anomalous parameter (ɑ) ranging between 0 and 1, and D is the diffusion coefficient.12 For ɑ values of 1, the Mittag-Leffler function is equivalent to the exponential function thus representing Gaussian motion; decreasing values of ɑ represent an increase in subdiffussive motions. All fits were performed using a custom Matlab code.
Results and Discussion
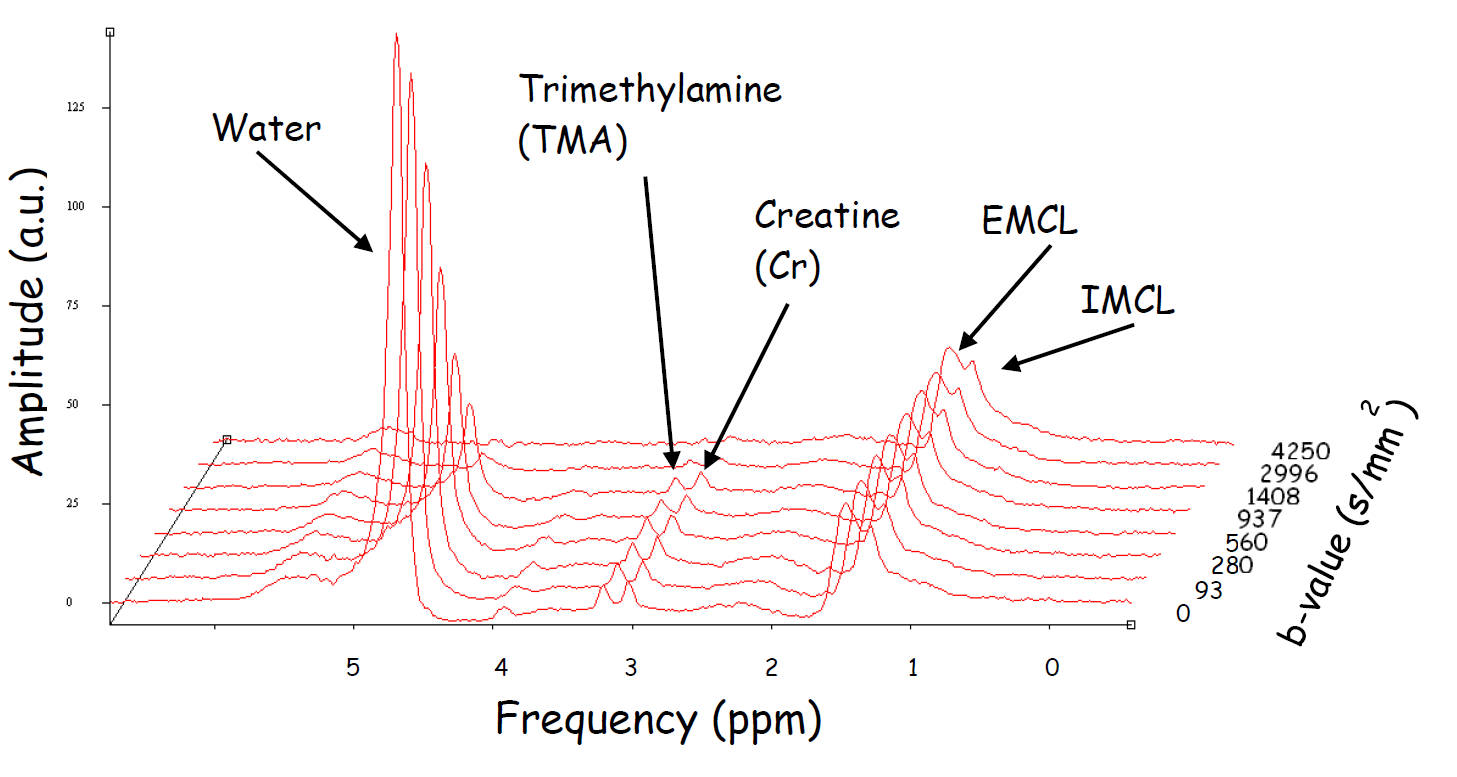
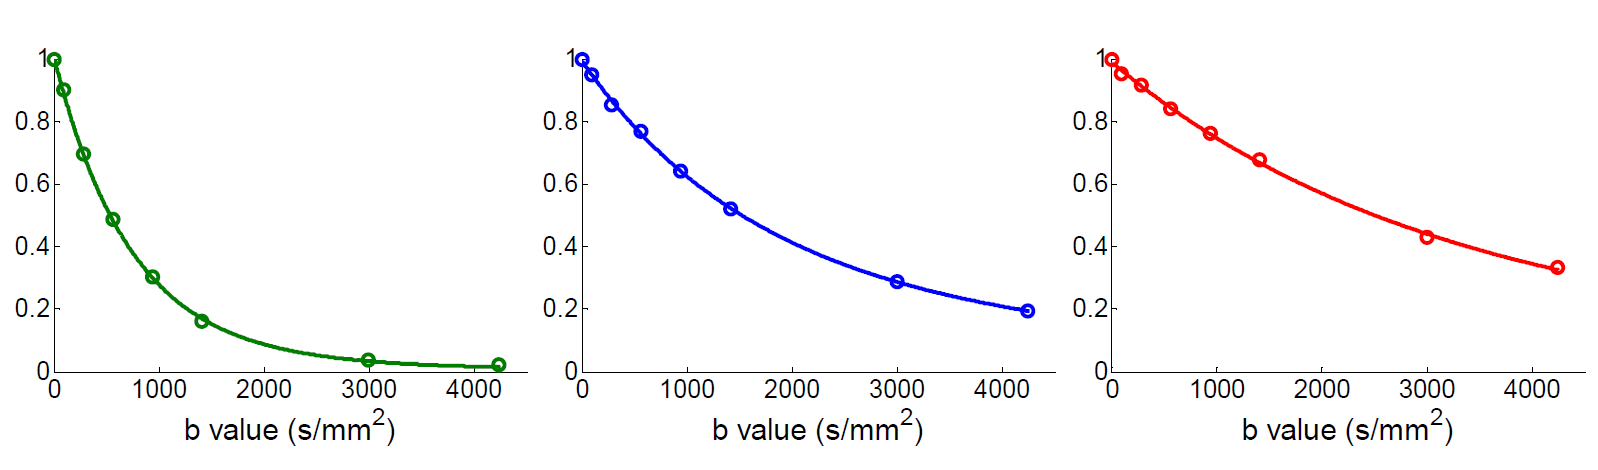
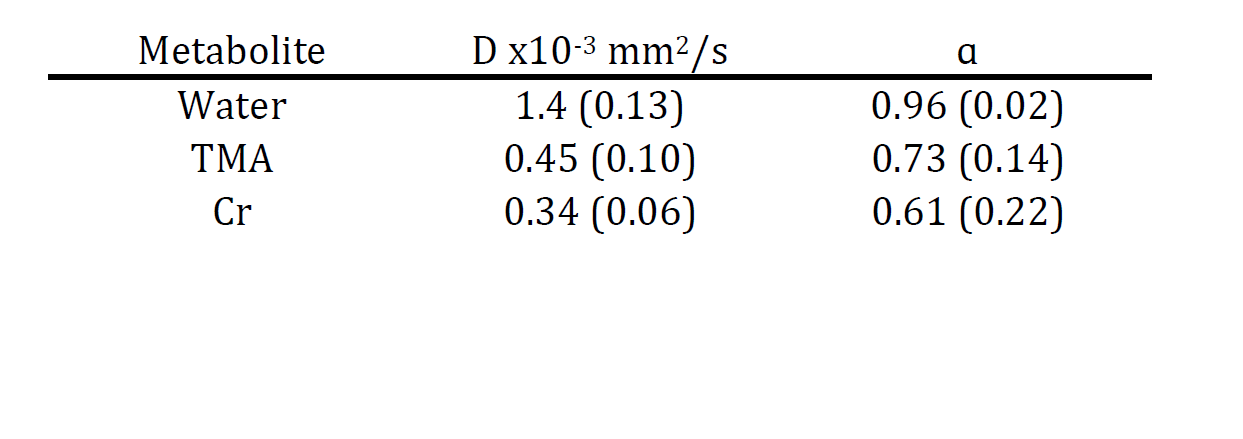
Figure 2 shows example DW spectra with water and metabolite peaks showing attenuation with increasing b-value. Figure 3 shows example fits of the Mittag-Leffler function (lines) to the water and metabolite signal values (circles) obtained from DW spectra. Table 1 shows D and ɑ values for water, trimethylamine (TMA), and creatine (Cr). The diffusion values for metabolites are about 1/3 that of water, consistent with previous DW measurements in muscle.8 Water shows non-Gaussian motions with ɑ values of 0.96 which is consistent with previously reported DWI-derived kurtosis values in skeletal muscle.10,12 However, in the current work, the clear separation of water and lipid signals obtained using spectroscopy affords unambiguous interpretation of the observed non-Gaussian diffusion of water which can be attributed to subdiffusive dynamics of water within the tissue environment rather than arising from a bias error due to the contamination of lipid signals as can be the case with imaging. Both TMA and Cr show larger deviations from Gaussian diffusion compared with water, with ɑ values of 0.73 and 0.61. Similar observations have been previously reported in grey and white matter which exhibit more pronounced subdiffusive properties of metabolites compared with water.13 Differences in D and ɑ values between water and metabolites could represent differences in compartmentation and in the interaction the diffusing molecules of differing molecular weight with sub-cellular structures.Conclusion
DW spectroscopy allows for refined assessment of the diffusion properties of skeletal muscle which is complementary to DW imaging studies of water, providing an approach for probing microstructural and ultrastructural tissue properties. Quantitative measurements of subdiffusion in skeletal muscle have the potential for interrogating ultrastructural changes resulting from pathology and aging.Acknowledgements
This research was supported in part by the Intramural Research Program of the NIH, National Institute on Aging.References
1. Englund E.K., Elder C.P., Xu Q., et al. Combined diffusion and strain tensor MRI reveals a heterogeneous, planar pattern of strain development during isometric muscle contraction. Am. J. Physiol. Regul. Comp. Physiol. 2011. 300:R1079-R1090.
2. Le Bihan D., Mangin, J-F., Poupon C., et al., Diffusion Tensor Imaging: Concepts and Applications. J. Mag. Res. Imag. 2001; 13:534-546.
3. Hooijmans M.T., Damon B.M., Froeling M., et al. Evaluatino of skeletal muscle DTI in patients with Duchenne muscular dystrophy. NMR in Biomed. 2015; 28:1589-1597.
4. Qi J., Olsen N.J., Price R.R., et al., Diffusion-weighted imaging of inflammatory myopathies: polymyositis and dermatomyositis. J. Magn. Res. Imag. 2008; 27:212-217.
5. Emery A.E.H. Muscle histology in carriers of Duchenne muscular dystrophy. J. Med. Genet. 1965. 2:1-7.
6. Galban C.J., Maderwald S., Stock F., Ladd M.E., Age-related changes in skeletal muscle as detected by diffusion tensor magnetic resonance imaging. J. Geron. Med. Sci. 2007; 62A:453-458.
7. Oertel G. Changes in human skeletal muscles due to ageing. Acta. Neuropathol. 1986; 69:309-313.
8. Brandejsky V., Boesch C., Kreis R. Proton diffusion tensor spectroscopy of metabolites in human muscle in vivo. Magn. Res. Med. 2015. 73(2):481-7.
9. Ronen I., Valette J. Diffusion-weighted magnetic resonance spectroscopy. eMagRes 2015; 4:733-750.
10. Marschar A.M., Kuder T.A., Stieltjes B., et al. In vivo imaging of the time-dependnent apparent diffusional kurtosis in the human calf muscle. J. Magn. Res. Imag. 2015; 41:1581-1590.
11. Vanhamme L., Fierro R.D., Juffel, S.V. et al. Fast removal of residual water in proton spectra. J. Magn. Res. 1998; 132, 197-203.
12. Ingo C., Sui Y., Chen Y., et al., Parsimonious continuous time random walk models and kurtosis for diffusion in magnetic resonance of biological tissue. Front. Phys. 2015; 3(11):1-11.
13. Ingo C., Brink W.M., Ercan et al., Intracellular metabolites exhibit non-Gaussian diffusion in the healthy human brain using magnetic resonance spectroscopy at 7 Tesla. (2015) Proc. Intl. Soc. Magn. Reson. Med., #3079.
Figures