5130
Phosphodiester-levels in Muscle Assessed using 31P MRS are an Early Marker for Disease Activity in DMD1C.J.Gorter Center for High-field MRI, Dept. of Radiology, Leiden University Medical Center, Leiden, Netherlands, 2Dept. of Neurology, Leiden University Medical Center, Leiden, Netherlands
Synopsis
Quantitative MR of muscle is increasingly important as potential outcome measure for therapy development in DMD. Since therapy is aimed at preserving or improving muscle tissue, an early marker that reflects muscle state with a suitable dynamic range is essential. Unfortunately, water T2 and %fat do not meet this criteria. Therefore, we aimed to assess whether phosphodiester (PDE)-levels detected by 31P MRS could fill this gap. We have shown a two-fold increase in PDE-levels compared to controls and its detection prior to structural changes which confirm the potential of PDE as an early marker for disease activity in DMD patients.
Introduction
Duchenne Muscular Dystrophy (DMD) is a progressive muscle disease which largely lacks an effective therapy.1,2 Quantitative MR of muscle is increasingly important as potential outcome measure, where both fat fraction (%fat) and water T2 are commonly used. As therapy development aims to improve or preserve the quality of the muscle tissue, an early marker that reflects muscle state with a suitable dynamic range is essential. Unfortunately, both %fat and water T2 do not meet these criteria. While %fat correlates well with function, it reflects the replacement of muscle by fat rather than the functional state of the muscle. Although water T2 reflects muscle condition, is sensitive to inflammation and has proved to be reversible upon therapy, it has a very small dynamic range in DMD.3 In this study, we aimed to assess whether phosphodiester (PDE)-levels detected by 31P MRS could fill this gap. PDE levels, generally associated with membrane degradation products, have been shown to be elevated in the absence of structural changes and to remain elevated in more severely affected muscles in DMD, and also to revert back to normal after therapy in GRMD, a canine model for DMD.4,5,6 However, longitudinal and spatially resolved data are lacking. Since DMD muscles become affected at different time points and with different rates, we present longitudinal and spatially resolved 31P MRS and qMRI data of three lower leg muscles that represent varying disease stages.7,8Methods
Phosphorous datasets were acquired in the right lower leg of ten DMD patients (range: 5.5-8.9 years) and 12 healthy controls (range: 5-14 years) at baseline (DMD/HC n=10/12), 12-months (DMD/HC n=10/12) and 24-months (DMD/HC n=7/8) using a 7T MR-System (Philips Achieva) with a custom-built double-tuned volume coil ( (31P 2D-CSI :(10x10 hamming-weighted acquisitions; TR 2000ms; FA 45°; voxel size 20x20 or 15x15mm2 depending on leg size, NSA: 2). 3-point Dixon images (23 slices; slice thickness/gap 10/5mm; TR/TE/ΔTE 210/4.41/0.76 ms; NSA:2; FA 8°; 1x1x10mm) were acquired at 3T (Philips Ingenia) with a 16-element receive coil.Data-analysis
All phosphorus datasets were analyzed using AMARES in jMRUI using Gaussian lineshapes.9 PDE-levels were determined as a ratio over the γ-ATP signal. Fat fraction maps were reconstructed according to a 6-peak fat model and reported as a mean value per individual muscle. Three lower leg muscles were analyzed: the late-affected Tibialis Posterior (TP), middle-affected Soleus (SOL) and early-affected Peroneus (PER) muscle. Differences between groups and time-points were assessed with non-parametric tests with correction for multiple comparisons. The relationship between PDE-levels and age in the TP muscle was assessed with a Spearman correlation as post-hoc analysis.Results
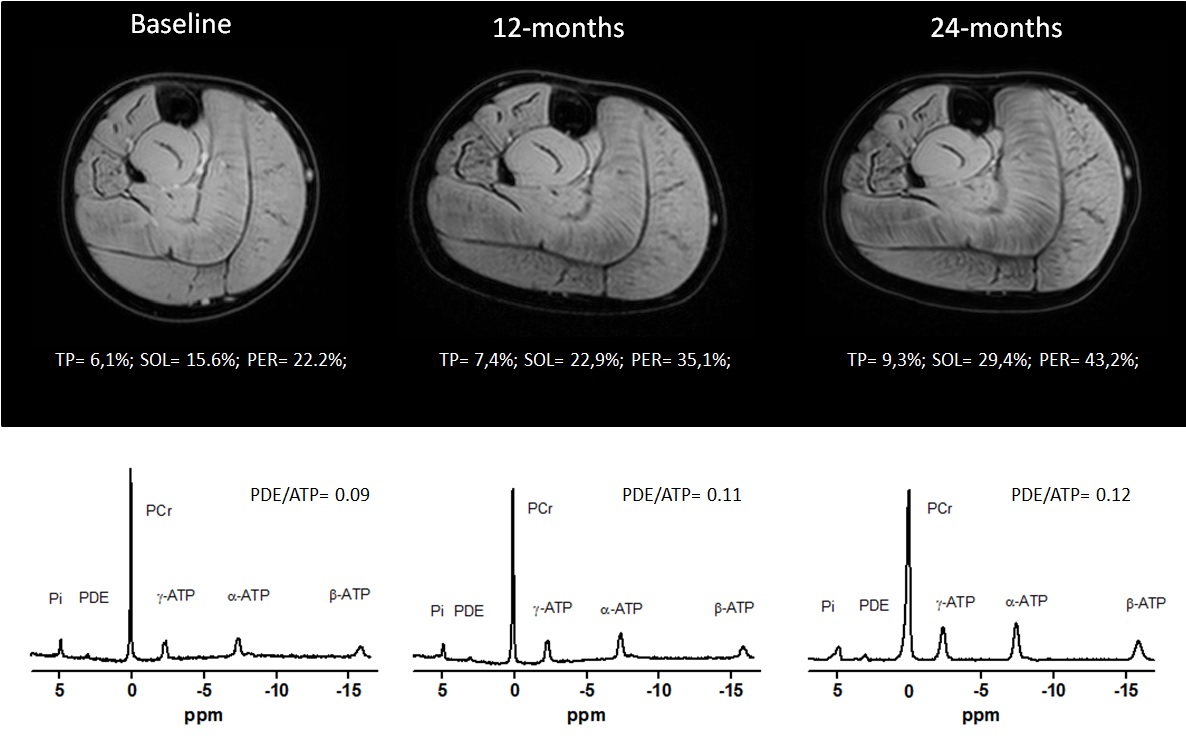
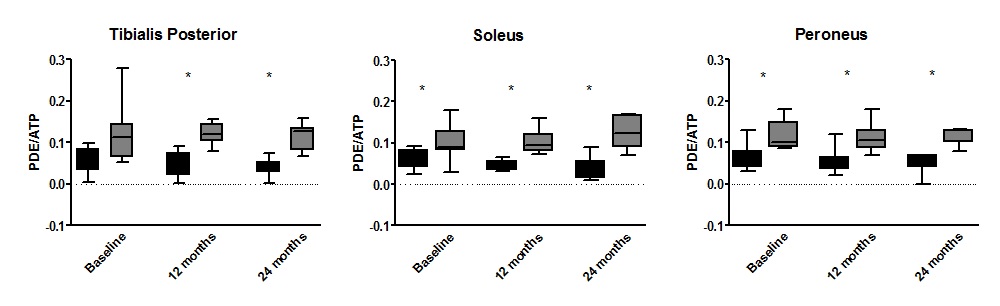
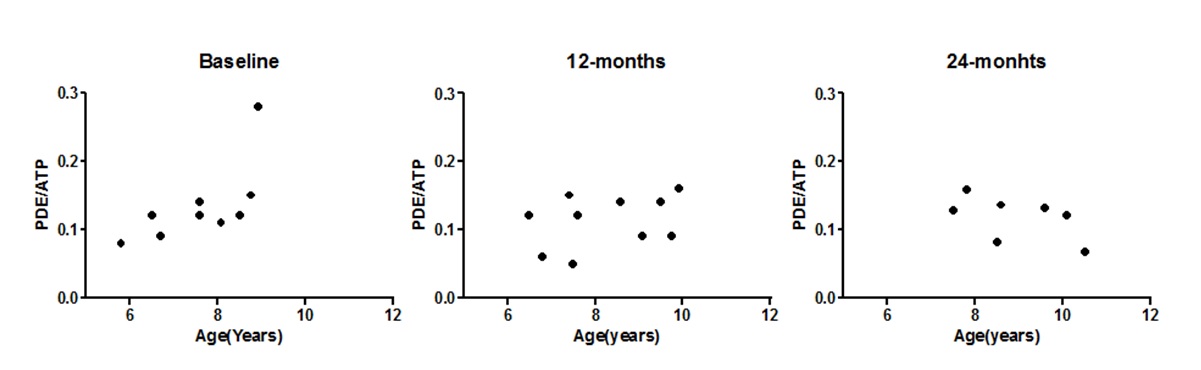
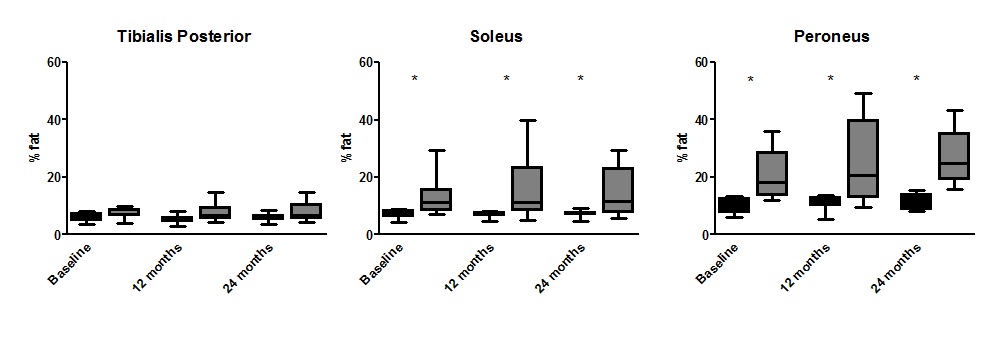
Longitudinal phosphorous spectra and reconstructed water maps for a representative DMD patient are shown in Fig.1. PDE-levels were significantly elevated compared to controls at all time-points for all three muscles (p≤0.006, Fig.2), with the exception of the TP muscle at baseline (p=0.021). PDE/ATP ratios were similar between baseline, 12-months and 24-months for the individual muscles. However, post-hoc analysis showed a significant positive correlation with age in the TP muscle at baseline only (Fig.3). Fat fraction was significantly elevated in the PER and SOL muscles compared to healthy controls at baseline (p≤0.01)(Fig.4), and significantly increased over time in the SOL and PER muscle of the DMD patients.Discussion
We have shown that PDE-levels are increased two-fold compared to healthy controls in muscles at varying disease stages at virtually all time-points, and did not change over a two-year period. This shows that, although DMD boys were recruited as early as 5.5 year-old, PDE levels were elevated prior to their inclusion in the study. However, PDE levels did not seem to be progressive over two years in the age range studied. The only muscle that did not show abnormal PDE-levels was the TP muscle at baseline. Interestingly, this muscle is known to be affected relatively late in the course of the disease, which was confirmed in our data by normal %fat at baseline and no significant change over time. In contrast, PDE levels became significantly elevated in the TP in subsequent exams at 12 and 24 months. This suggests that PDE-levels may increase only very early in the disease process, after which they apparently reach a plateau. This hypothesis is strengthened by the correlation with age in the TP muscle at baseline, the stabilized elevation at later stages, and previous results of stable PDE levels in ambulant patients5.Conclusion
The two-fold increase in PDE-levels compared to controls and its detection prior to structural changes confirm the potential of PDE as a marker for disease activity in DMD patients.Acknowledgements
This work was funded by the Netherlands Organization for Health Research and Development (ZonMW) (Grant number: 113302001).References
1] Willcocks RJ, Rooney WD, Triplett WT et al. Multicenter prospective longitudinal study of magnetic resonance biomarkers in a large duchenne muscular dystrophy cohort. Ann Neurol. 2016;79(4):535-547.
2] Hogrel JY, Wary C, Moraux A et al.Longitudinal functional and NMR assessment of upper limbs in Duchenne muscular dystrophy. Neurology. 2016;86(11):1022-1030.
3] Arpan I, Willcocks RJ, Forbes SC et al. Examination of effects of corticosteroids on skeletal muscles of boys with DMD using MRI and MRS. Neurology. 2014;83(11):974-980.
4] Hooijmans MT, Niks EH, Burakiewicz J et al.(2016) Elevated phosphodiester and T2 levels can be measured in the absence of fat infiltration in Duchenne muscular dystrophy patients. NMR in Biomedicine, doi:10.1002/nbm.3667
5] Wary C, Azzabou N, Zehrouni K et al. One year follow-up of Duchenne muscle dystrophy with nuclear magnetic resonance imaging and spectroscopy indices. Neuromuscular Disord. 2014;24(9-10):853-853.
6] Le Guiner C, Montus M, Servais L et al. Forelimb Treatment in a Large Cohort of Dystrophic Dog Supports Delivery of a Recombinant AVV for Exon Skipping in Duchenne Patients. Mol Ther. 2014;22(11):1923-1935.
7] Hollingsworth KG, Garrood P, Eagle M et al. Magnetic Resonance Imaging in Duchenne Muscular Dystrophy: Longitudinal Assesment of Natural History over 18 months. Muscle Nerve. 2013;48(4):586-588
8] Gaeta M, Messina S, Mileto A et al. Muscle fat-fraction and mapping in Duchenne Muscular Dystrophy: evaluation of disease distribution and correlation with clinical assessments. Skeletal Radiology. 2012;41(8):955-961
9] Naressi A, Couturier C, Devos JM et al. Java-based graphical user interface for the MRUI quantitation package. Magn Reson Mater Phy. 2001;12(2-3):141-152
Figures