5129
Quantitative evaluation of supraspinatus fatty infiltration and its relationship with tendon tear severity by using mDIXON-Quant technique1Tianjin First Center Hospital, Tianjin, People's Republic of China, 2Philips Healthcare, Beijin, People's Republic of China
Synopsis
The purpose of this study was to evaluate fatty infiltration of supraspinatus quantitatively using fat fraction measurements and investigate the relationship between fatty infiltration, muscle atrophy and tendon tear severity. Quantitative assessment of fatty infiltration was performed using 3T MRI with a mDIXON-Quant technique in 85 patients. The degree of fatty infiltration and muscle atrophy significantly increase with the extent of rotator cuff tear. The tendon tear severity correlated with fatty infiltration and muscle atrophy, and muscle atrophy correlated with fatty infiltration. mDIXON-Quant can be a reliable and accurate tool to quantify fatty degeneration of the rotator cuff muscles.
Purpose
Fatty infiltration (FI) and muscle atrophy (MA) have been described as interrelated characteristic changes that occur within the muscles of the rotator cuff after cuff tears1. It has been reported that tendon tear severity (TTS) is related to FI but not MA 2. Other studies showed that TTS are both associated with FI and MA 3. However, the results might be not accurate due to the limitation of semi-quantitative methods used to evaluate FI. The purpose of this study was to evaluate FI of supraspinatus quantitatively and furtherly investigate the relationship between FI, MA and TTS of the supraspinatus by using mDIXON-Quant technique, which has a superior reliability, reproducibility and accuracy in the evaluation of FI.Methods
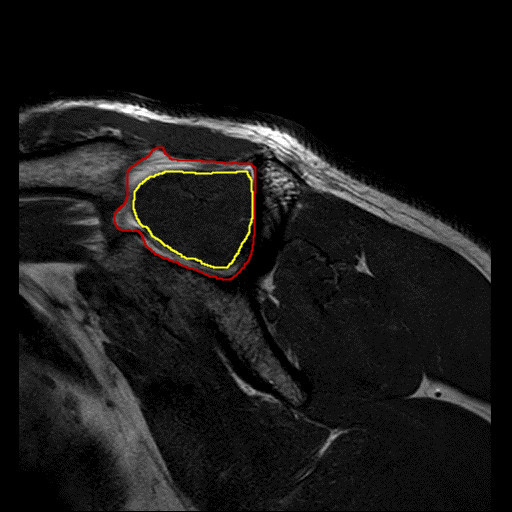
Eighty-five subjects who showed clinical shoulder symptoms and underwent shoulder MR imaging (includes mDIXON-Quant) were enrolled. The 3D mDIXON-Quant sequence has the following parameters: TR/TE1=17/1.11 ms, 6 echoes with delta TE 0.9ms, FA=3°, FOV=140×140 mm, resolution=2×2×1.5 mm, slice thickness=1.5 mm, slice number=80, scan time=30 sec, NSA=4, SENSE=2. Fat fraction (FF) calculation was performed to quantify the supraspinatus fat fraction (FF) with a precise 7-peak fat spectral model. And relative supraspinatus size (RSS)was used as a measure index of MA (Fig.1). The supraspinatus was graded into 4 groups based on routine MRI-findings to character the TTS: normal, degeneration, partial-thickness tear and complete tear. The FF and RSS in different groups were compared using one-way analysis of variance and Kruskal-Wallis test. Correlation of FF,RSS and TTS were analyzed with a Spearman Correlation analysis.Result
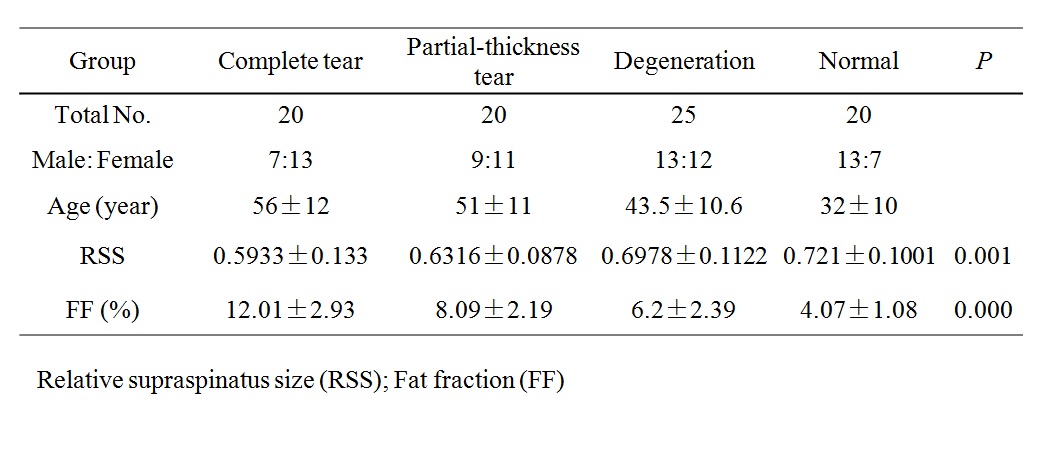
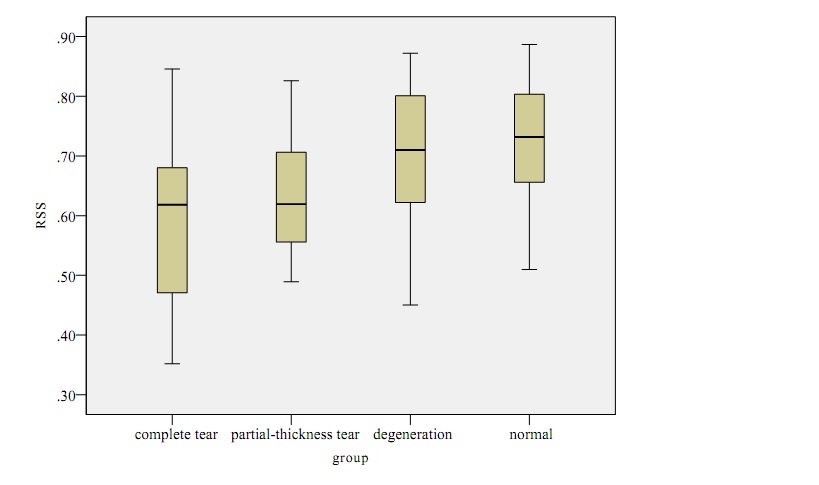
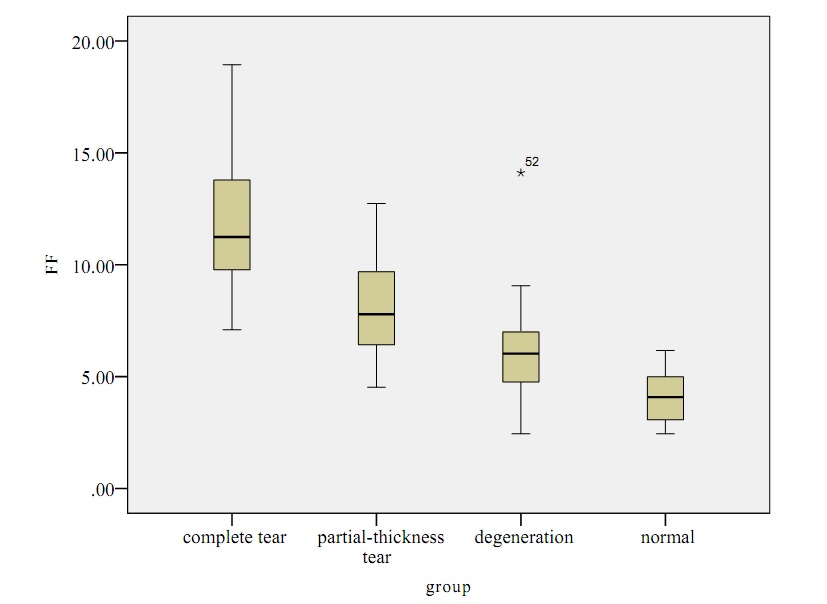
The details of FF and RSS are summarized in Table 1. There were significant differences in FF and RSS among all the groups. The results of the post hoc test showed that the RSS was significantly lower in the complete tear group compared to normal(P<0.01) and degeneration group(P<0.05) (Fig.2), and the FF of complete tear group was significantly higher than that in the groups of partial-thickness tear (P<0.05), degeneration(P<0.01)and normal (P<0.01) respectively. (Fig.3). There was also a significant difference in the FF between normal and partial-thickness tear group (P<0.01). The TTS correlated with FF and MA(both P<0.01), and MA correlated with FF. (P<0.01).Discussion
A simple in-phase and out-of-phase acquisition may be used for a qualitative assessment of fat. However, mDIXON-Quant uses a 7-echo acquisition for robust and high quality fat quantification. Using a higher number of echoes has the advantage of allowing quantitative assessment, accommodating fat molecules’ multiple spectral peaks and enabling T2* correction. T2* correction is necessary because T2* signal decay between echoes influences the relative signal intensity of the fat peaks. mDIXON-Quant enables quantification of fat in the muscle in a way that is non-invasive, fast, robust and provides high quality results 4. Our study showed that FF of the supraspinatus significantly increase with the extent of rotator cuff tear. The FF of complete tear group was significantly higher than that in the groups of partial-thickness tear (P<0.05), degeneration(P<0.01)and normal (P<0.01) respectively. There was also a significant difference in the FF between normal and partial-thickness tear group (P<0.01). We therefore conclude that mDIXON-Quant may have the potential to detect small changes in fatty degeneration and to elucidate improvement after rotator cuff repairs.Conclusion
Quantitative evaluation of fatty degeneration using mDIXON-Quant sequences shows that the degree of FI significantly elevated in patients with complete and partial-thickness supraspinatus tendon tear. mDIXON-Quant can be a reliable tool to quantify fatty degeneration of the rotator cuff muscles. The degree of MA in patients with complete tear was significantly higher than that in subjects with no tears. TTS is related to FI and MA, and MA is related to FI.Acknowledgements
No acknowledgement found.References
1. Beeler S, Ek ET, Gerber C. A comparative analysis of fatty infiltration and muscle atrophy in patients with chronic rotator cuff tears and suprascapular neuropathy. J Shoulder Elbow Surg. 2013 Nov;22(11):1537-46.
2. Barry JJ, Lansdown DA, Cheung S, et al. The relationship between tear severity, fatty infiltration, and muscle atrophy in the supraspinatus. J Shoulder Elbow Surg. 2013 Jan;22(1):18-25.
3. Barry JJ, Lansdown DA, Cheung S, et al. The relationship between tear severity, fatty infiltration, and muscle atrophy in the supraspinatus. J Shoulder Elbow Surg. 2013 Jan;22(1):18-25.
4. Pedrosa I, Yokoo T. mDIXON Quant non-invasively aids in high quality assessment of fatty liver disease. 2014. 50:16-19.
Figures