5128
Evaluation of fast radial T1 mapping for skeletal muscle tissue characterization1NMR Laboratory, Institute of Myology, Paris, France, 2NMR Laboratory, CEA, DRF, I²BM, MIRCen, Paris, France, 3Consultants for Research in Imaging and Spectroscopy, Tournai, Belgium
Synopsis
The development of quantitative NMR outcome measures in order to monitor natural history of neuromuscular disorders or therapeutic interventions is crucial. Global muscle T1 values is strongly affected in chronic disease when healthy muscle is replaced by fat and this parameter can be used for diagnostic purposes. Nevertheless, very little is known about the effects of tissue water compartmentation and distribution on muscle T1 values. Here, we investigated the variations of skeletal muscle T1 values under various physiological conditions using a fast T1 mapping sequence and evaluated the potential of this biomarker in the context of disease monitoring.
PURPOSE
In the field of neuromuscular diseases, recent years have seen tremendous progress towards the development of quantitative NMR-based outcome measures in order to monitor natural history of diseases or therapeutic interventions. The outcome measures the most frequently integrated in clinical research protocols are the muscle cross sectional volume, the percentage of intramuscular fat and the muscle water T2 which are respectively used to monitor muscle trophicity, chronic degenerative changes, and disease activity1. It is also well known that global muscle T1 values can be strongly affected in chronic disease when healthy muscle is replaced by fat. This is often used for diagnostic purposes: T1 weighted images can be graded using the Mercury-Lamminen scale2 to qualitatively assess chronic degenerative changes. Nevertheless, very little is known about the effects of inflammatory or lesional processes, and more generally on tissue water compartmentation and distribution on muscle T1 values. With the development of fast T1 mapping sequences, it is now possible to quantitatively monitor this parameter within acquisition times compatible with clinical research protocols. The goal of this study was to investigate the variations of skeletal muscle T1 values under various physiological conditions using a fast T1 mapping sequence and evaluate the potential of this biomarker in the context of disease monitoring.METHODS
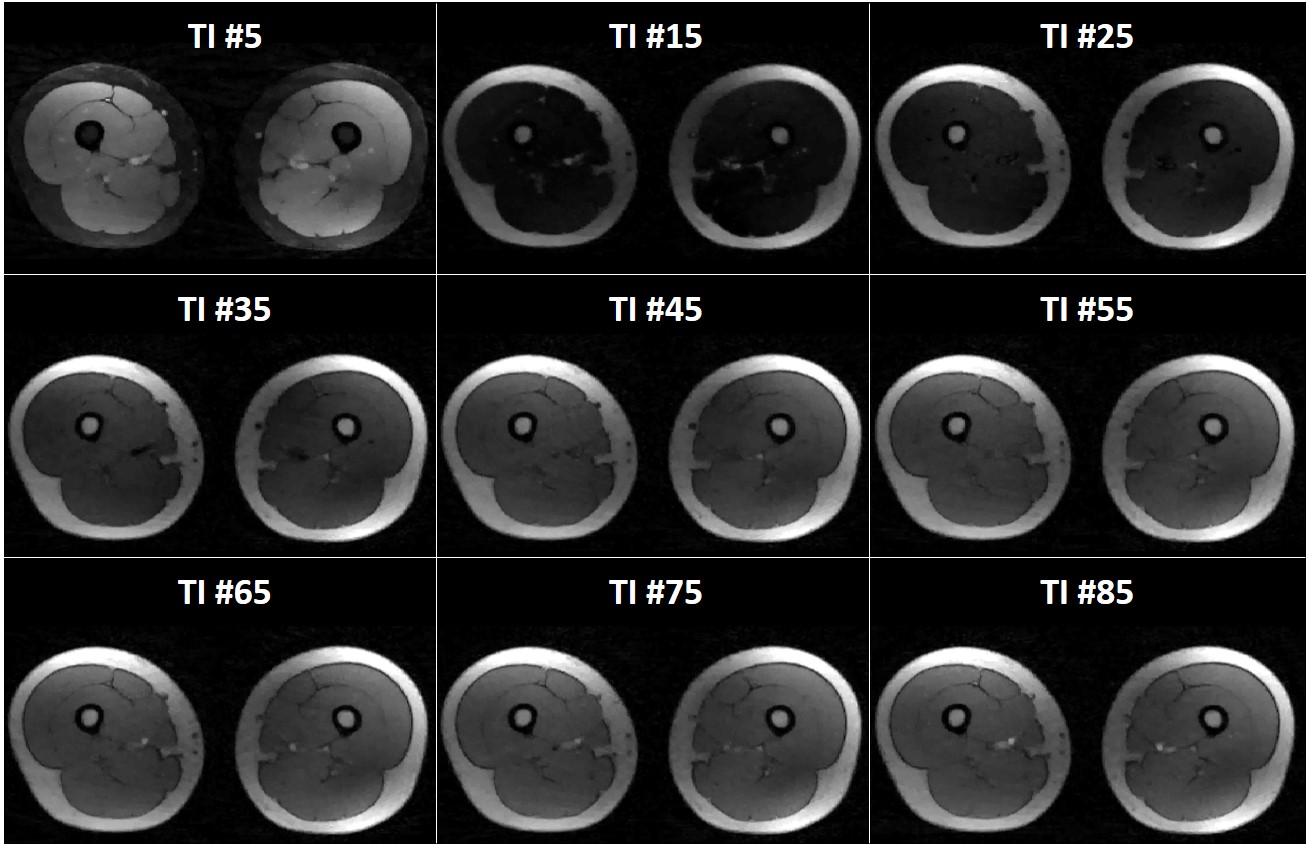
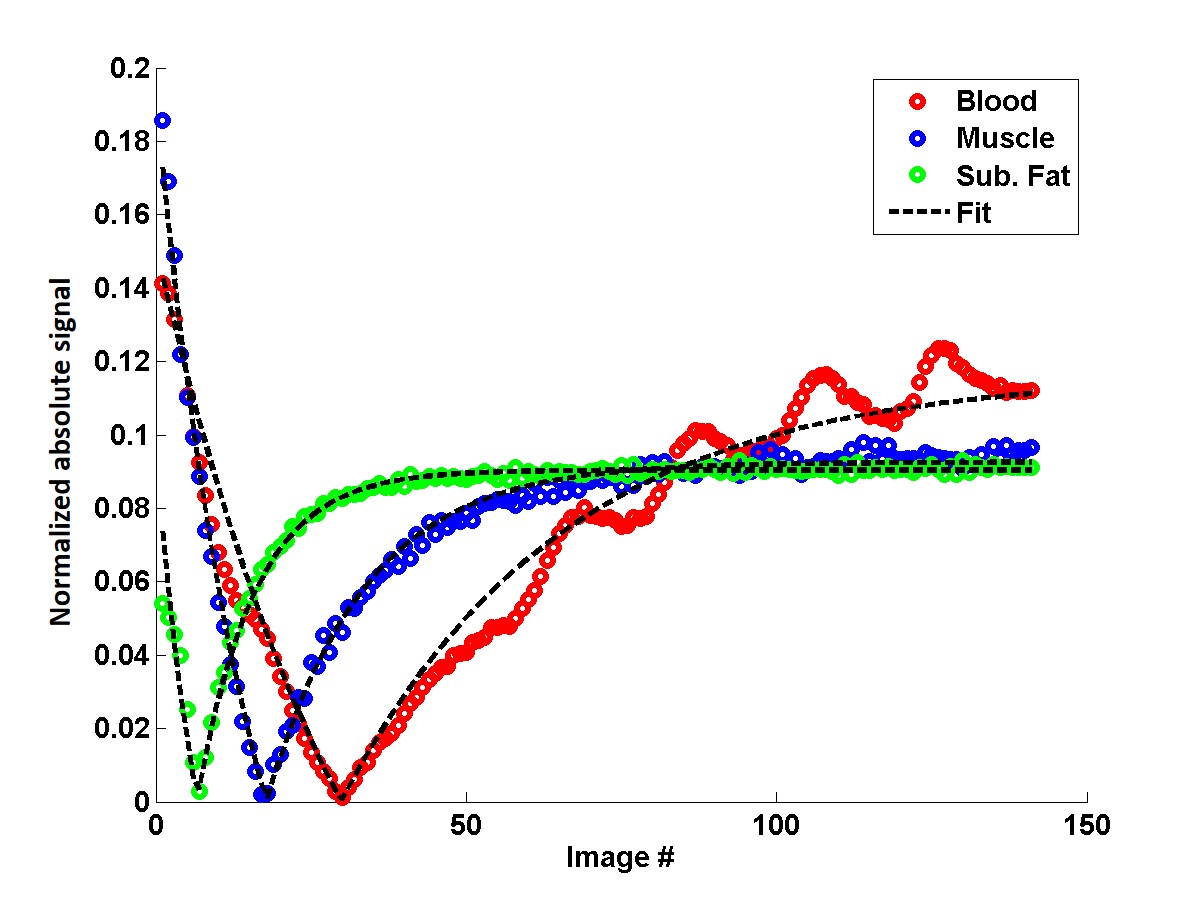
NMR imaging of the lower limbs was performed at 3T on 24 healthy volunteers and 43 patients suffering from different neuromuscular pathologies (13 Becker and 12 Duchenne dystrophy, 6 inclusion body myositis: IBM, 12 other myopathies). Five volunteers were scanned on the lower legs before and after a 10’ plantar extension bout. The T1 mapping sequence consisted in the acquisition of a 1000 radial spokes FLASH echo train following magnetization inversion. A golden angle of 111.2° was imposed between the acquisitions of 2 successive spokes for optimal k-space coverage. The following parameters were used: TE/TR = 2.75/5.08 ms, FA = 8°, BW = 1000 Hz/px, FOV = 350 mm2, resolution = 1.8x1.8 mm2, 5 slices, slice thickness = 10 mm, Tacq = 50s. For each slice, 141 images were reconstructed using view sharing and a compressed sensing algorithm with total variation regularization3 (Figure 1). Bloch simulations combined with a dictionary fitting approach allowed to adjust the signal evolution and derive a T1 value (Figure 2). An MSME sequence was also acquired (TR=3000 ms, nominal flip angles=90°/180°, a train of 17 echoes from 9.5 to 161ms, ES = 9.5ms, resolution = 1.4x1.4mm2, same slice geometry, Tacq = 3min41s) to estimate water T2 with a bi-component EPG fitting approach4. Finally, a 3D GRE acquisition was performed (TE1/TE2/TE3/TR = 2.75/3.95/7.55/10ms, spatial resolution = 1x1x5mm3, Tacq = 1min36s) to derive fat fraction maps using the 3-pt Dixon approach5.RESULTS
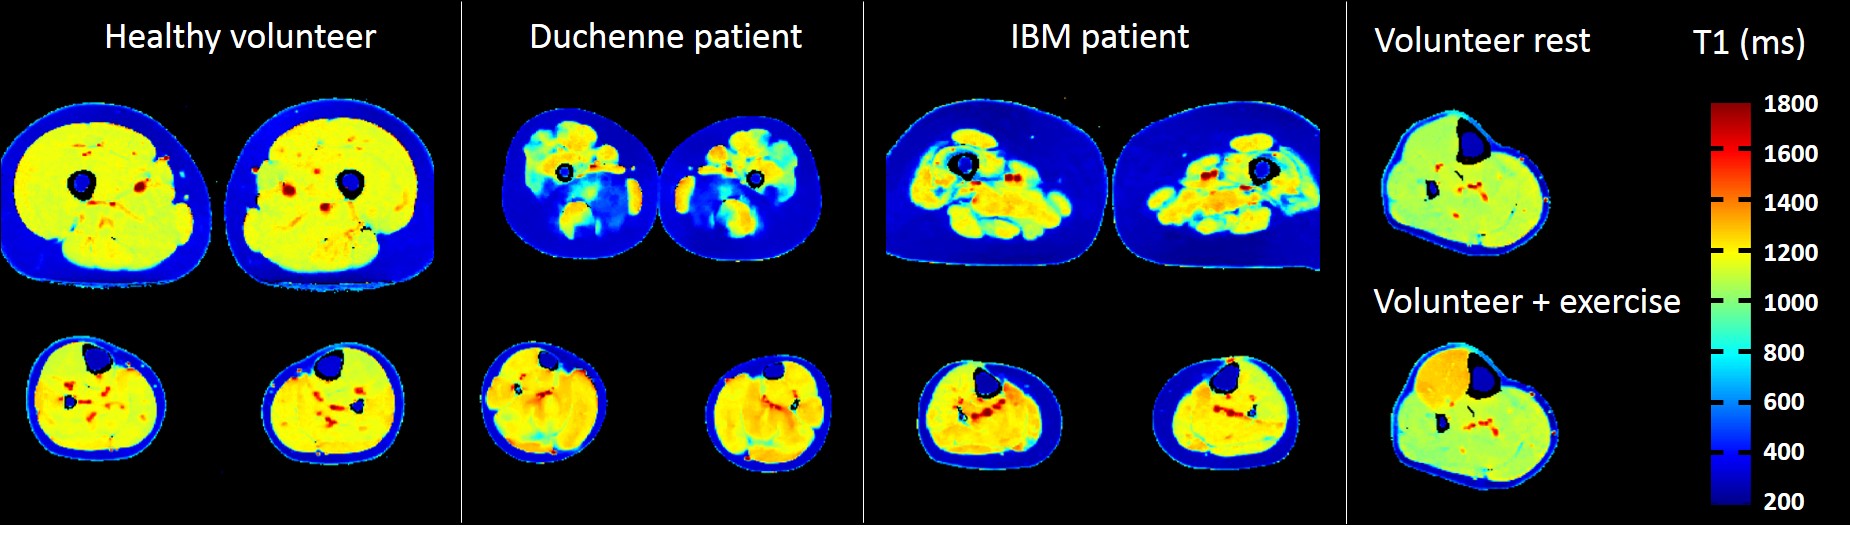
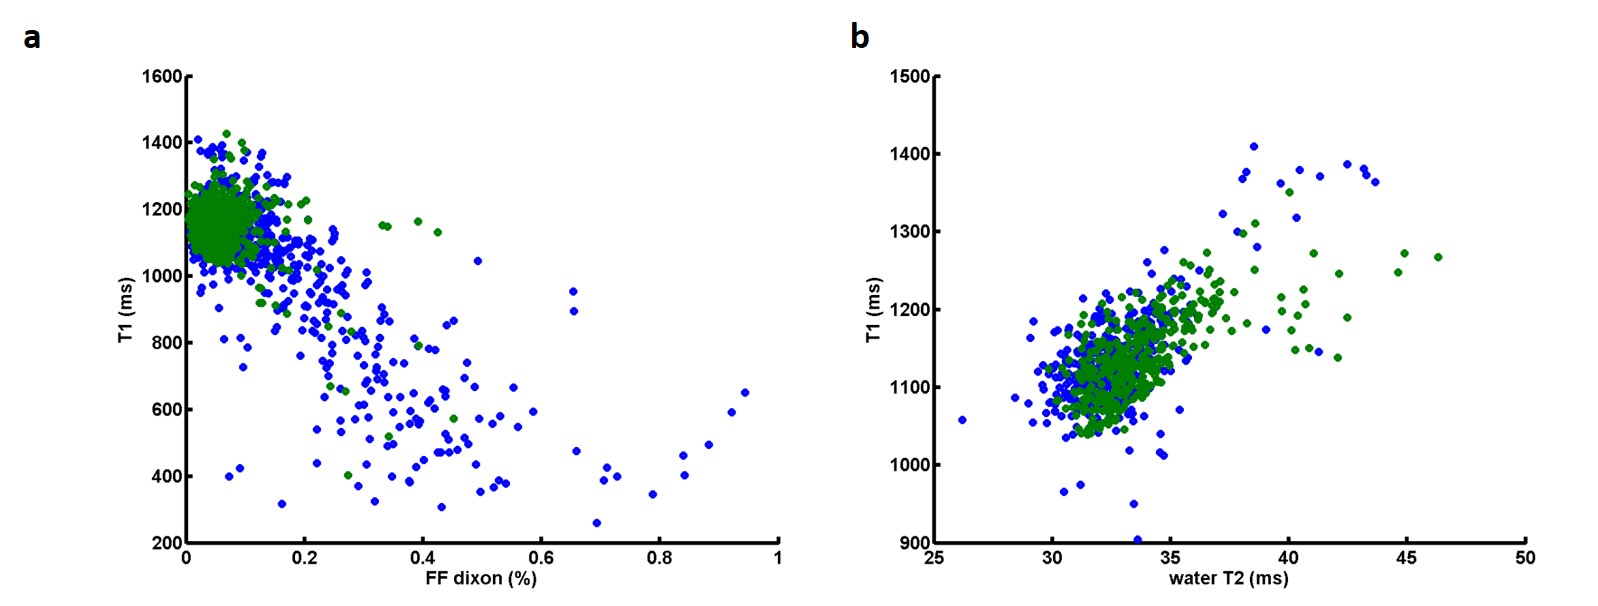
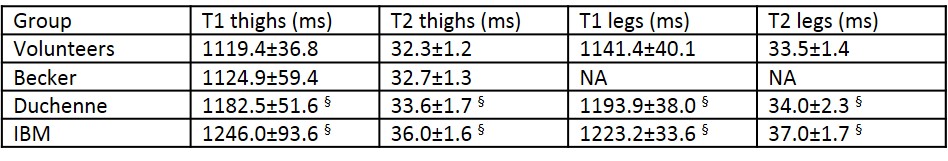
Figure 3 represents T1 maps estimated at the thigh and leg levels on a healthy volunteer, a Duchenne patient, an IBM patient, and at the leg level for a volunteer before and after exercise. T1 variations within muscle groups are clearly visible on the two patients, and in the recruited muscles of the volunteer post-exercise. As expected, on the whole cohort of subjects, T1 values negatively correlated with fat fractions (R = -0.76). T1 were also positively correlated with water T2 values in regions of interest where fat fractions were less than 6% (R = 0.65). Mean T1 and water T2 values in these regions were summarized in table 1. They were both significantly higher in the legs than in the thighs for the volunteer group (p<0.01) and both statistically higher in the IBM and Duchene group than in the volunteers group (p<0.01).DISCUSSION
T1 maps were successfully acquired on a large cohort of subjects with acquisitions time compatible with clinical research protocols. Indeed, this short scan time of 10 seconds per slice provides a valuable advantage to this approach if fast imaging is mandatory (dynamic acquisitions, imaging of pediatric population). The global T1 measured here integrated both water and fat contributions, and was, as expected lowered when intramuscular fat was present. Nevertheless, global T1 alone would have been pointless if fat fractions had not been obtained from Dixon. Interestingly, in regions of low fat fractions, global T1 was systematically increased when water T2 was increased. The sensitivity of the T1 and T2 approaches were equivalent to discriminate between the different muscle conditions. The next step will be to develop a bi-compartment fitting approach in order to simultaneously estimate water T1 and fat fractions from this T1 mapping sequence.CONCLUSION
Water T1 represents a good candidate for fast, sensitive and quantitative monitoring of neuromuscular diseases.Acknowledgements
No acknowledgement found.References
1- Carlier PG, Marty B, Scheidegger O, Loureiro de Sousa P, Baudin PY, Snezhko E, Vlodavets D. Skeletal Muscle Quantitative Nuclear Magnetic Resonance Imaging and Spectroscopy as an Outcome Measure for Clinical Trials. Journal of Neuromuscular Diseases, vol. 3, no. 1, pp. 1-28, 2016 . doi: 10.3233/JND-160145.
2- Mercuri E, Cini C, Pichiecchio A, et al. Muscle magnetic resonance imaging in patients with congenital muscular dystrophy and Ullrich phenotype. Neuromuscul Disord 2003;13:554–8.
3- Marty B, Coppa B, Carlier PG. Radial MOLLI sequence for fast, precise and accurate myocardium T1 mapping. Proc ISMRM 2016, #0986.
4- Marty B, Baudin PY, Reyngoudt H, Azzabou N, Araujo ECA, Carlier P, de Sousa PL. Simultaneous Muscle Water T2 and Fat Fraction Mapping using Transverse Relaxometry with Stimulated Echo Compensation. NMR Biomed. 2016 Jan 27. doi: 10.1002/nbm.3459.
5- Glover GH, Schneider E. Three-point Dixon technique for true water/fat decomposition with B0 inhomogeneity correction. Magn Reson Med 1991;18:371–83.
Figures