5124
Evaluating the Extraocular Muscle Changes in Thyroid Associated Ophthalmopathy using T1ρ―A Preliminary Study1Radiology, Beijing Hospital, Beijing, People's Republic of China, 2MR Research China, GE Healthcare, Beijing, People's Republic of China, 3Ophthalmology, Beijing Hospital, 4Endocrinology, Beijing Hospital
Synopsis
This study is to investigate and compare the changes of extraocular muscles in patients with active thyroid associated ophthalmopathy shown by T1ρ and T2 maps. The superior differential ability of T1ρ comparing to the currently used T2 mapping is encouraging and the flexibility in exploring the different in spin lock frequencies would be promising tool in evaluating the extraocular muscle changes with thyroid associated ophthalmopathy.
Purpose
Thyroid associated ophthalmopathy (TAO) is an
inflammatory autoimmune disorder characterized by lymphocyte infiltration of
the orbit, producing glycosaminoglycan (GAG) in the extraocular muscles (EOM).
GAG is a type of large hydrophilic molecules, and lead to an increase of the
orbital volume and edema [1]. Orbital MRI can visualize the swollen EOMs in
TAO. It was found that patients with active TAO feature hyperintense signal in
T2 images of the EOMs coursed by edema. It was also reported that T2 relaxation
times can be used to estimate the activity of TAO. However, the
predictive values of T2 signal level and T2 relaxation rates for the assessment
of activity is still under debtate [2]. T1ρ weighted imaging extract tissue
information of large molecules via lower spin lock frequency, which may not be
reflected in routine T1 and T2 imaging [3]. T1ρ may
reflect the protein content and composition of tissue that may describe the
pathological changes of TAO, however its use in TAO has not been reported. The
aim of this study is to investigate and compare the changes of EOMs inTAO patients
shown by T1ρ and T2 maps.Methods
Nine clinically confirmed TAO patients and 6
normal control volunteers were recruited in this study. The clinical activity score (CAS) of all the patients were larger
than 3 points indicating the activity of TAO. All the volunteers were
asymptomatic and no prior eye disease. The patients and volunteers
underwent MR examination including coronal T1ρ and T2 maps on a 3.0 T scanner (GE MR 750, GE Healthcare) with an 8 HD head coil. T1ρ images were
obtained using spinlock techniques and the acquisition parameters were as
follows: spin-lock time of 20/30/50/80 ms, spin-lock frequency of 100 Hz, TR/TE
of 8000/minimum ms, FOV of 22×17.6 cm, matrix size of 256×256, slice thickness of
4 mm, skip of 0 mm. Parameters of the T2 imaging were: TR/TE of 1300/ 8/16/24/32/41/49/57/65 ms. Other parameters of the T2 sequence were the same as the T1ρ sequence. T1ρ and
T2 maps were generated and the T1ρ and T2 values of the 4 rectus extraocular
muscles (superior, inferior, medial and lateral rectus) were measured. The ROIs
were placed on the largest cross section of the muscle belly of the 4 recti in coronal
T1ρ and T2 images respectively. The T1ρ and T2 values of each rectus and the
average value of 4 recti for each side of the eye were compared between the TAO
group and normal control by independent samples t-test. SPSS 19.0 was used.Results
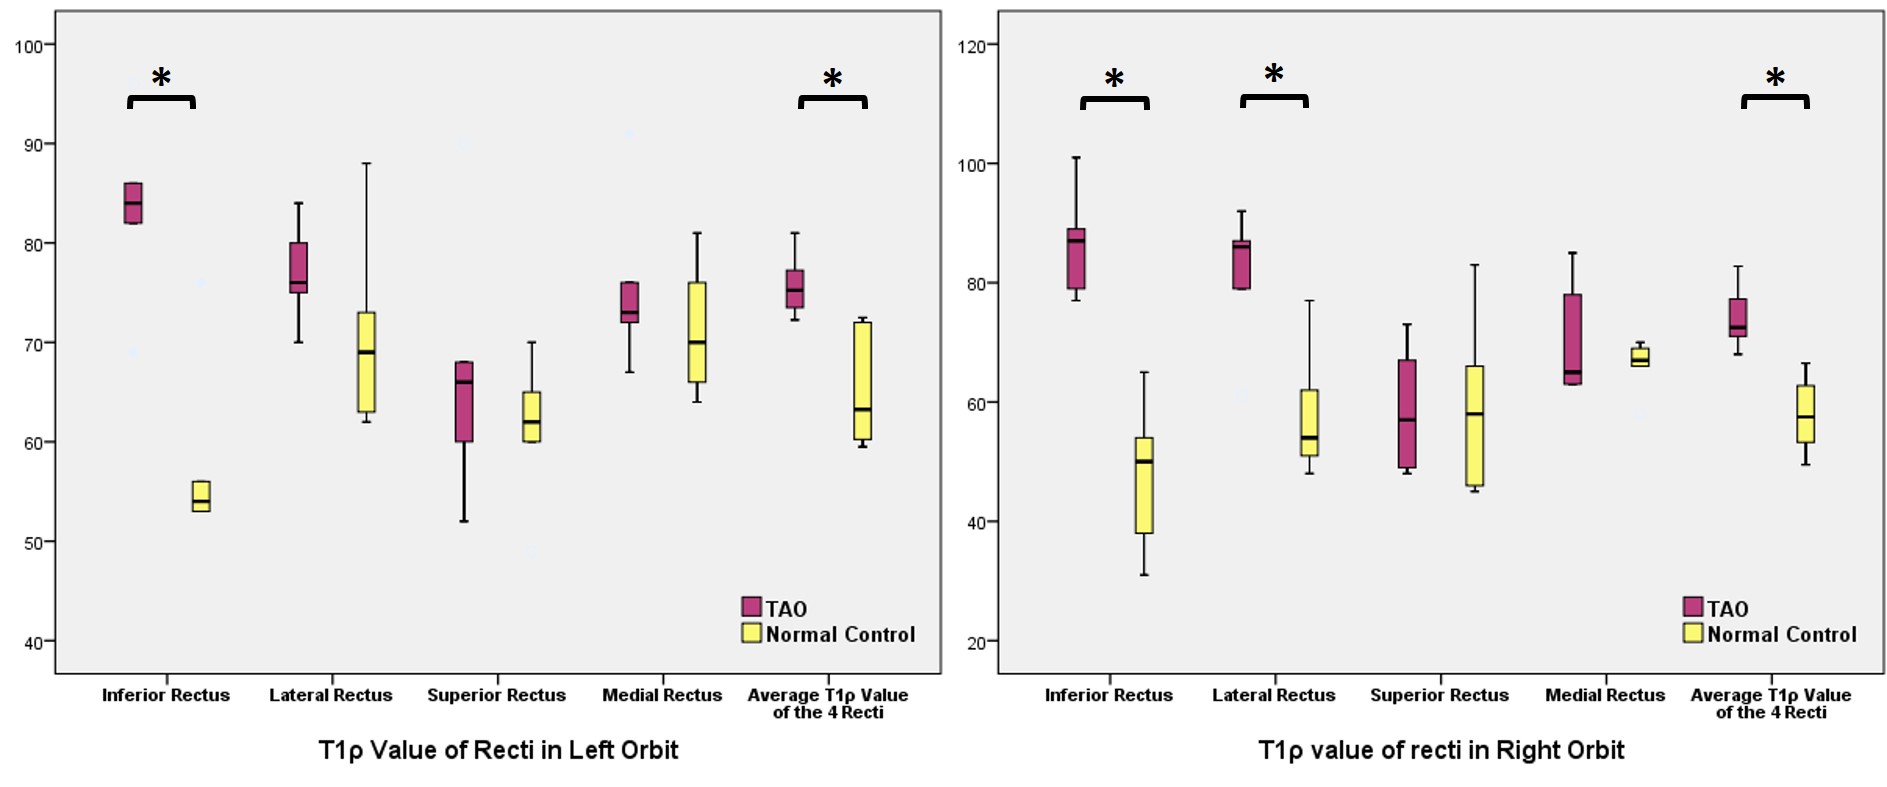
In comparison with normal control, the T1ρ
values of left inferior rectus (p=0.002), right inferior (p=0.001) and
lateral rectus (p=0.01) were significant increased in TAO patients. The average
T1ρ values of recti of both sides of eyes were also significantly higher in TAO
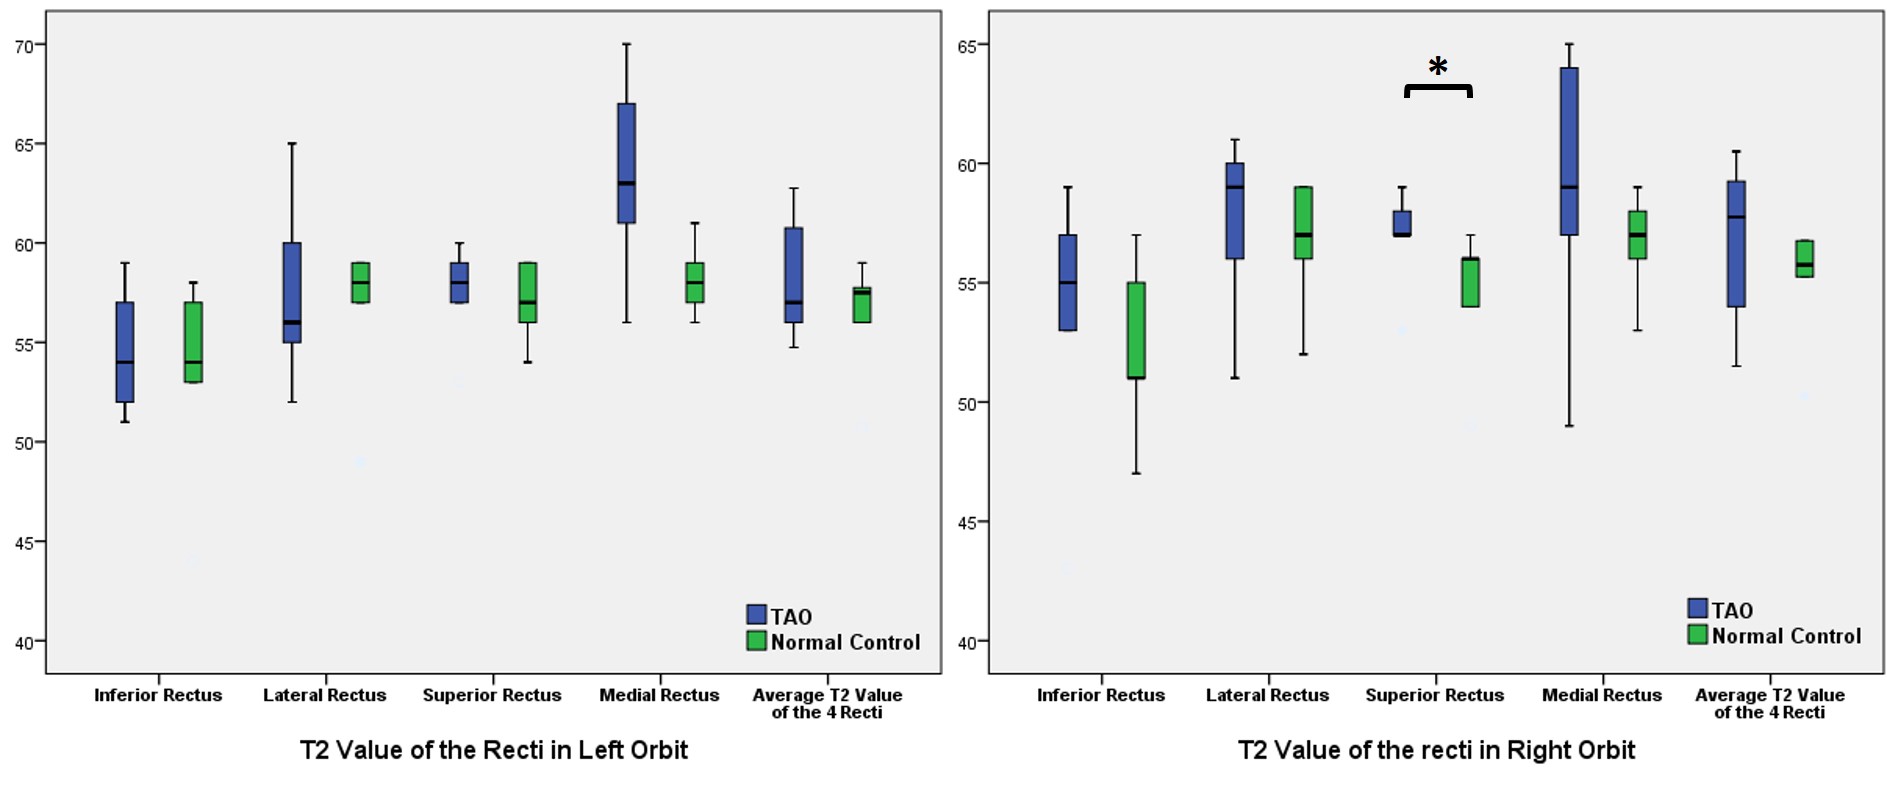
patients than normal control (both p=0.002) (Fig 1). On the other hand, the T2
values of recti and average value of each eye did not show significant
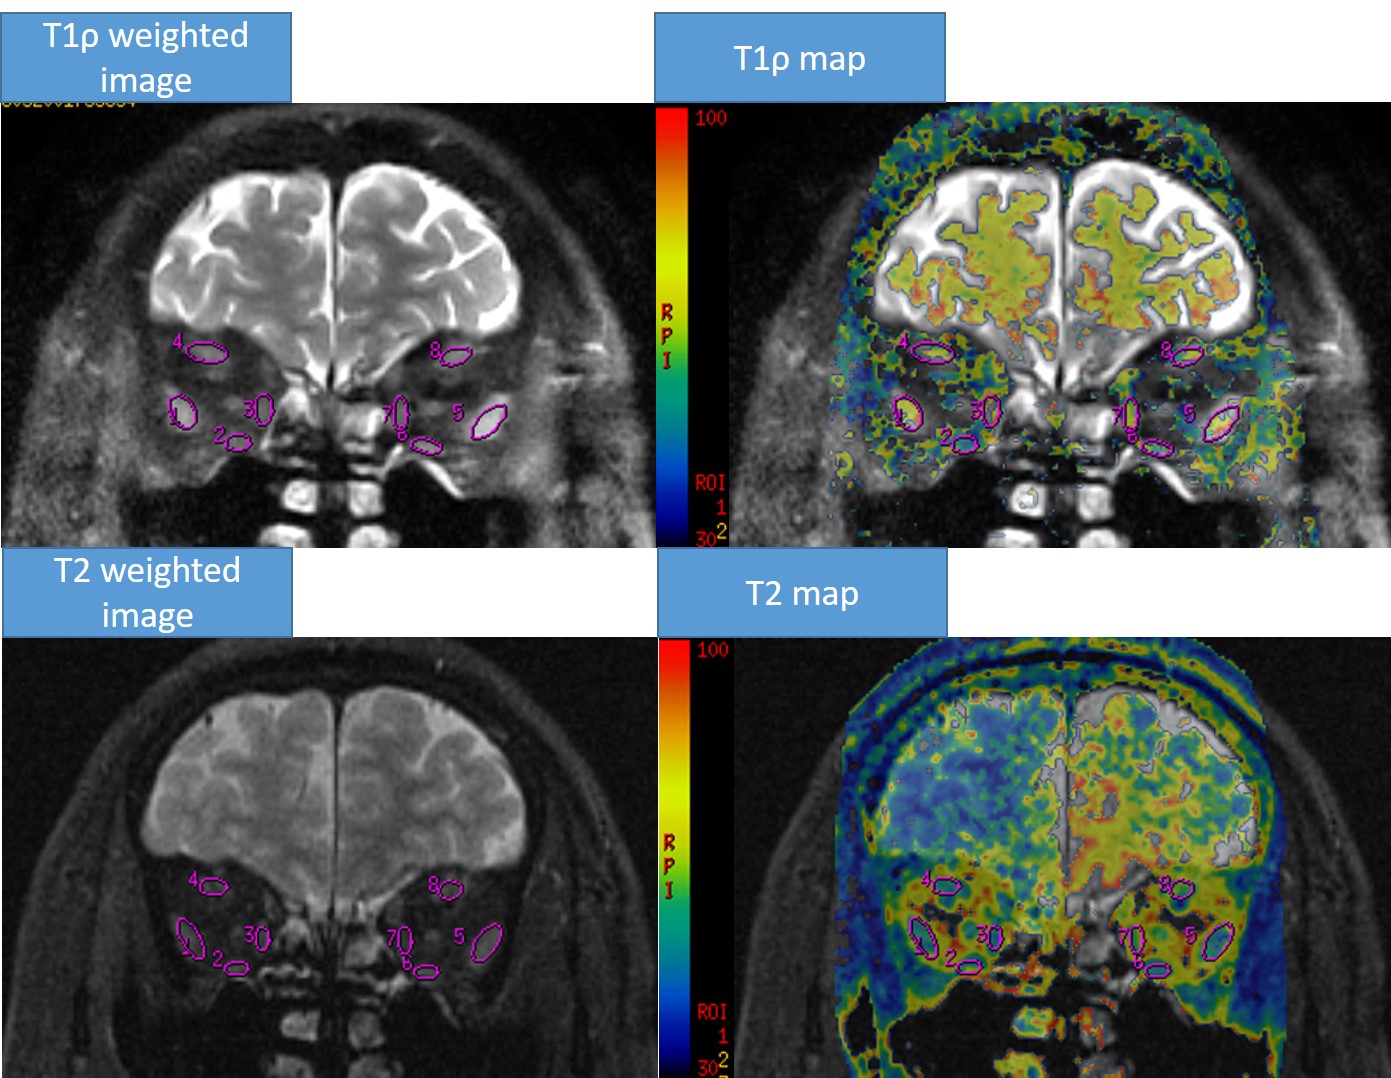
difference, except the right superior rectus (p=0.04), between the two groups (Fig 2). The T1ρ weighted images with a spin-lock time of 20
ms showed marked high signal intensity in the enlarged recti, while the T2
weighted images did not show obvious high signal in involved recti (Fig 3).Discussion and Conclusion
As demonstrauted in this study, the T1ρ mapping of
the recti can serve as a biomarker for diagnosis of TAO. When
observing each rectus, the maximum difference of T1ρ as compared to the normal
control occurs in both inferior rectus, which is consisted of the pathogenetic
sequence. The inferior rectus is usually the first and the most severe EOM when
TAO occurs[4]. However the increased T1ρ value contradicts with the known pathological
changes of TAO. With a lower spin-locking frequency used, the large molecules
can exchange the energy effectively, further to decrease the T1ρ relaxation
time [5]. The high concentration of GAG may reduce the value of T1ρ as observed
in previous work in articular cartilage [1,5]. As a result, decreased T1ρ is
expected in TAO patients compared the healthy controls. The muscle edema caused
by the deposition of GAG may be the cause. Small molecule like water may
disturb the T1ρ relaxation process and lengthen the T1ρ value. Future study
with a larer cohort would be needed for further clarification of this
phenomenon. Nevertheless, the superior differential ability of T1ρ comparing to
the currently used T2 mapping is encouraging and the flexibility in exploring
the different in spin lock frequencies would be promising tool in evaluating
the extraocular muscle changes with TAO.Acknowledgements
No acknowledgement found.References
[1] Tomoaki H, Nishida Y, Ohji M. Changes of orbital tissue volumes and proptosis in patients with thyroid extraocular muscle swelling after methylprednisolone pulse therapy. Jpn J Ophthalmol 2015; 59:430–435.
[2] Jiang H, Wang Z, Xian J, et al. Evaluation of rectus extraocular muscles using dynamic contrastenhanced MR imaging in patients with Graves’ ophthalmopathy for assessment of disease activity. Acta Radiologica 2012; 53:87-94.
[3]Stahl R, Luke A, Li X, et al. T1rho, T2 and focal knee cartilage abnormalities in physically active and sedentary healthy subjects versus early OA patients--a 3.0-Tesla MRI study. Eur Radiol 2009; 19:132-143.
[4] Yasuhiro N, Suna T, Bengt I, et al. MRI measurements of orbital tissues in dysthyroid ophthalmopathy. Graefes Arch Clin Exp Ophthalmol 2001; 239:824-831.
[5] Sridhar RC. T1ρ-weighted magnetic resonance imaging: Principles and diagnostic application Applied Radiology 2004; 32-43.
Figures