5122
Mapping of Intramyocellular Lipid Content in Foot Muscle1Biomedical Engineering, Stony Brook University, Stony Brook, NY, United States, 2Radiology, Stony Brook University, Stony Brook, NY, United States
Synopsis
Diabetic neuropathy is a leading cause of diabetic foot ulcer and has been shown to be induced by insulin resistance. Itramyocellular lipid (IMCL) measured by MRS in large skeletal muscles has been shown to correlate with insulin resistance. In this study a generalized Lorentzian approximation is used to estimate the IMCL and EMCL frequency shift as a function of muscle fiber bundle orientation. DTI is used to measure the fiber bundle orientation and provide prior information for IMCL/EMCL peak fitting. 2D-CSI is used to quantify IMCL contents in foot muscle groups of healthy subjects and diabetic patients.
Purpose:
Diabetic foot ulcer (DFU) is a major source of morbidity and health care cost in patients with diabetes mellitus (DM)1,2. Diabetic neuropathy is the leading cause of DFU and is related to increased blood glucose levels caused by insulin resistance. Intramyocellular lipid (IMCL) content has been shown to correlate with insulin resistance3 and has potential as a biomarker of DFU. Magnetic resonance spectroscopy (MRS) has been used to measure in-vivo IMCL in large skeletal muscles with uniform fiber orientation such as the soleus4. The foot contains several smaller muscles with varying fiber orientations, which yields varying relative frequency shifts5 between IMCL and extramyocellular lipids (EMCL) and poses challenges to fit the lipid MRS spectrum. In this study, diffusion tensor imaging (DTI) is used to quantify the muscle fiber orientation and provide prior knowledge in IMCL and EMCL resonance frequency. This study demonstrates the feasibility of applying multi-voxel MRS in foot muscles to quantify IMCL contents in diabetic patients. This may lead to characterizing of insulin resistance and potential early detection of the DFU formation.Methods:
Eight healthy subjects and two DFU patients were recruited for this IRB approved study. All experiments were performed on Siemens 3T magnets using standard multi-channel foot coil. T1w and T2w images of the plantar aspect of the forefoot were acquired for localization. 2D Chemical shift imaging (CSI) was performed with the following parameters: TR of 2000 ms; TE of 80 ms; matrix of 16x16; voxel size of 7.5x7.5x15 mm3; total acquisition time of 6 minutes. DTI was performed with the following parameters: TR of 2500 ms; TE of 72 ms; b-value of 800 s/mm2; 12 diffusion directions; matrix of 64x64x16; voxel size of 2x2x6 mm3; total acquisition time of 3 minutes. JMRUI was used to fit the CSI spectrum at each voxel after incorporating prior knowledge of the IMCL and EMCL relative resonance frequency shift calculated from DTI data. The ratio between intra- vs. extra- myocellular lipids (IMCL/EMCL) was estimated from the fitted CSI spectra.Results & Discussions:
The relative resonance frequency shift for IMCL and EMCL was determined under generalized Lorentzian approximation in which muscle fibers are modelled as parallel bundles of cylinders with spherical IMCL droplets within them and elongated EMCL along fiber direction between them. When muscle fiber bundles are orientated parallel to the main magnetic field B0, the relative frequency shifts are (in cgs units),
$$\left(\frac{\Delta f}{f}\right)_{IMCL}=\frac{4}{3}\pi\cdot\chi_{iso}\qquad\left(1\right)$$
$$\left(\frac{\Delta f}{f}\right)_{EMCL}=\frac{4}{3}\pi\cdot\chi_{iso}+\frac{4}{3}\pi\cdot\chi_{lipid}\qquad\left(2\right)$$
Where χiso represents the volume magnetic susceptibility of isotropically distributed susceptibility inclusions and χlipid is the volume magnetic susceptibility of lipids.
When muscle fiber bundles are oriented perpendicular to B0, the relative frequency shifts become,
$$\left(\frac{\Delta f}{f}\right)_{IMCL}=\frac{4}{3}\pi\cdot\chi_{iso}+2\pi\cdot\chi_L\qquad\left(3\right)$$
$$\left(\frac{\Delta f}{f}\right)_{EMCL}=\frac{4}{3}\pi\cdot\chi_{iso}+2\pi\cdot\chi_L-\frac{2}{3}\pi\cdot\chi_{lipid}\qquad \left(4\right)$$
Where χL represents the volume magnetic susceptibility of longitudinally orientated susceptibility inclusions. Note that the EMCL spins are confined spatially, Eq. (4) represents the mean EMCL frequency shift averaged across all possible locations with respect to a muscle fiber. The dispersion of EMCL frequency shift depends on the relative orientation of the muscle fiber.
For the general case, the resulting resonance frequency shift difference between IMCL and EMCL for fiber bundle orientation with angle θ to B0 is,
$$\left(\frac{\Delta f}{f}\right)_{IMCL}-\left(\frac{\Delta f}{f}\right)_{EMCL}=2\pi\cdot\chi_{lipid}\cos^2\theta-\frac{4}{3}\pi\cdot\chi_{lipid}=2\pi\cdot\chi_{lipid}\left(\cos^2\theta-\frac{2}{3}\right)\qquad \left(5\right)$$
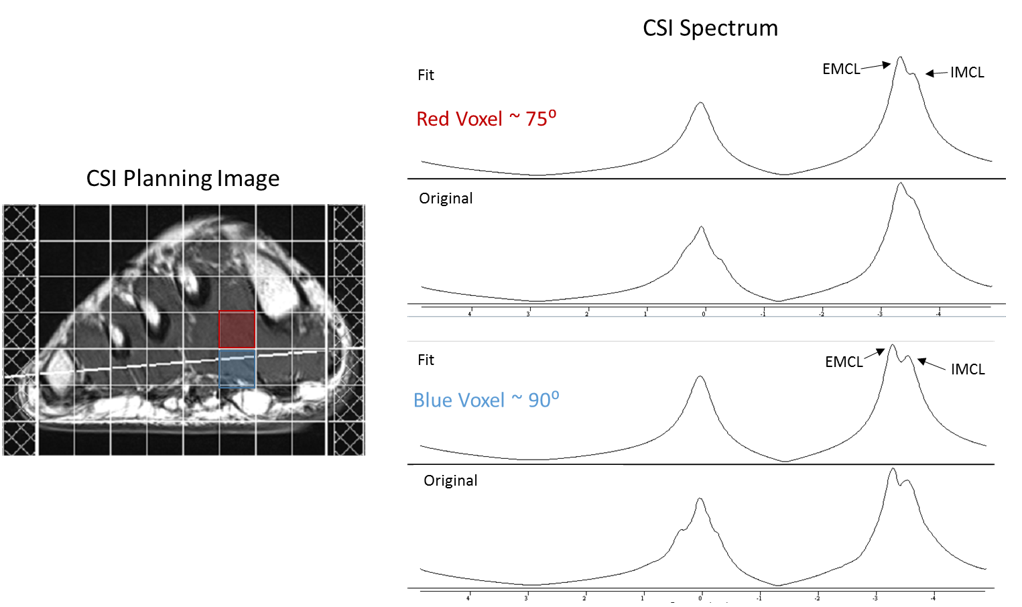
If greater than magic angle, the relative order of IMCL and EMCL peak position is switched. Although IMCL and EMCL peaks are aligned at magic angle,the two peaks can be seperated from distinctive spectral linewidth.
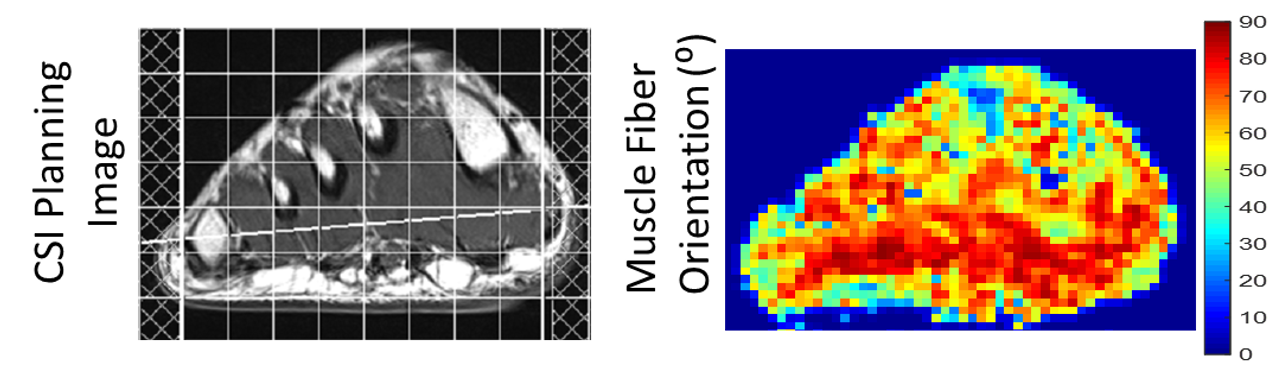
The muscle fiber bundle orientation angle (θ) was estimated based on DTI data. Fig. 1 demonstrates the varying muscle fiber bundle orientations for different foot muscle groups. Fig. 2 displays CSI results for a typical healthy volunteer. The difference in IMCL and EMCL frequency separation is present in the two displayed voxels demonstrating the need for prior information regarding muscle fiber bundle orientation to improve fitting. The estimated IMCL/EMCL ratio was 0.89 ±0.19 and 1.42±0.34 in controls and DM patients, respectively. The increased IMCL/EMCL ratio in DM patients is consistent with results obtained in calf muscles. In calf muscle, this increase has been correlated with insulin resistance. Therefore, the elevated IMCL observed in foot muscles of DM patients provides early indications of neuropathy and increased risk of DFU.
Conclusion:
This preliminary study demonstrated the feasibility of using multi-voxel MRS as a MRI biomarker of insulin resistance in DFU. This is a key imaging advance as the foot, not the calf, is the clinical location for diabetic complications. DFU patients exhibited an increased IMCL/EMCL ratio. The elevated level of IMCL/EMCL in DFU patients is consistent with the published findings from calf muscles, which has been associated with insulin resistance.Acknowledgements
No acknowledgement found.References
1. Singh N, Armstrong DG, Upsky BA. Preventing foot ulcers in patients with diabetes. JAMA 2005;293:217-228
2. Driver VR, Fabbi M, Lavery LA, Gibbons G. The costs of diabetic foot: the economic case for the limb salvage team. J Am Podiatr Med Assoc 2010;100:335-341
3. Machann, Jürgen, et al. Intramyocellular lipids and insulin resistance. Diabetes, Obesity and Metabolism 6.4 (2004): 239-248.
4. Boesch, Chris, et al. Role of proton MR for the study of muscle lipid metabolism. NMR in Biomedicine 19.7 (2006): 968-988.
5. Boesch, Chris, et al. In vivo determination of intra-myocellular lipids in human muscle by means of localized 1H-MR-spectroscopy. Magnetic Resonance in Medicine 37.4 (1997): 484-493.
Figures