5121
MRE derived stiffness of the gluteus maximus muscle: reproducibility and correlation to T2 and fat-fraction1Biomedical NMR, Eindhoven University of Technology, Eindhoven, Netherlands, 2Preclinical and Translational MRI, Academic Medical Center, Amsterdam, Netherlands, 3Biomechanics of Soft Tissues, Eindhoven University of Technology, Eindhoven, Netherlands, 4Division of Imaging Sciences & Biomedical Engineering, King's College London, London, United Kingdom, 5Radiology, Academic Medical Center, Amsterdam, Netherlands
Synopsis
Skeletal muscle pathology is often accompanied by abnormal fat deposition, fibrosis, and edema. Altered muscle biomechanical properties associated with these compositional changes can be quantitatively assessed with MRE. We present MRE measurements of the gluteus maximus muscle. In healthy volunteers, we have tested reproducibility and correlated the shear modulus Gd to T2 and fat-fraction FFdix measured using Dixon. Acceptable intra and inter reproducibility was found. Expected difference in Gd between gluteus maximus and subcutaneous fat was confirmed. Correlation plots of T2 and FFdix with Gd showed that MRE can derive biomechanical properties that potentially can provide additional information to characterize skeletal muscle pathology.
Purpose
Skeletal muscle pathology is often accompanied by abnormal fat deposition, fibrosis, and edema. Altered muscle biomechanical properties associated with these compositional changes can be quantitatively assessed with MR Elastography (MRE). In this study, we present MRE measurements of the human gluteus maximus (GLU) muscle. In healthy volunteers, we have tested reproducibility and correlated the shear modulus Gd to muscle T2 and fat fraction FFdix. Using these methods, we plan to characterize changes in the GLU muscle stiffness and composition in spinal cord injury subjects.Materials & Methods
Study design: 21 volunteers (11♂,10♀) were included and positioned prone in a 3T MRI scanner (Philips) equipped with a 45 mT/m 200T/m/s gradient and combined anterior-posterior coil (32 channels). MRE images of the right or left GLU at 48Hz were acquired with a fractionally encoded GRE MRE sequence (TE=9.2ms, TR=190ms, voxel-size 2x2x2mm3, SENSE=2, FMEG=120Hz, 8 MRE-frames, s|p|f|ref-directions) [1]. Intra-scan MRE reproducibility was tested by repeating the MRE acquisition without repositioning (Set 1 & Set 2; n=21). Inter-scan reproducibility was tested by repositioning the participant between two MRE acquisitions (Set 1 & Set 3; n=6). Fat fraction (FFdix) was quantified (n=15) with 3-point-DIXON (TE1=4.41ms, ΔTE=0.76ms, TR=210ms, voxel size 1x1x10mm3, NSA=2, SENSE=1.3). T2 quantification (n=15) was done with a multi-spin-echo sequence (TE1=8ms, ΔTE=8ms, ETL=22, TR=3000ms, voxel size 0.8x0.8x10mm3, SENSE=2, partial Fourier=70%).
Data Analysis: Mean Gd of the GLU was calculated for all 3 MRE sets and volunteers [2]. Bland-Altman analysis and coefficient of repeatability (CR) were used to assess intra and inter-reproducibility. Quantitative muscle T2-maps were calculated by fitting the data pixel-wise with a tri-exponential model to extract muscle T2 values [3]. Scatter plots of Gd vs T2 in the GLU were made to investigate correlation. FFdix was calculated using the water and fat signal from the 3-point-DIXON model [4]. Scatter plots of Gd vs FFdix in the whole buttock (GLU and subcutaneous fat) were made to investigate correlation.
Results and Discussion
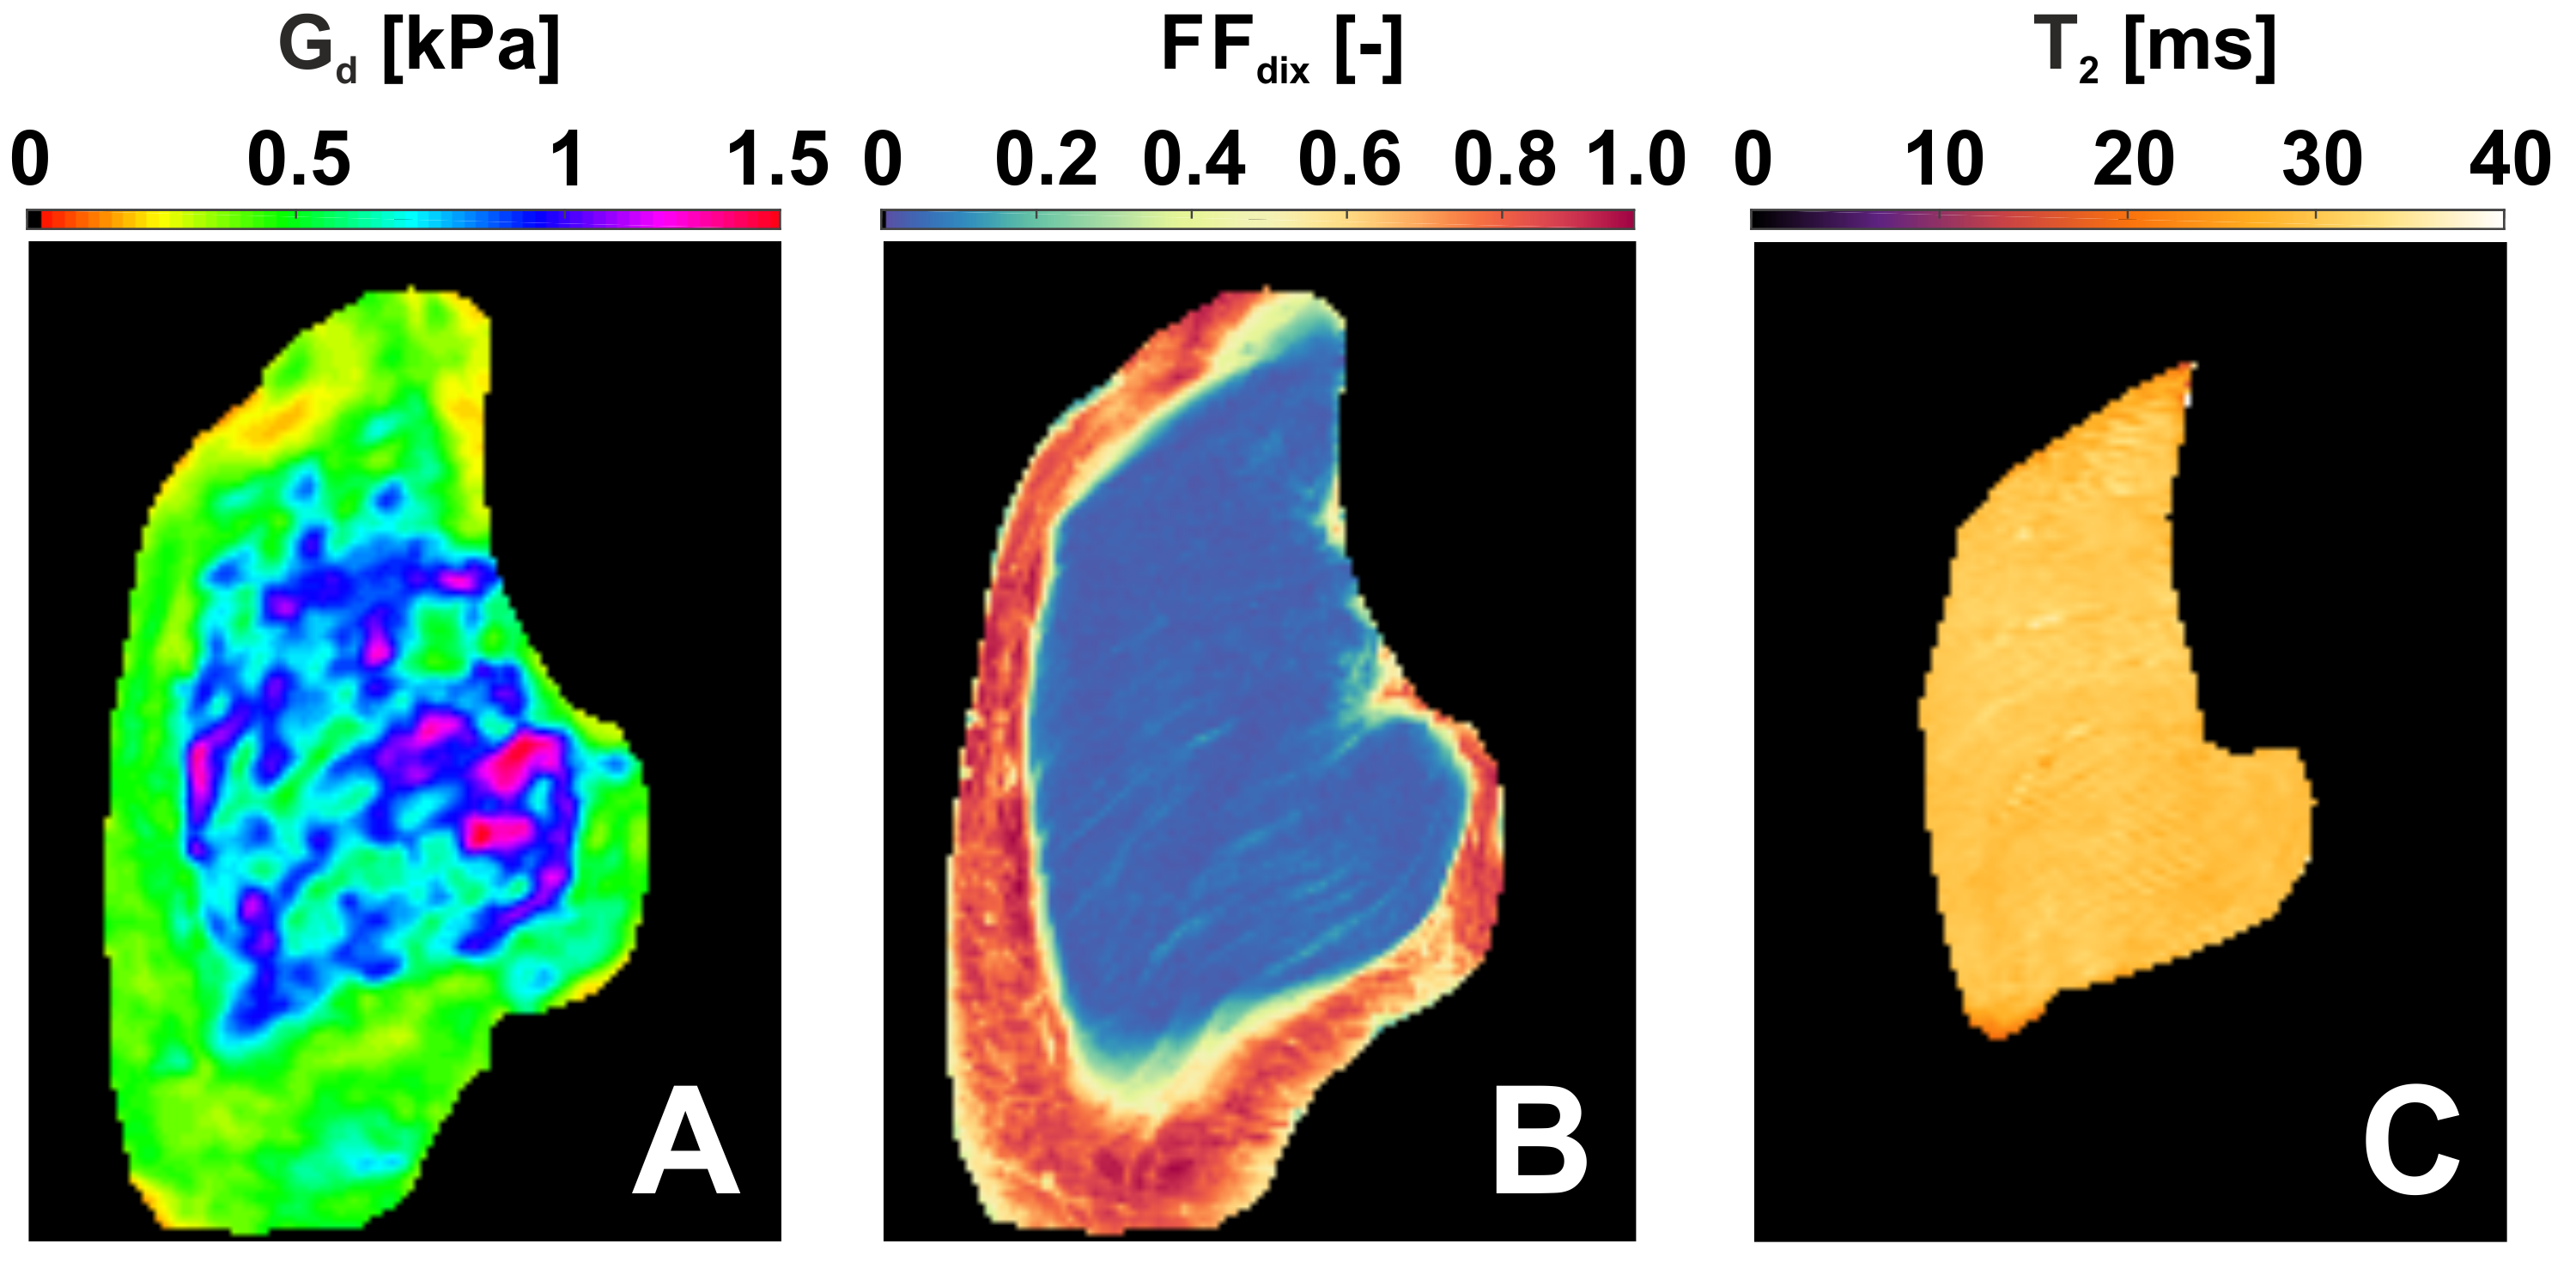
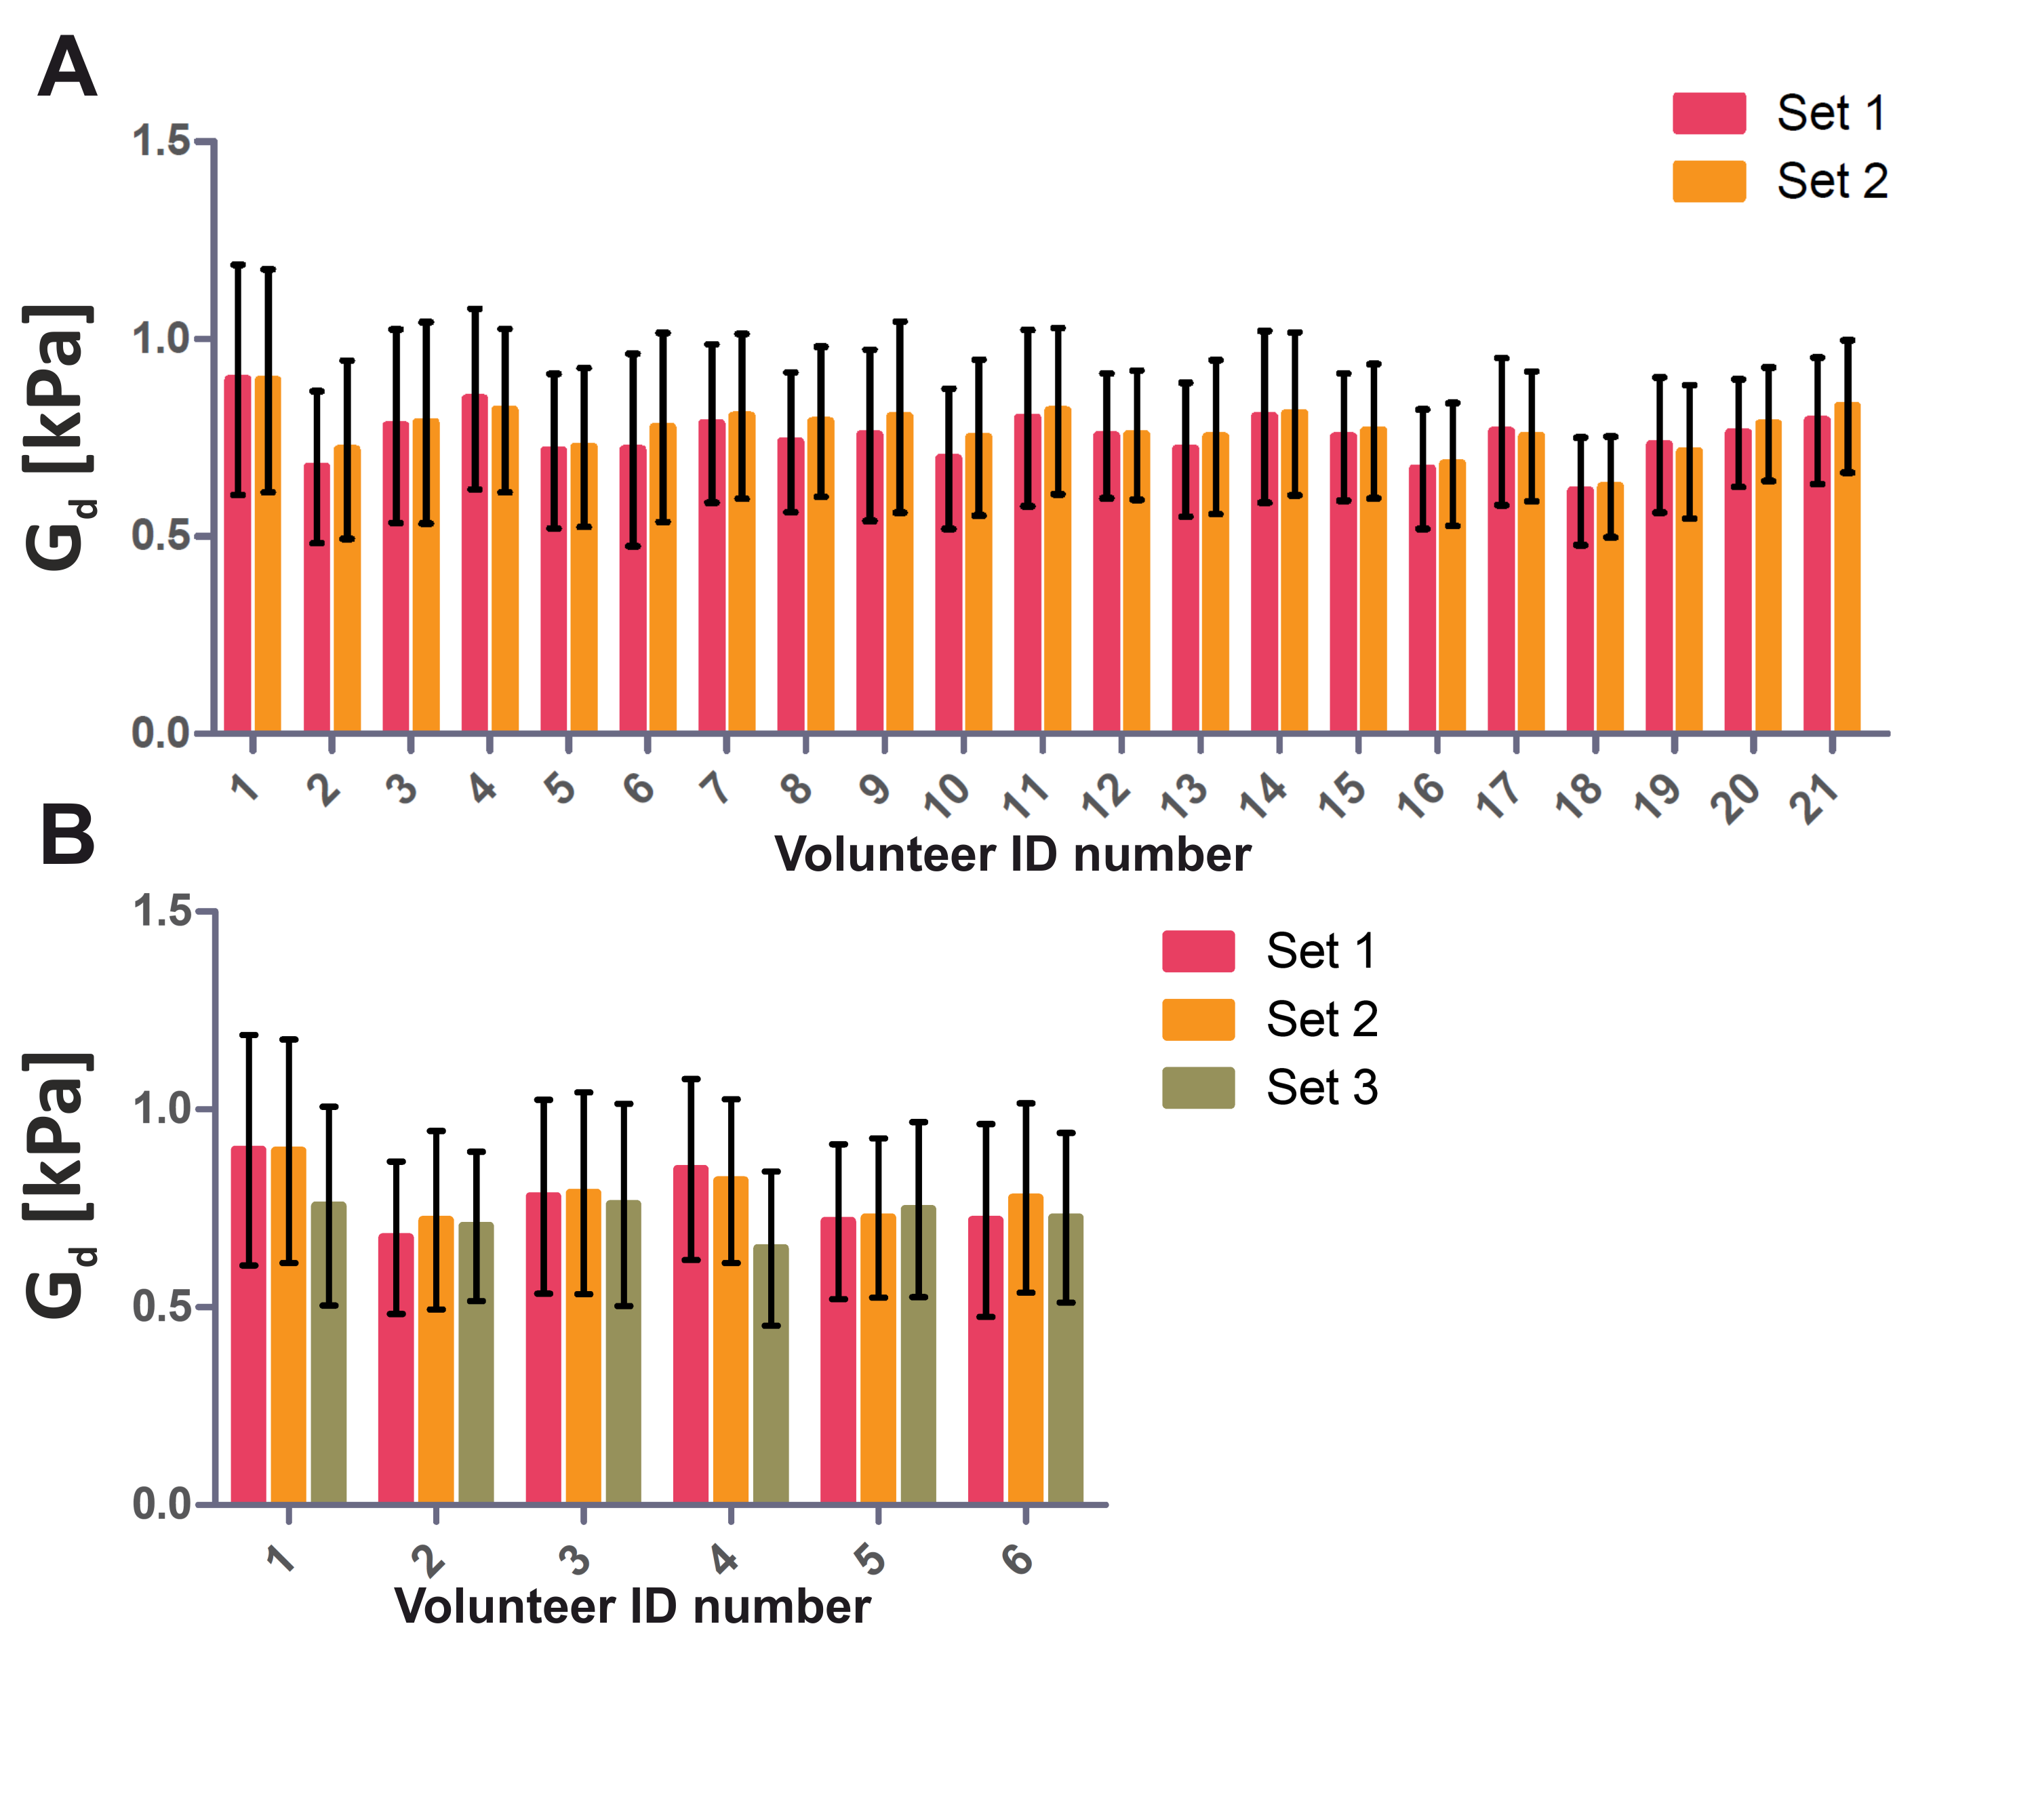
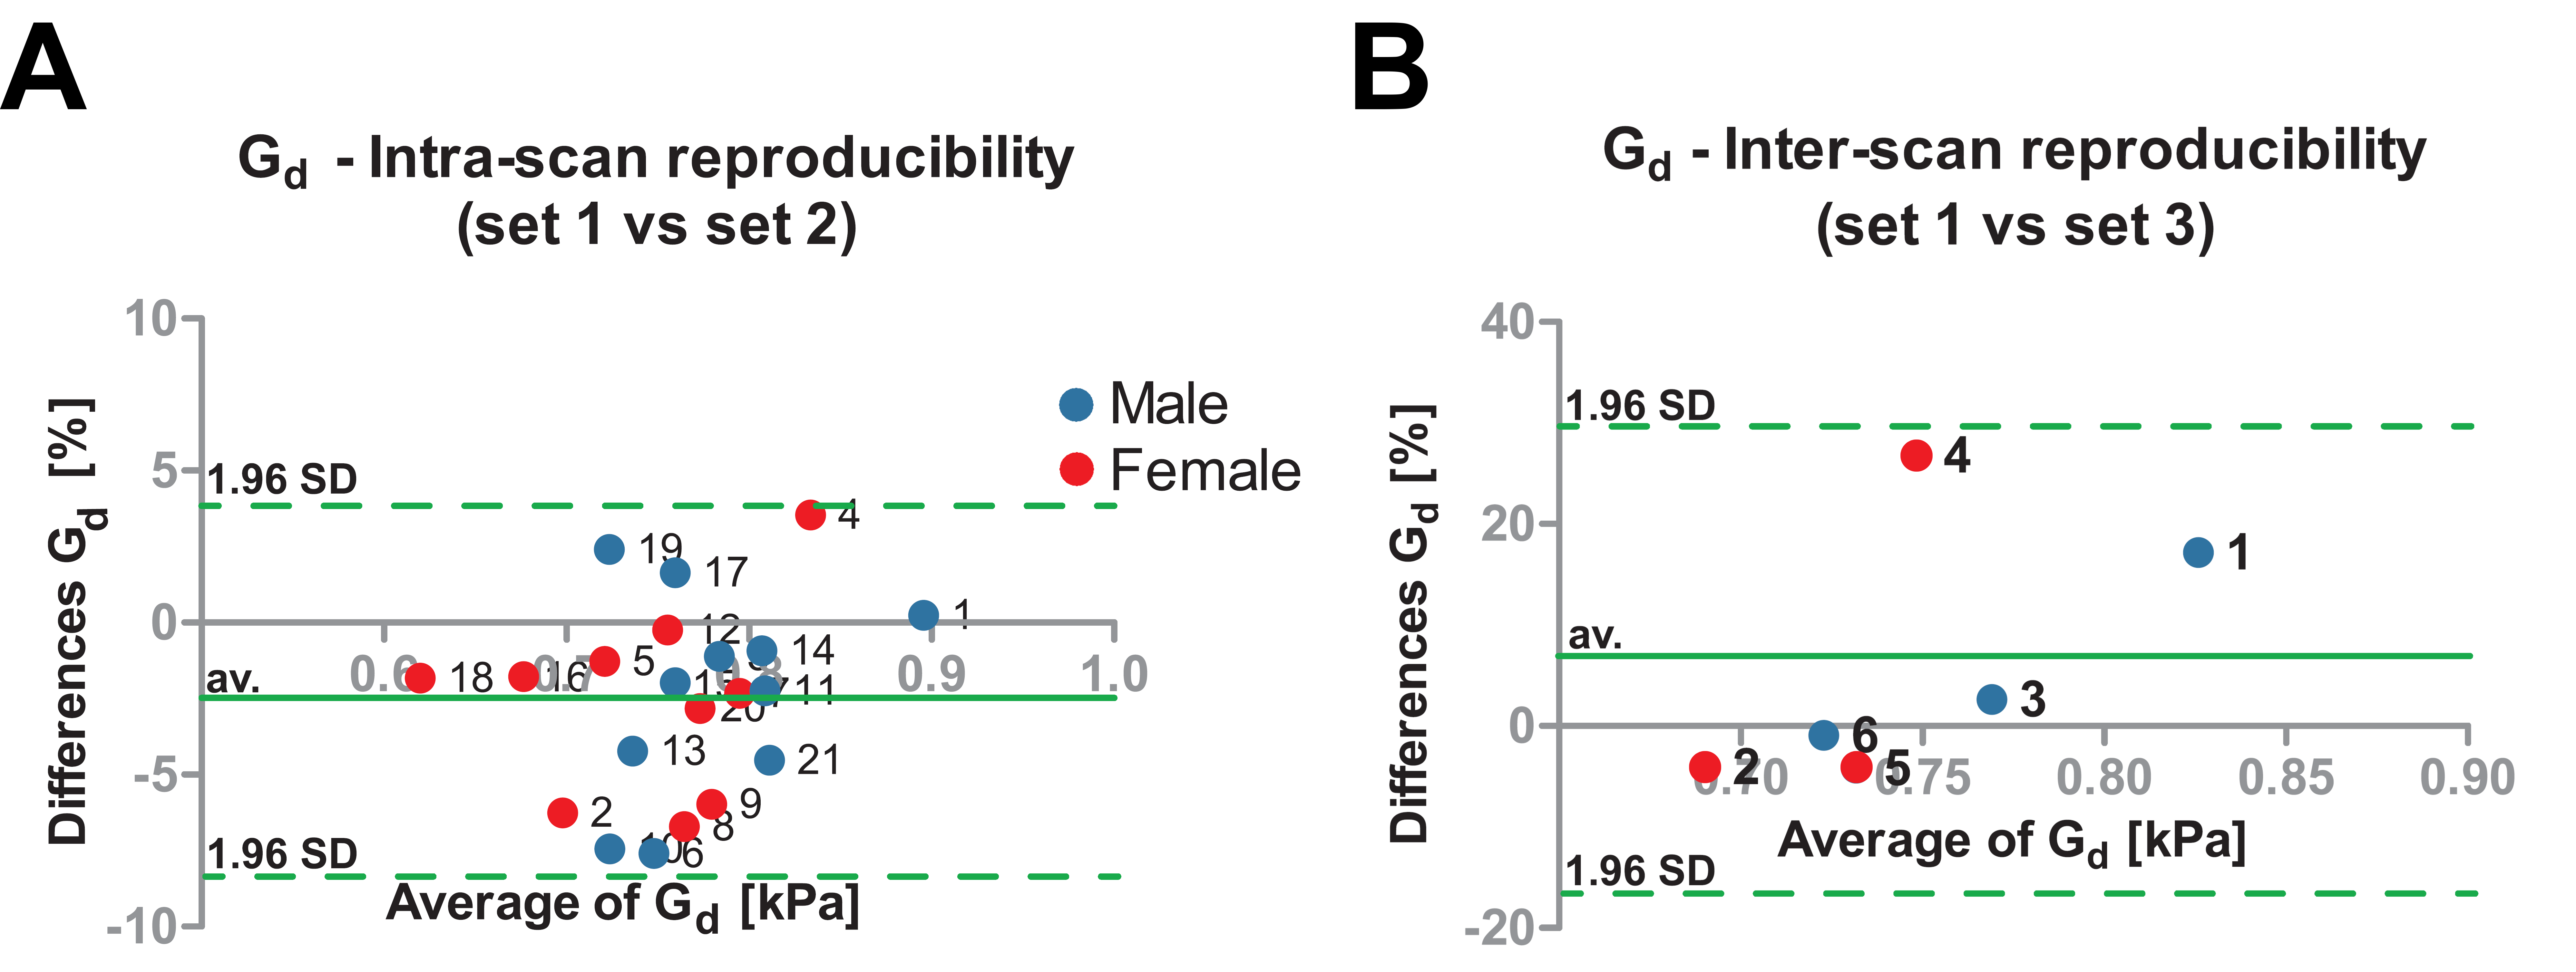
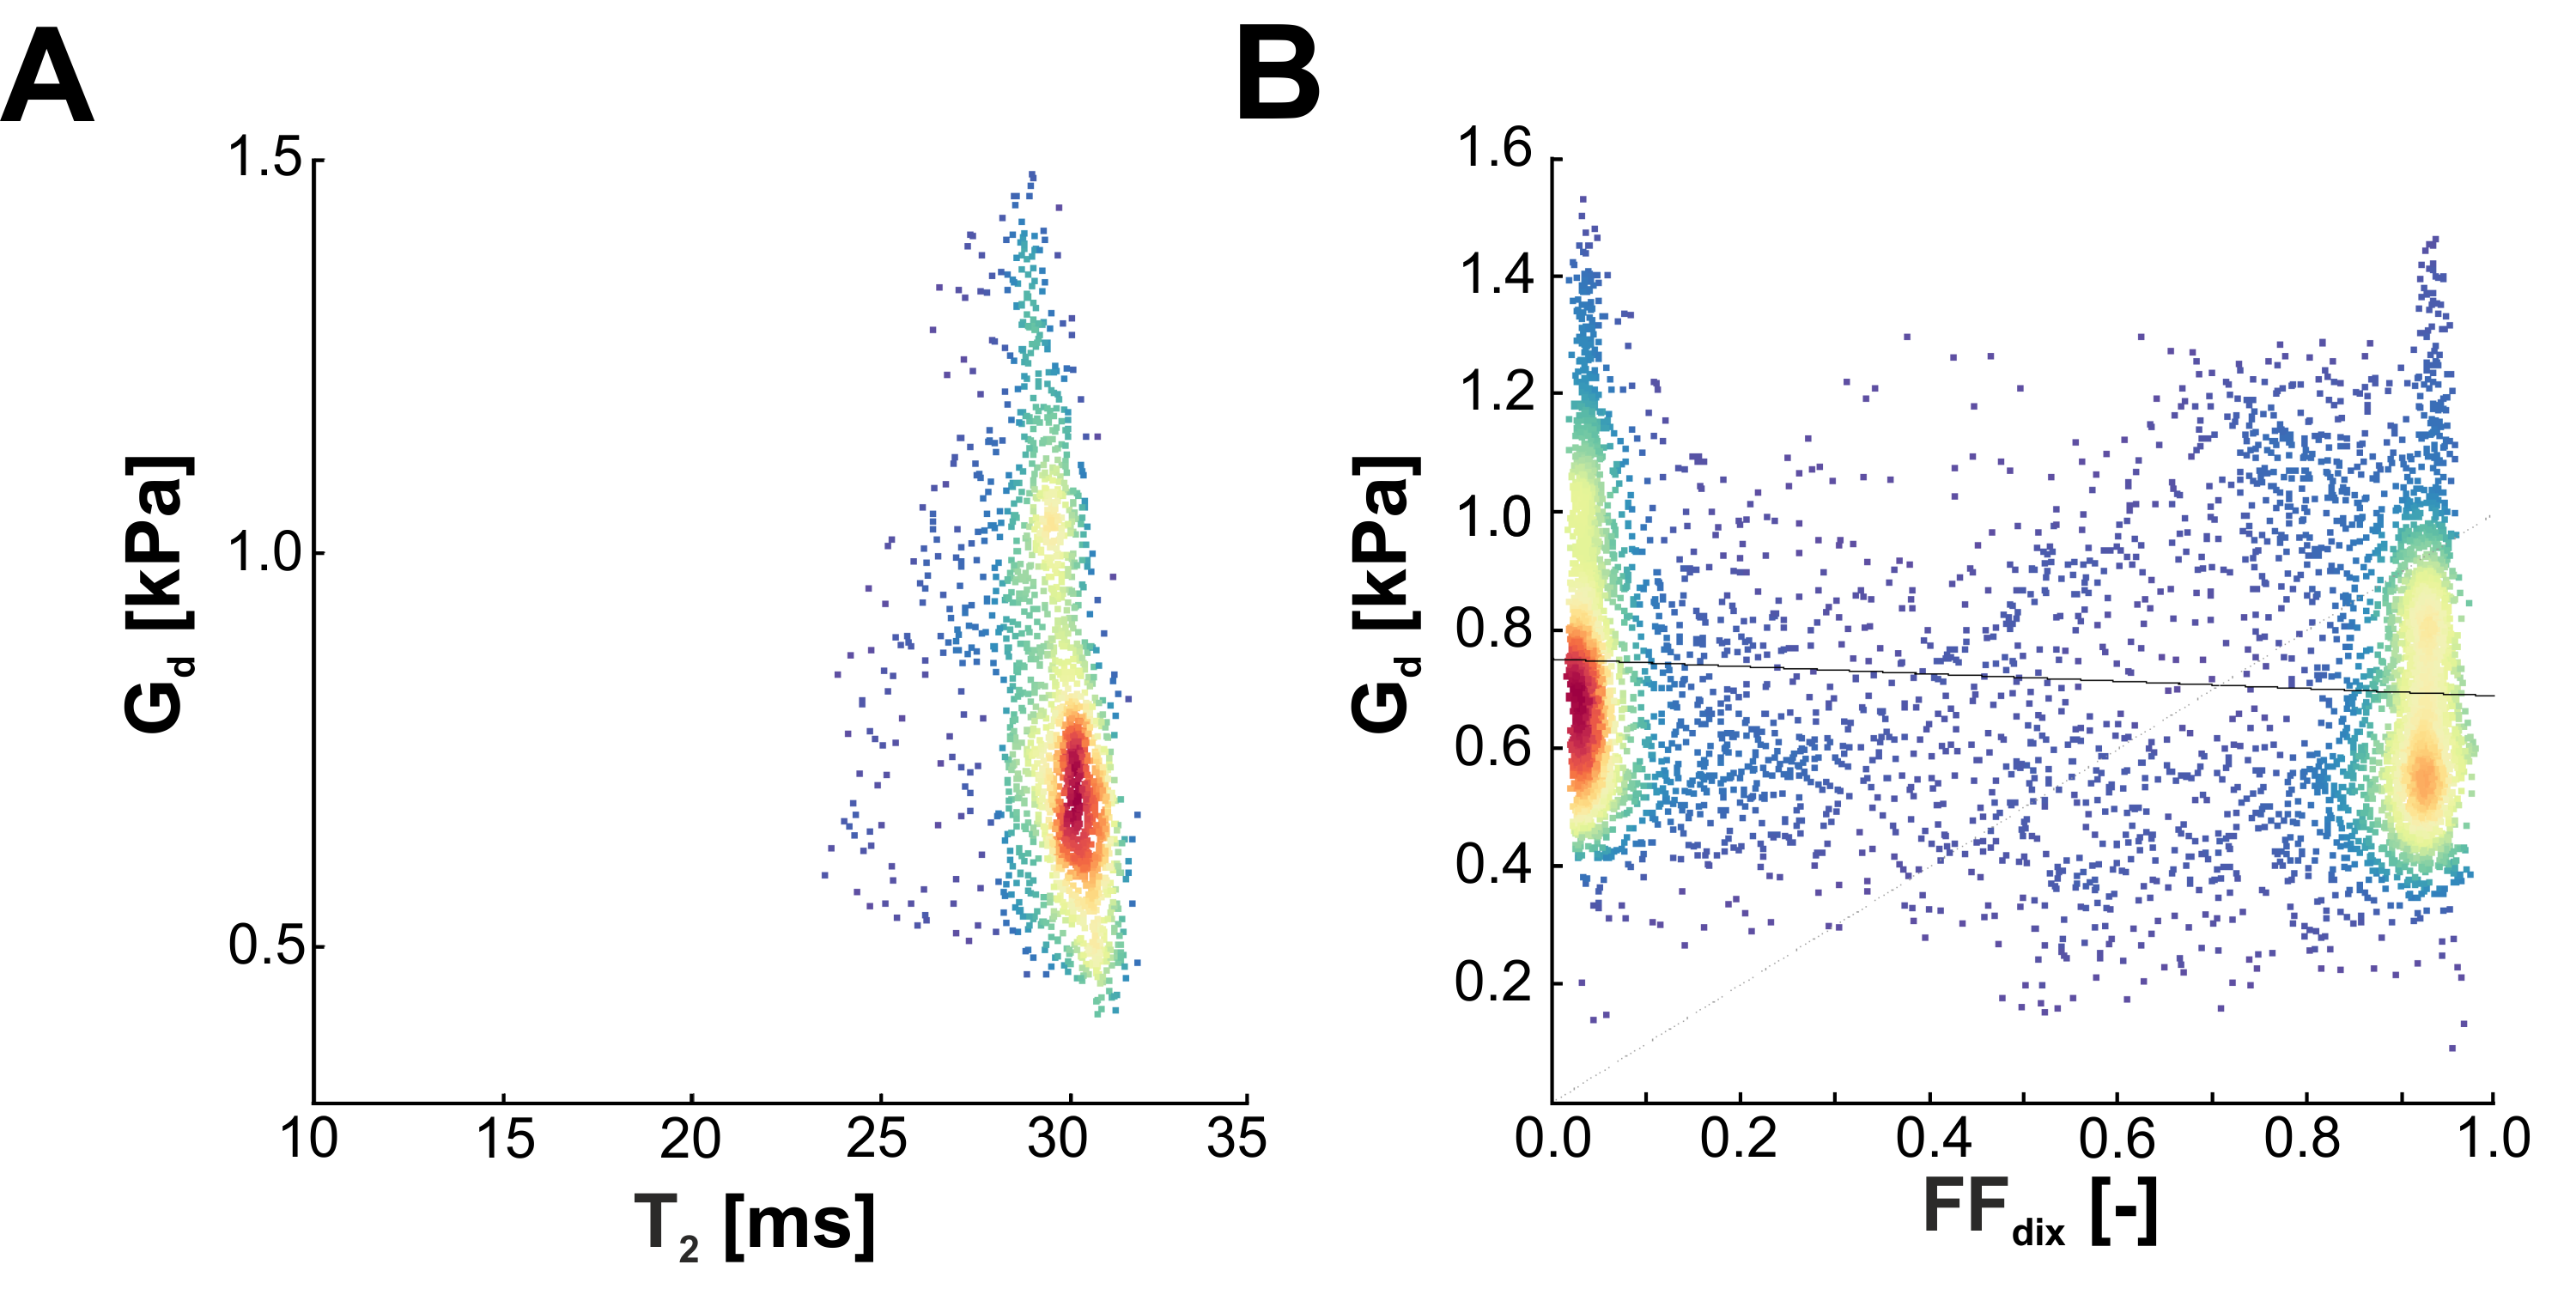
Fig. 1 shows a typical (A) MRE elastogram representing the shear modulus Gd, (B) FFdix-map and (C) muscle T2-map. On both the elastogram and FFdix-map the GLU and the surrounding subcutaneous fat can be identified. A significant difference between mean Gd of muscle (0.75kPa) and subcutaneous fat (0.59kPa) was found in the whole population. Muscle water T2 was 28±4ms. Fig. 2 shows the mean Gd of the intra (A) and inter (B) scan reproducibility in GLU per volunteer. Mean Gd value of set 1, set 2 and set 3 are 0.75±0.06kPa, 0.77±0.06kPa and 0.72 ± 0.04kPa, respectively. In Fig. 3 the Bland-Altman plots of the intra (A) and inter (B) scans are shown. Both intra and inter-scan measured differences are within the 95% confidence interval. No difference between men and women were found. The CR for intra and inter-scan were 6.2% and 25.1%, respectively. Although the inter-scan CR is considerably higher than the intra scan coefficient of repeatability, both intra and inter reproducibility are acceptable. Higher CR for the inter-scan reproducibility can be explained by difficulties in planning the exact same slice position in volunteer 1&4. Fig. 4 shows correlation plots of Gd vs FFdix and Gd vs T2. Two distinct clouds were observed in the Gd vs FFdix plot, originating from muscle and fat. In the Gd vs T2 plot a high variation in Gd was observed, which we believe reflects underlying heterogeneity in GLU muscle composition, which is not reflected in the T2 water value. In Fig. 5 (A) the correlation of Gd vs FFdix of another volunteer is shown, together with the highlighted (B) anatomical locations of four selected pixel correlation clouds (#1, #2, #3, #4). Besides fat (#3) and muscle (#1), with high and low FFdix, respectively, locations with intermediate FFdix (#2) and moderate FFdix with high Gd (#4) were found. Points in cloud #4 were located in the gluteal sulcus. The fat in the sulcus region is more organized compared to subcutaneous fat and could well explain the high Gd in this region [5]. The points of cloud #2 originated partly from the gluteal fold area, the boundary between muscle and fat and from border of the FOV. The points at the border of the FOV are probably caused by partial volume effects.
Conclusion
Acceptable intra and inter reproducibility was found. Expected difference in Gd between GLU and subcutaneous fat was confirmed. Correlation plots of muscle T2 and FFdix with Gd showed the potential of additional information which MRE derived biomechanical properties could provide to characterize skeletal muscle pathology.Acknowledgements
This research was supported by the Dutch Technology Foundation STW (NWO) and COST BM1304 MYOMRI action.References
1. Garteiser P, Sahebjavaher RS, Ter Beek LC, Salcudean S, Vilgrain V, Van Beers BE, et al. Rapid acquisition of multifrequency, multislice and multidirectional MR elastography data with a fractionally encoded gradient echo sequence. NMR Biomed. 2013;26: 1326–1335. doi:10.1002/nbm.2958
2. Sinkus R, Tanter M, Xydeas T, Catheline S, Bercoff J, Fink M. Viscoelastic shear properties of in vivo breast lesions measured by MR elastography. Magn Reson Imaging. 2005/04/19. 2005;23: 159–165. doi:10.1016/j.mri.2004.11.060
3. Azzabou N, Sousa PL de, Caldas E, Carlier PG. Validation of a generic approach to muscle water T2 determination at 3T in fat-infiltrated skeletal muscle. J Magn Reson Imaging. 2015;41: 645–53. doi:10.1002/jmri.24613
4. Dixon WT. Simple proton spectroscopic imaging. Radiology.
1984;153: 189–194. doi:10.1148/radiology.153.1.6089263
5. Illouz YG. Study of subcutaneous fat. Aesthetic Plast Surg.
1990;14: 165–77. Available: http://www.ncbi.nlm.nih.gov/pubmed/2205085
Figures