5119
Bone Imaging Using MR: Inversion Recovery Vs Tissue Segmentation1GE Healthcare, San Diego, CA, United States, 2GE Healthcare, WI, United States, 3GE Healthcare, United Kingdom
Synopsis
Many musculoskeletal tissues such as cortical bone have very short transverse relaxation times and require specialized pulse sequences such as UTE or ZTE for optimal signal acquisition. Recently, these sequences have been used to directly visualize cortical bone by suppressing surrounding long T2 tissues such as fat or muscle by either magnetization preparation using inversion recovery, or logarithmic tissue segmentation. In this work, we compare these techniques on a cadaveric bovine knee specimen. Both inversion recovery UTE as well as tissue segmented ZTE imaging proved promising method for direct bone imaging with CT-like image appearance.
Introduction
Many musculoskeletal (MSK) tissues such as cortical bone have very short transverse relaxation times and require specialized pulse sequences such as UTE or ZTE for signal acquisition. Recently, these sequences have been used to directly visualize cortical bone by suppressing surrounding signals from long T2 tissues such as fat or muscle by either using inversion recovery [1], or logarithmic tissue segmentation [2]. In this work, we compare these techniques on a cadaveric bovine knee specimen.Theory
Due to the short TE and resulting lack of T2 weighting, simple single echo UTE or ZTE images show little tissue contrast. The spin density of cortical bone is lower than that of the surrounding soft tissues, and it appears as low signal intensity on UTE/ZTE images. Inversion recovery prepared UTE on the other hand results in images that have most soft tissue signals suppressed and shows cortical bone as relatively high signal [3]. This is accomplished by using adiabatic inversion pulses that are insensitive to B1/B0 inhomogeneity and choosing the inversion time TI to coincide with the null-point of fat. Since muscle has a comparatively longer T1, these signals are suppressed by their resulting low steady state magnetization. Therefore, only the very short T2 signals from bone or tendon tissues, which do not get inverted by the IR pulse [4], contribute to the final image. ZTE is another promising approach that has been developed recently. With this technique the MR signal coming from all tissues can be segmented on a logarithmic scale to distinguish air, bone, and soft tissues. Selectively filtering out of soft tissues results in a CT-like image of cortical bone.Methods
A fresh bovine knee specimen was obtained from a local butcher and scanned on a 3T MRI scanner (GE DV750). Images were obtained in the sagittal plane using an eight channel head coil that was able to contain the whole knee joint. The UTE sequence used a 3DCones k-space acquisition. Other relevant scan parameters for both UTE and ZTE acquisitions were: FOV=26cm, matrix=256x256, #slices=150, slice-thick=1.1mm. For the IR Cones sequence the repetition and inversion times were TR=60ms, TI=28ms, respectively.Results
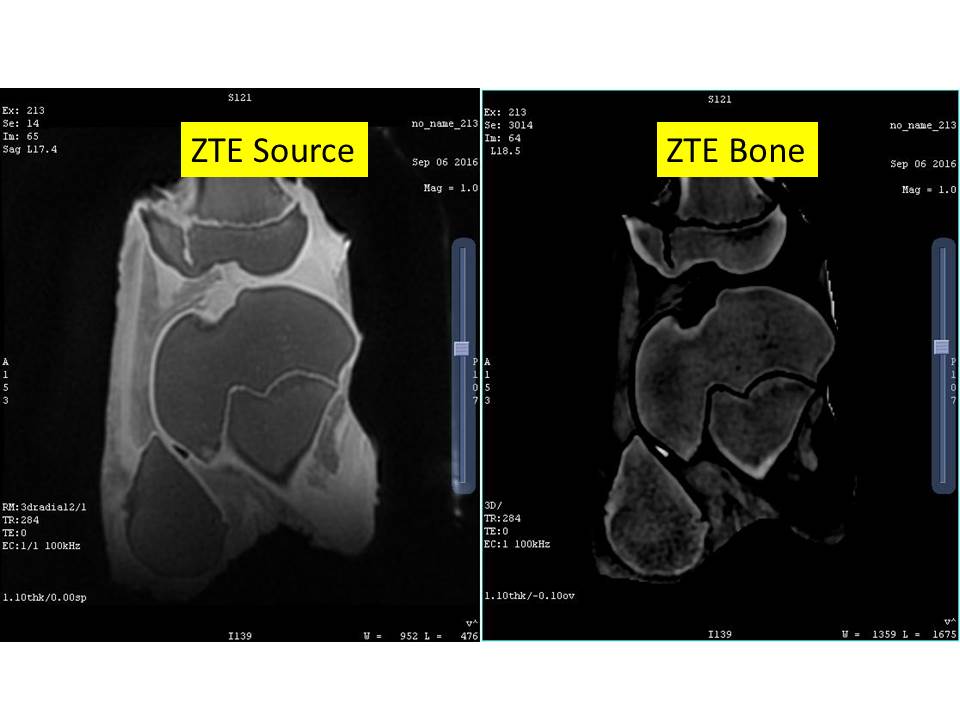
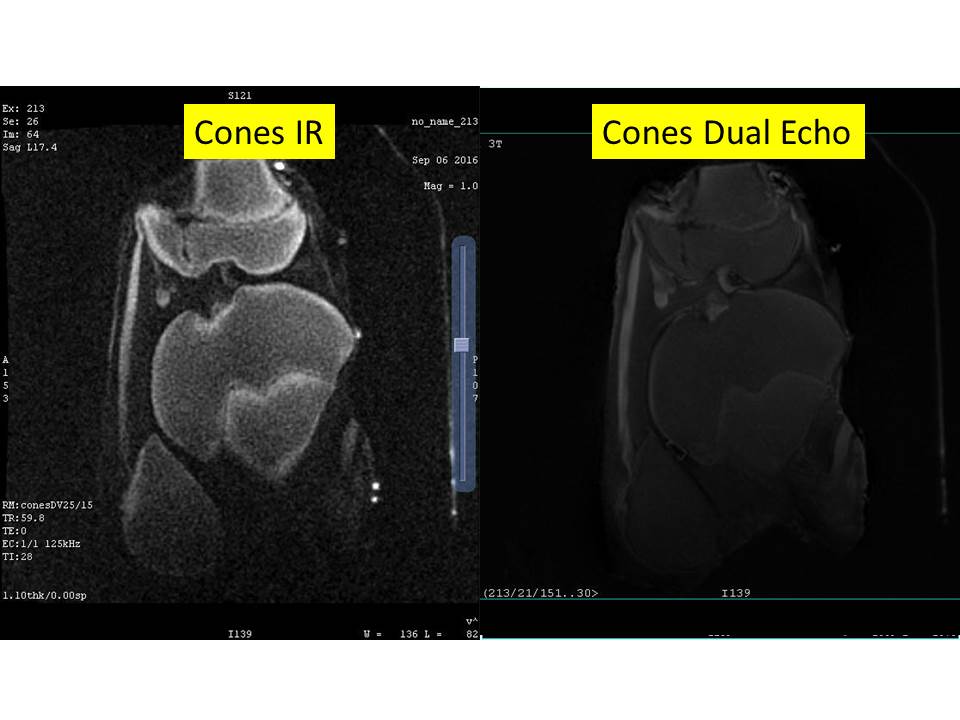
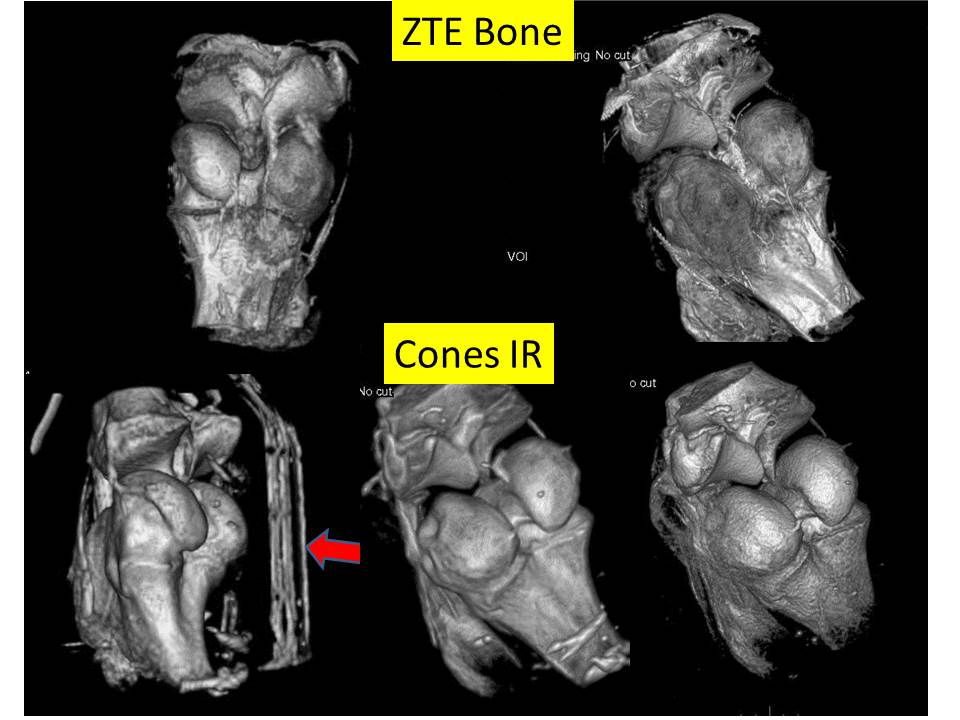
A sagittal slice of a native ZTE image and the corresponding bone segmentation are shown Fig.1. The corresponding IR UTE image is shown in Fig.2 (left). For comparison, Fig.2 also shows a dual echo subtraction image (TE2=2.2ms). Although the patella tendon is well depicted here, the cortical bone contrast is less prominent compared to the IR UTE or the segmented ZTE images. Finally, Fig.3 shows 3D rendered IR UTE (bottom row) and bone segmented ZTE (top row) images. The ZTE images include a processing step that removes out-of-volume signals such as coil elements, which can be visible in the IR UTE images (arrow).Discussion
Both inversion recovery UTE as well as tissue segmented ZTE imaging proved promising methods for direct bone imaging with CT-like image appearances. We found that ZTE has the advantage of being more SNR efficient, while IR UTE represents a more direct way without the need for additional processing steps to selectively image bone.Acknowledgements
No acknowledgement found.References
[1] Li S et al, NMR Biomed. 2015 Jan;28(1): 70–78
[2] Wiesinger Fet al, Magn Reson Med 2016 Jan;75(1):107-14
[3] Carl M et al, Magn Reson Med 2016 Aug;76(2):577-82
[4] Larson P et al, Magn Reson Med, 2007. 58(5): p. 952-61.
Figures