5118
Clinical evaluation of the fat deposition of patients with sacroiliitis by using mDIXON Quant technique1Tian Jin First Central Hospital, Tianjin, People's Republic of China, 2Philips Healthcare, Beijing, People's Republic of China
Synopsis
The study was using fat fraction (FF) to investigate the fat deposition of sacroiliitis. 3T MRI with mDIXON Quant technique was performed. All patients were divided into three groups: simple edema group, edema-fat deposition group and simple fat deposition group. The FF of both edema and fat deposition areas were obtained on FF image. The FF of edema areas was higher in edema-fat deposition group than simple edema group. The FF of fat deposition areas was higher in simple fat deposition group than edema-fat deposition group. mDIXON Quant technique could be used for assessing the situation of the disease.
Purpose
Fat deposition is frequently observed with T1-weighted magnetic resonance imaging (MRI) of the sacroiliac joints among patients with sacroiliitis. It remains unclear that which role of fat deposition plays in the chronic development of the disease. In previous studies, it has been considered as part of the reparative processes1,2, while a current study shows a positive correlation of fatty lesions and subsequent new bone formation3. So it is very important to investigate the role of fat deposition for the patients with sacroiliitis. The previous evaluation of fat deposition was depending on MRI scoring methods according to the location and range of the fatty lesions4. These scoring systems were complicated and imprecise. Over the last decade, exact fat quantification using MR mDIXON Quant technique has become available for clinical–experimental applications in liver and pancreas. The aim of study was to investigate the clinical value of mDIXON Quant technique to evaluate the fat deposition of sacroiliitis.
Methods
Sixty three patients conforming to modified New York criteria were pro-spectively collected as the SpA group, and twenty healthy volunteers were enrolled into the control group. The age of patients and healthy volunteers are all from 20 to 30 years old. The MR imaging examinations were performed with a 3.0 T MR scanner (Ingenia, Philips Healthcare, the Netherlands) by using a Torso coil. The routine MR scan and MR mDIXON Quant scan were performed. The imaging parameters for 3D MR mDIXON Quant are as follows: TR/TE=9.3ms/1.43ms, delta TE=1.3ms, flip angle=3°, the number of echo=6, slice thickness=3mm, FOV=200mm×162mm; and matrix size=224×224. A seven-peak fat spectral model was used in the calculation of fat fraction (FF). The water phase, fat phase and FF images were automatically reconstructed by the Philips system. All patients were divided into three groups according to their MR imaging appearance: simple edema group, edema-fat deposition group and simple fat deposition group (table 1). The FF of edema region and fat deposition areas were extracted from quantitative FF maps for all the patients. The FF of the first sacral interforaminal bone marrow was calculated as the FF of the normal bone marrow in both patients and healthy volunteers. Independent two sample t test was used for comparison of the FF of edema region between simple edema group and edema-fat deposition group. Independent two sample t test was also used for comparison of the FF of fat deposition region between edema-fat deposition group and simple fat deposition group. One-way ANOVA was used for comparison of the FF of first sacral interforaminal bone marrow in all the groups including both patients and volunteers.
Results
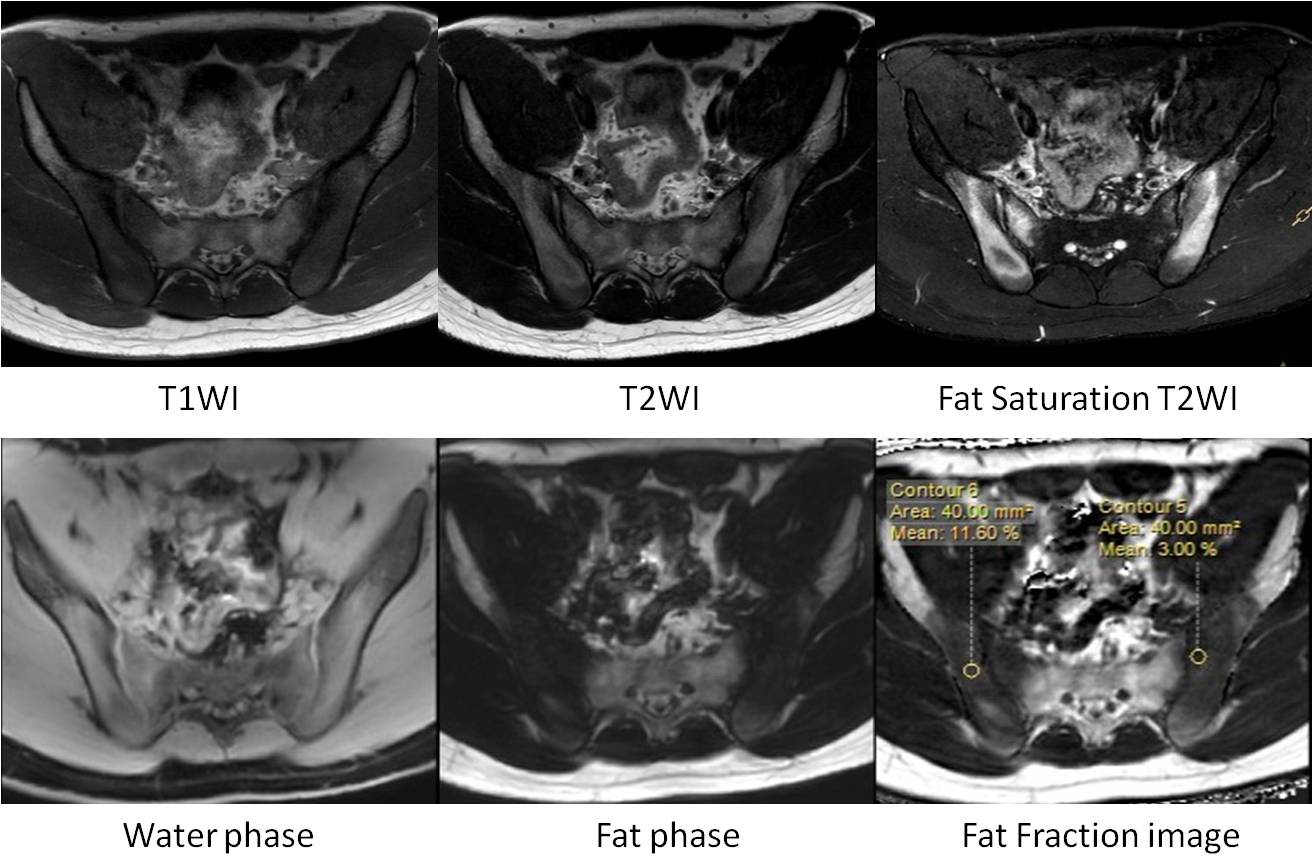
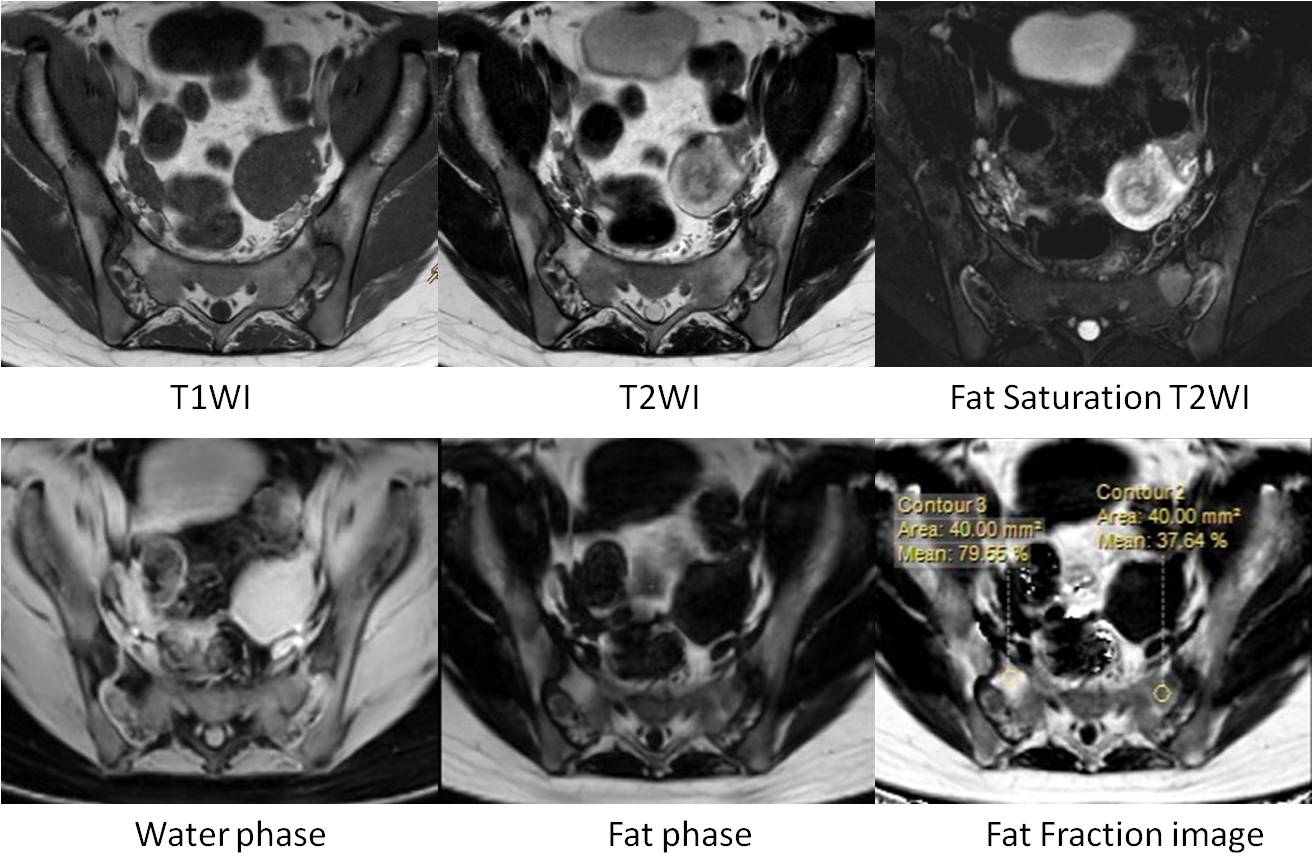
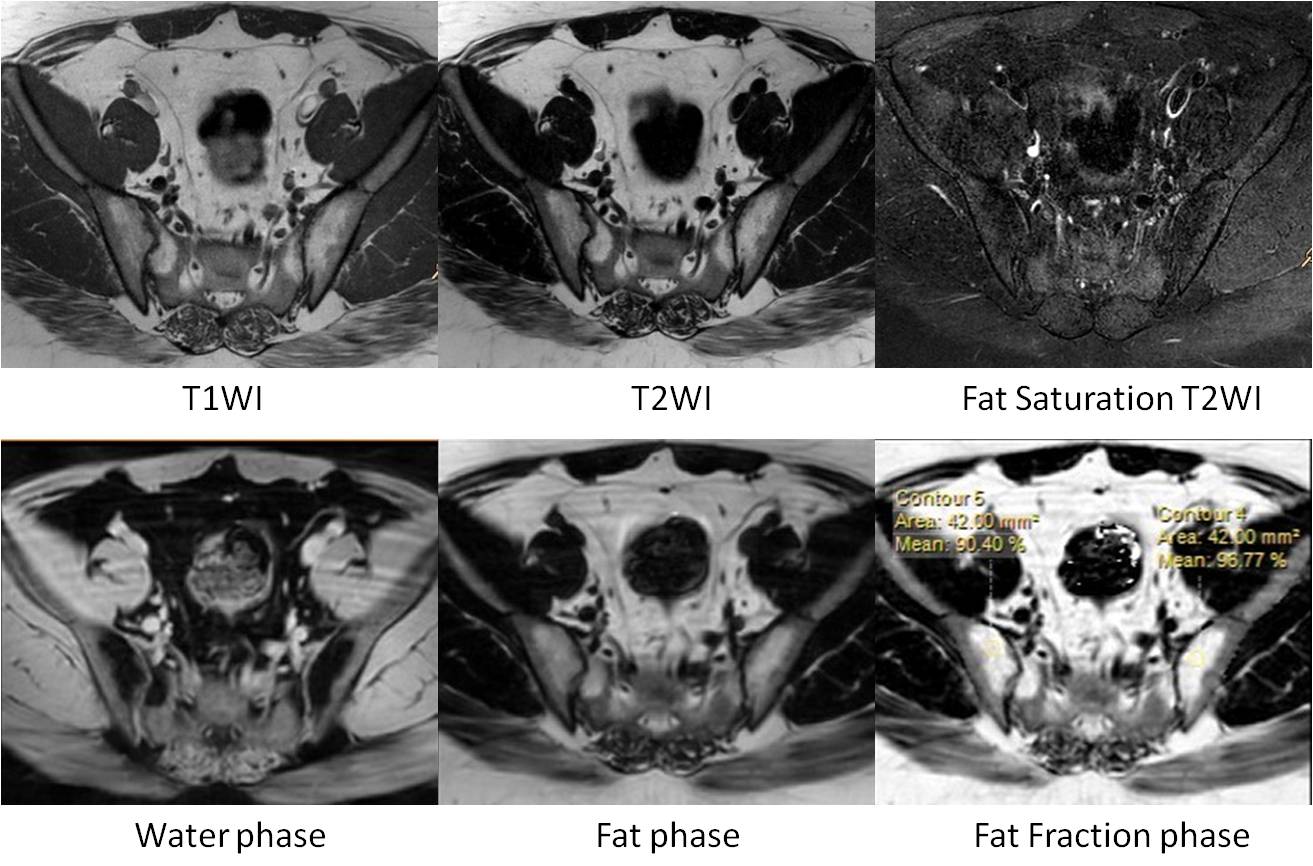
In 63 patients, 20 patients were in simple edema group, 25 patients were in edema-fat deposition group, 18 patients were in simple fat deposition group (Figure1, 2, 3). The FF of edema area within edema-fat deposition group was (30.0±10.6) %, higher than that of simple edema group which was (20.3±10.2) %, and the difference was statistically significant (t=1.141, P<0.05)(table2). The FF of fat deposition area within simple fat deposition group was (89.4±1.1) %, higher than that of edema-fat deposition group which was (81.6±1.7) %, and the difference was statistically significant (t=-4.30, P<0.001) (table2). The FF of first sacral interforaminal bone marrow within simple edema group, edema-fat deposition group, simple fat deposition group, healthy volunteers were (46.3±6.9) %, (42.8±7.4) %, (44.6±10.0) %, (47.5±5.9) % respectively, and there is no significant difference (F=1.37,P>0.05) (table2).Discussion
Fat deposition might not be detectable just with MRI T1WI (characterized with hyperintense signal) when bone edema (inflammation) is present (hypointense signal). The FF obtained with MR mDIXON Quant can monitor the change of fat deposition within the edema lesion. Fat deposition is considered as the earliest post-inflammatory changes5 and only occurs at locations those showed former subchondral bone marrow edema1. So the increase of the FF in the edema lesion indicates the attenuation of acute inflammation and the proceeding of tissue repair. There are few studies on the fat qualification of the sacroiliitis edema lesion. In our study, the FF of fat deposition area varies with the state of the disease.Conclusions
MR mDIXON Quant technique can be used to evaluate the fat deposition of sacroiliitis and the FF can effectively quantify the fat content in both bone edema area and fat deposition area. In addition, MR mDIXON Quant technique could also be used for assessing the situation of the disease.Acknowledgements
No acknowledgement found.References
1. Song I-H, Hermann KG, Haibel H, et al. Relationship between active infl ammatory lesions in the spine and sacroiliac joints and new development of chronic lesions on whole-body MRI in early axial spondyloarthritis: results of the ESTHER trial at week 48. Ann Rheum Dis. 2011;70(7):1257-1263.
2. Appel H, Sieper J. Spondyloarthritis at the crossroads of imaging, pathology, and structural damage in the era of biologics. Curr Rheumatol Rep. 2008;10(5):356-363.
3. Chiowchanwisawakit P, Lambert RGW, Conner-Spady B, et al. Focal fat lesions at vertebral corners on magnetic resonance imaging predict the development of new syndesmophytes in ankylosing spondylitis. Arthritis Rheum. 2011;63(8):2215-2225.
4. Krohn M, Braum LS, Sieper J, et al. Erosions and fatty lesions of sacroiliac joints in patients with axial spondyloarthritis: Evaluation of different MRI techniques and two scoring methods. J Rheumatol. 2014;41(3):473-480.
5. Lee SH, Lee YH, Hahn S, et al. Fat Fraction Estimation of Morphologically Normal Lumbar Vertebrae Using the Two-Point mDixon Turbo Spin-Echo MRI with Flexible Echo Times and Multipeak Spectral Model of Fat: Comparison between Cancer and Non-cancer Patients. Magn Reson Imaging. 2016;34(8):1114-1120.
Figures
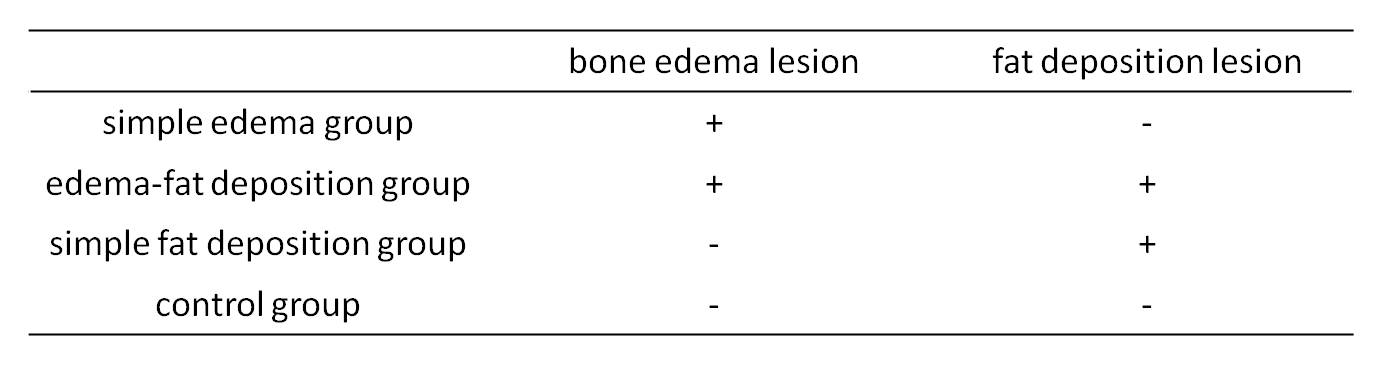
Table 1. The grouping standards