5115
Measuring fat unsaturation and polyunsaturation in vertebral bone marrow using dynamic inversion-recovery single-voxel spectroscopy1Department of Diagnostic and Interventional Radiology, Klinikum rechts der Isar, Technical University of Munich, Munich, Germany, 2Philips Healthcare, Hamburg, Germany, 3Department of Neuroradiology, Technical University of Munich, Klinikum rechts der Isar, Munich, Germany, 4Radiology and Biomedical Imaging, University of California, San Francisco, San Francisco, CA, United States
Synopsis
The assessment of vertebral bone marrow fat unsaturation is attracting growing interest for applications in bone metabolism and osteoporosis. Especially in younger subjects, the presence of a strong and broad water peak confounds the extraction of surrounding peaks (olefinic and glycerol peaks), which are used for the determination of fat unsaturation. Inversion-recovery spectroscopy allows the extraction of these peaks by differentiating the signals based on different T1 relaxation times between water and fat. The feasibility of using inversion-recovery spectroscopy was evaluated in a phantom experiment in comparison with gas chromatography and in vivo in four young and healthy volunteers.
Purpose
The assessment of vertebral bone marrow (VBM) fat unsaturation is attracting growing interest for applications in bone metabolism1 and osteoporosis2,3. Vertebral bone marrow is embedded within the cavities of the trabecular bone matrix and it is therefore characterized by broad peak linewidths. Furthermore, especially in younger subjects, the dominant water peak is preventing the extraction of the surrounding olefinic and glycerol fat peaks which are used for the estimation of mean number of double bounds (ndb) per triglyceride, mean number of methylene interrupted double bounds (nmidb) and mean fatty acid carbon chain length (CL)4. Unsaturation and polyunsaturation indices have been previously accessed in either elderly subjects using a standard STEAM sequence2 or by using a long TE PRESS sequence.5,6 Because of the shorter T2 relaxation of water compared to fat in VBM the water signal is greatly reduced if a TE of 200 ms is used5,6, but with a decreased SNR. A dynamic inversion-recovery single-voxel spectroscopy (dyn IR-MRS) sequence has been also used to measure T1 differences in adipose tissue7. The purpose of the present report was to investigate the feasibility of employing such a dyn IR-MRS sequence to quantify ndb, nmidb and CL in VBM by exploiting T1 differences between fat and water and to compare the proposed method with the previously employed5,6 long TE (=200 ms) PRESS sequence.
Methods
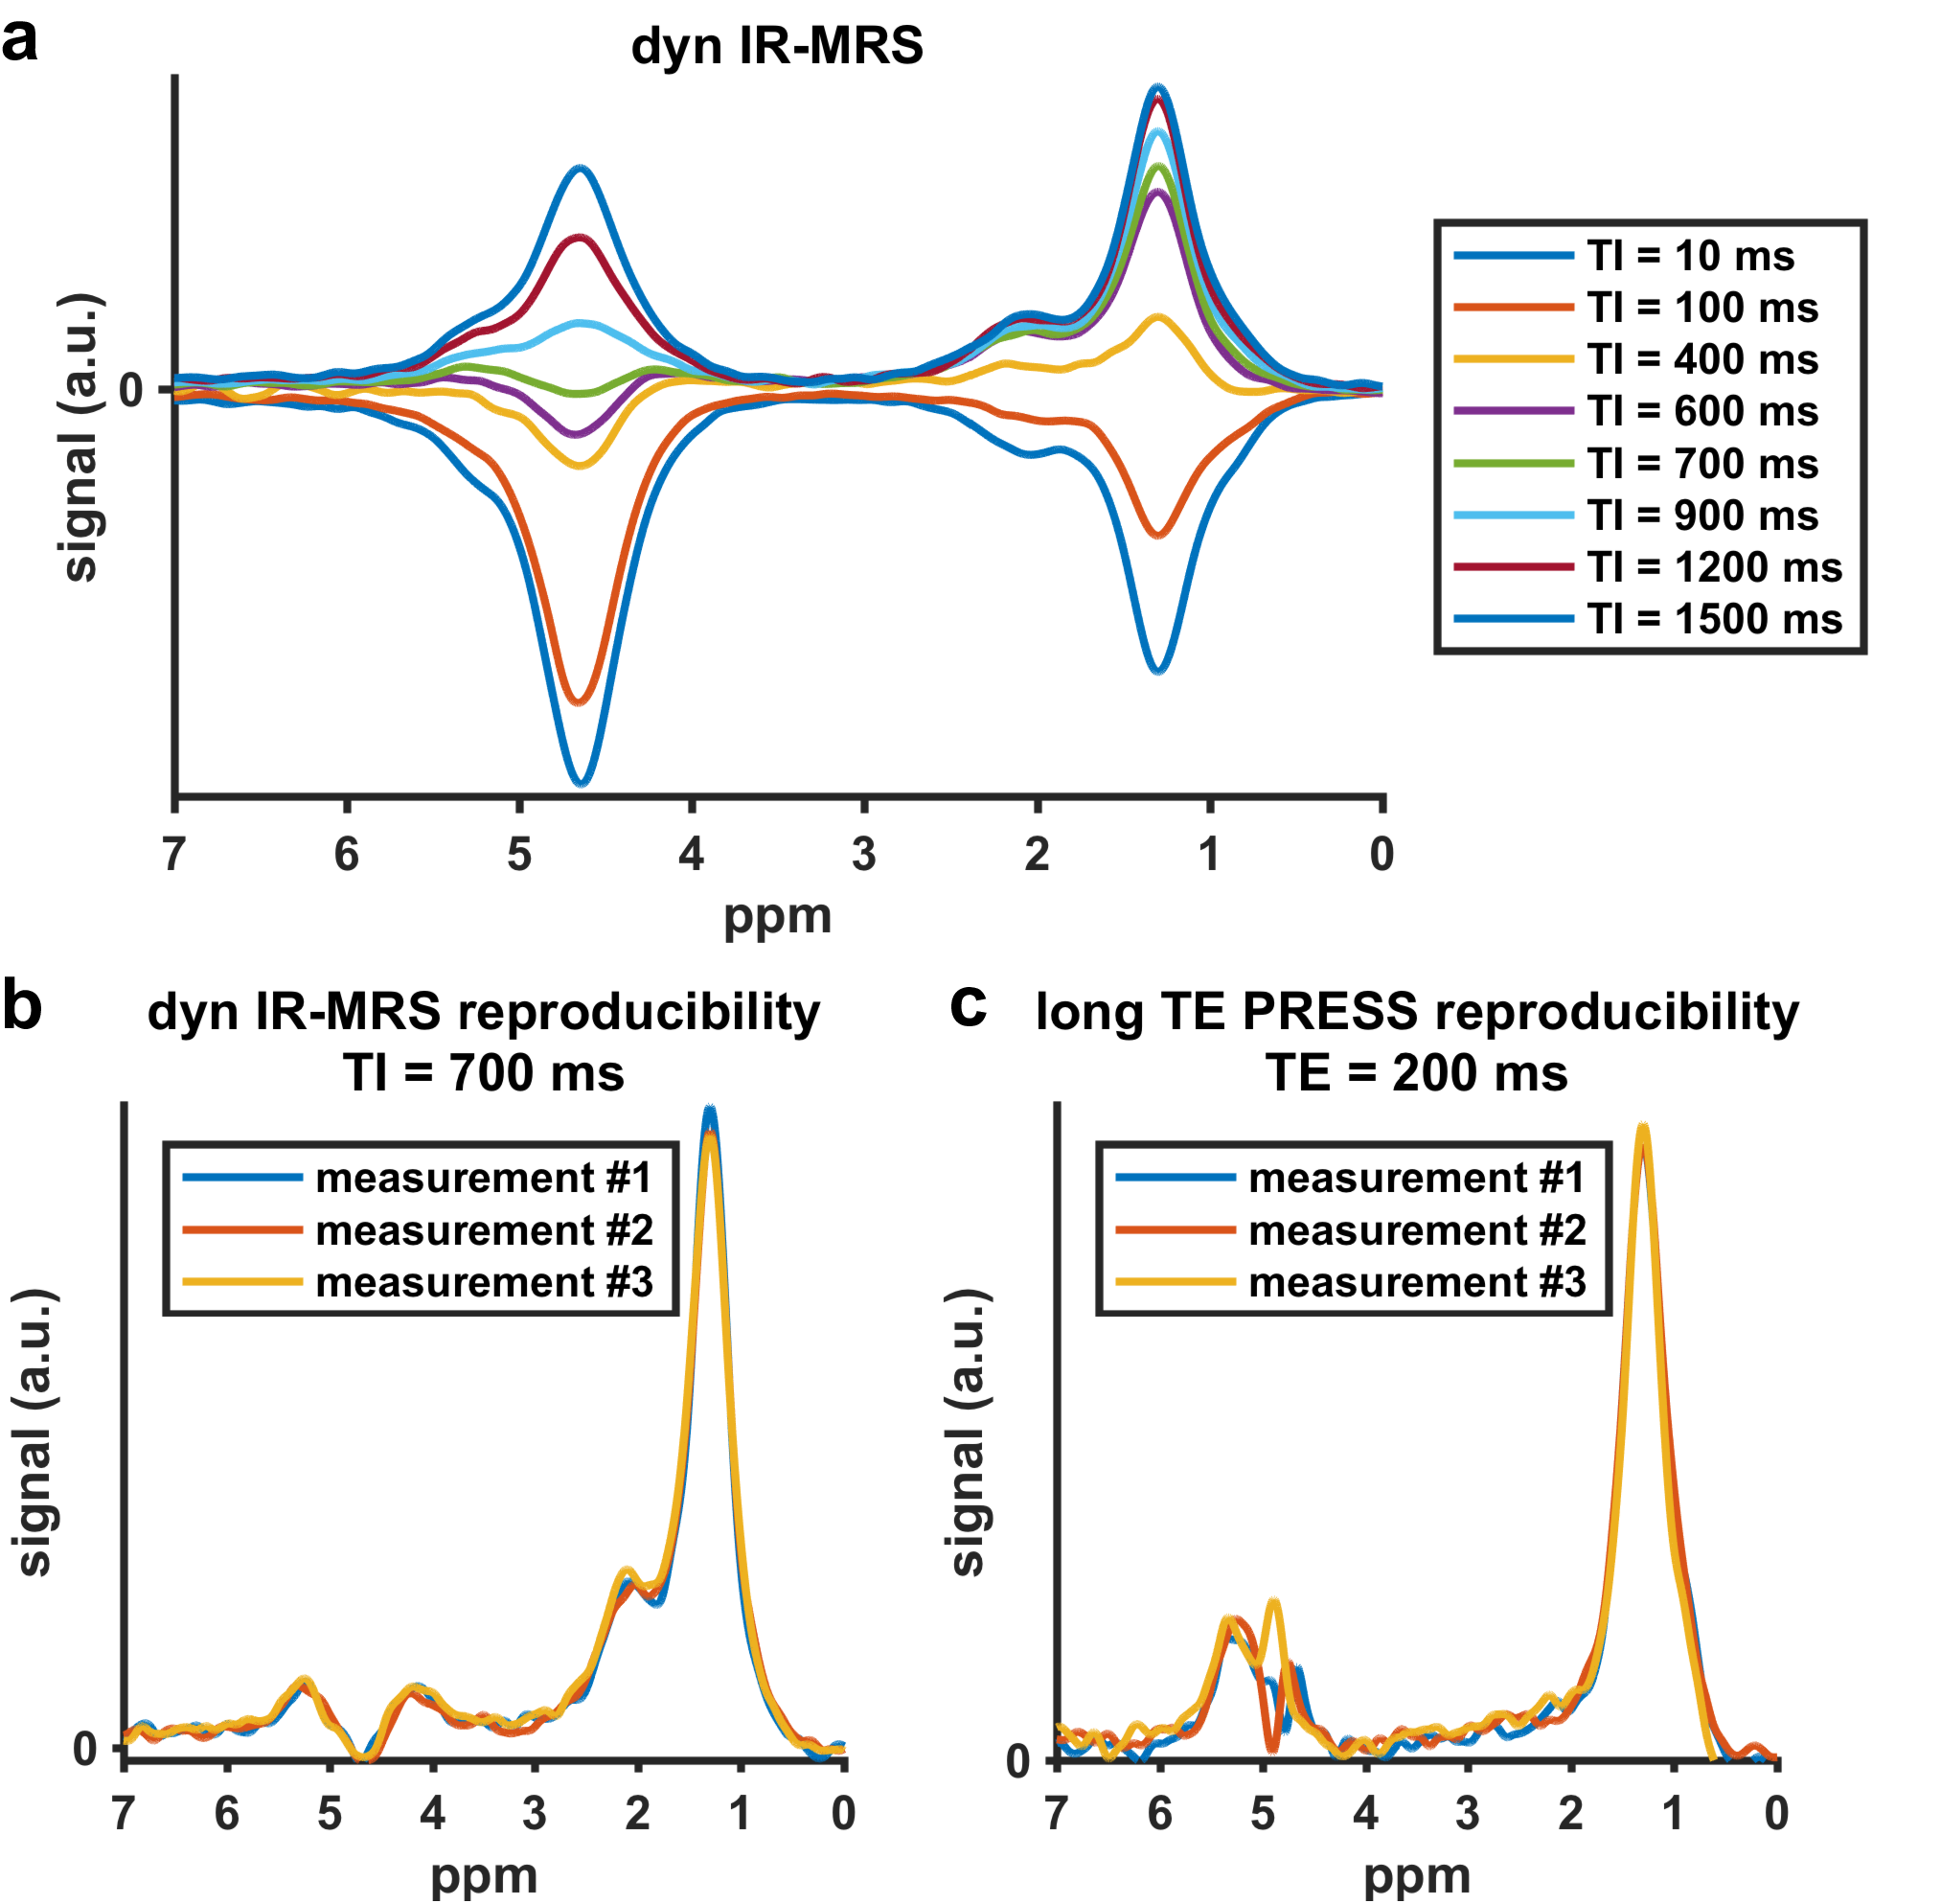
Phantom measurements: Oil phantoms containing coconut, corn, linseed, olive, walnut oils were analyzed using gas chromatography (GC) and measured using a dynamic hyperbolic secant based inversion-recovery single-voxel STEAM-MRS (dyn IR-MRS) sequence (TR=4000 ms, TE=10 ms, TM=16 ms, VOI=15x15x15 mm3, 8 averages per TI, 1 startup cycle) at eight different inversion times (TI=10/100/400/600/700/900/1200/1500 ms).
In vivo measurements: The L4 vertebra of 4 young and healthy subjects (1 female, 3 males, mean±standard deviation (SD) age = 29.8±3.5 years) was measured. The built-in-the-table posterior coil elements (12-channel array) were used for signal reception. The L4 vertebra was scanned using a dyn IR-MRS sequence (TR=4000 ms, TE=10 ms, TM=16 ms, VOI=15x15x15 mm3, 8 averages per TI, 1 startup cycle) at eight different inversion times (TI=10/100/400/600/700/900/1200/1500 ms). For comparison, a long TE single-voxel PRESS MRS sequence (TR=4000 ms, TE=200 ms, VOI=15x15x15 mm3, 80 averages) was also acquired with a matched scan time of 5:24 min. One subject was scanned three times to assess reproducibility.
All measurements were conducted on a 3 T whole-body scanner (Ingenia, Philips Healthcare, Best, Netherlands).
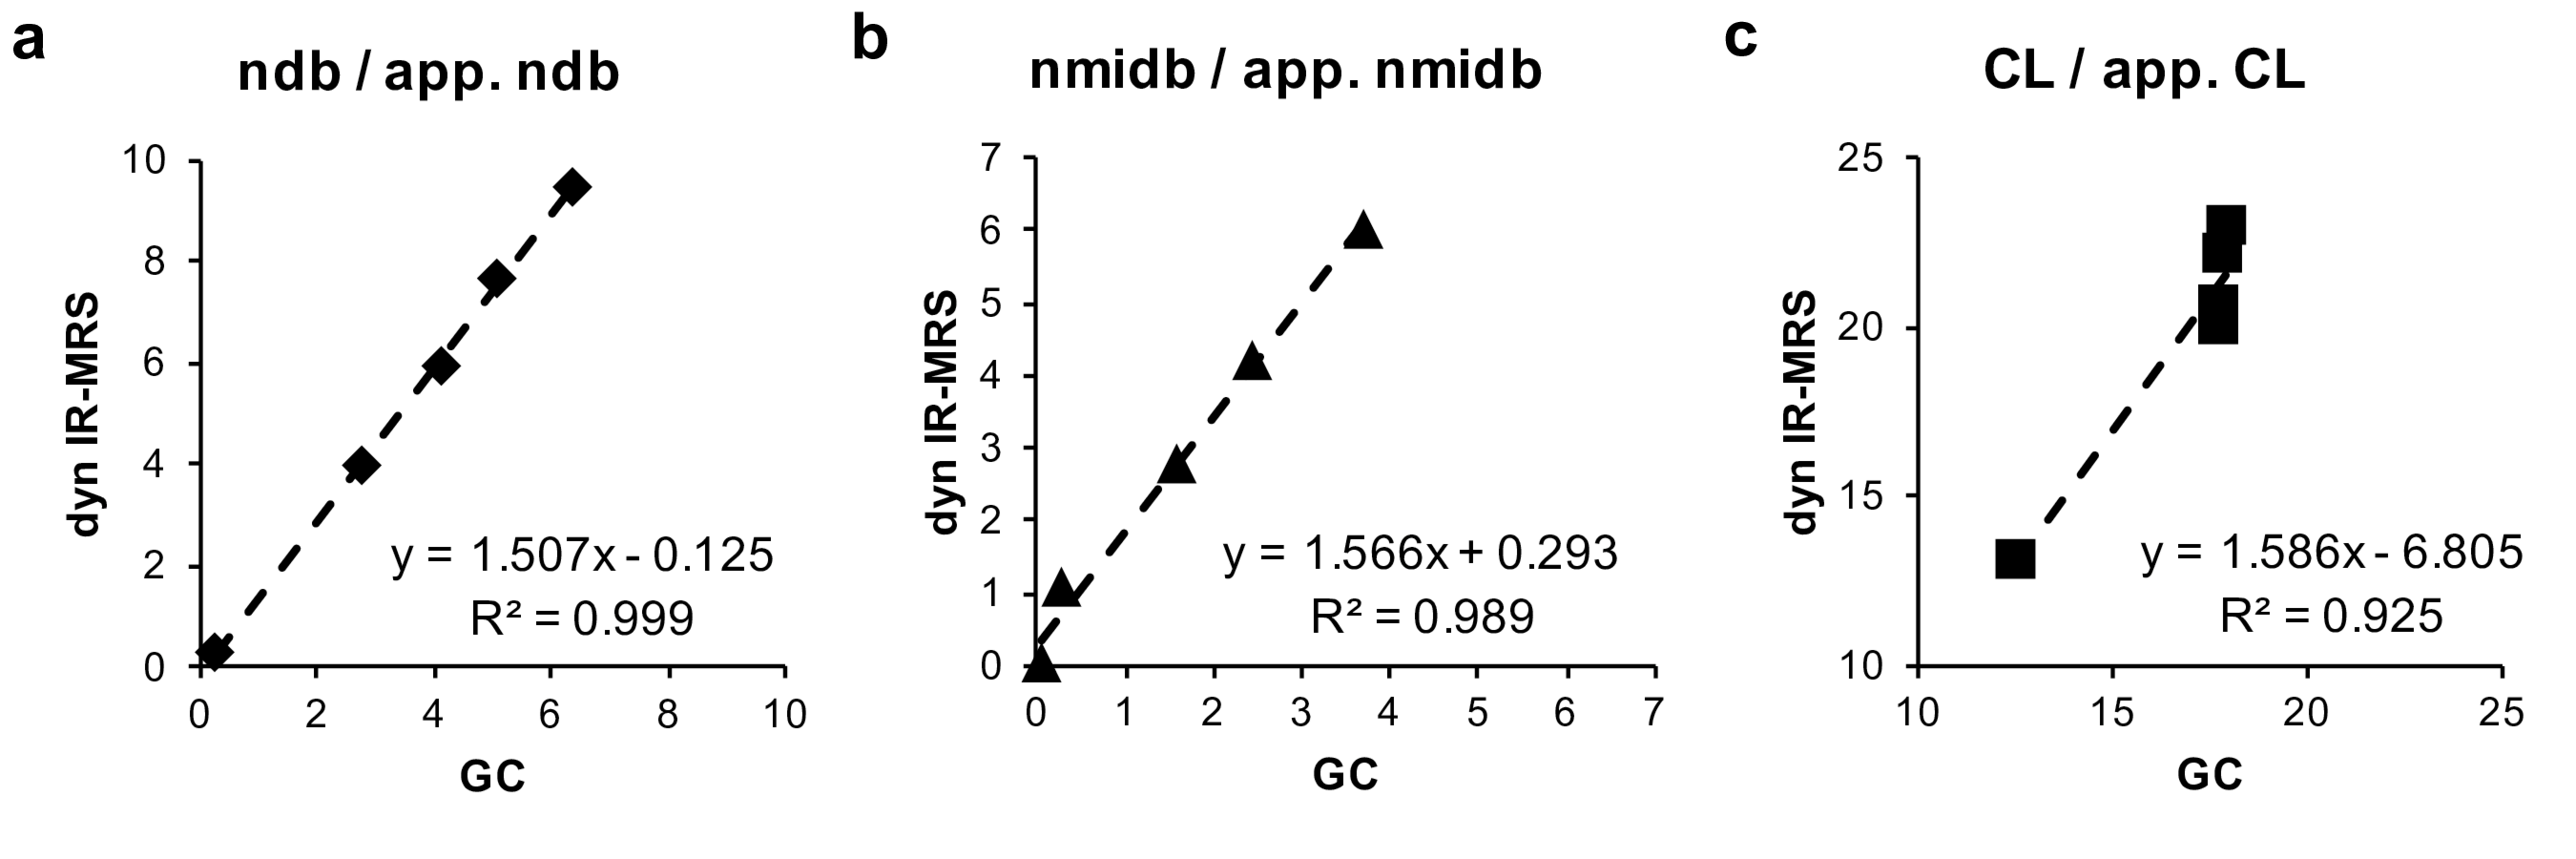
Quantification: Frequency based peak fitting was performed for the long TE PRESS measurements and a joint TI peak fitting (T1 relaxation constrained) was performed for the dyn IR-MRS measurements. Apparent (app.) ndb, nmidb and CL were calculated from the extracted peak areas4 and calibrated using the obtained correlation coefficients from the phantom measurements. Olefinic / methyl + methylene peak area (O/MM) ratios were calculated for comparison between long TE PRESS and dyn IR-MRS measurements in agreement with existing literature.5,6 In addition, Pearson’s correlation coefficient was calculated between the results measured with the dyn IR-MRS and GC.
Results
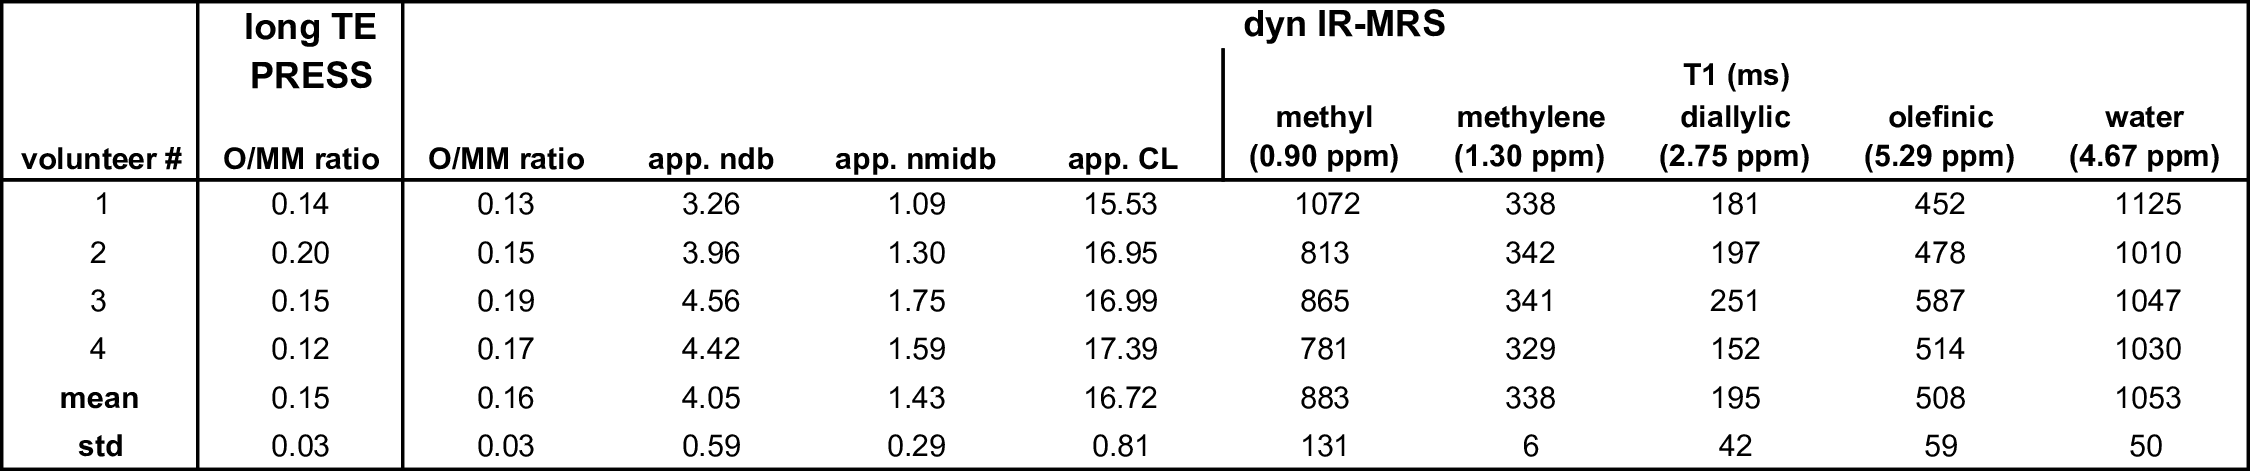
App. ndb, nmidb and CL showed a correlation coefficient and R2 of 1.5, 1.6 and 1.6, and 0.99, 0.99 and 0.93, respectively, between GC and dyn IR-MRS. (Fig. 1) An exemplary dyn IR-MRS measuring VBM is given in Fig. 2a. Measured O/MM ratio, app. ndb, nmidb and CL, as well as T1 relaxation of the methyl, methylene, diallylic, olefinic and water peak are given in Table 1. The reproducibility measurements (see spectral appearance in Fig. 2b/c) yielded a mean±SD for the O/MM ratio of 0.186±0.023 and 0.156±0.010 with a coefficient of variation (CV) of 0.13 and 0.07 for the long TE PRESS and dyn IR-MRS, respectively.Discussion & Conclusion
The reported results show that the proposed dyn IR-MRS enables the simultaneous extraction of VBM fat unsaturation and polyunsaturation and T1 relaxation values. Dyn IR-MRS showed better reproducibility and SNR performance compared to previously used long TE PRESS measuring the O/MM ratio. Furthermore, it also allows the extraction of app. ndb, nmidb and CL. The measured values for app. ndb, nmidb and CL are similar to those previously reported for bone marrow.8,9 One limitation is that the T2-weighting was corrected using the correlation coefficients from the phantom experiment and not directly measured. Extracted T1 values demonstrate the need for individual T1 modelling for each peak: e.g. mean T1 of the methyl and methylene peak in VBM were 883 and 338 ms, respectively. In conclusion, dyn IR-MRS allows the robust assessment of fat unsaturation characteristics in VBM.Acknowledgements
The present work was supported by Philips Healthcare and the European Research Council (grant agreement No 677661, ProFatMRI). The authors would like to thank Hermine Kienberger and Michael Rychlik for providing support on the gas chromatography measurements.References
1. Schwartz AV: Marrow fat and bone: review of clinical findings. Front Endocrinol 2015; 6:40.
2. Patsch JM, Li X, Baum T, et al.: Bone marrow fat composition as a novel imaging biomarker in postmenopausal women with prevalent fragility fractures. Journal of Bone and Mineral Research 2013; 28:1721–1728.
3. Yeung DKW, Griffith JF, Antonio GE, Lee FKH, Woo J, Leung PC: Osteoporosis is associated with increased marrow fat content and decreased marrow fat unsaturation: a proton MR spectroscopy study. J Magn Reson Imaging 2005; 22:285.
4. Hamilton G, Hamilton G, Yokoo T, et al.: In vivo characterization of the liver fat ¹H MR spectrum. NMR in Biomedicine 2011; 24:784–790.
5. Troitskaia A, Fallone BG, Yahya A: Long echo time proton magnetic resonance spectroscopy for estimating relative measures of lipid unsaturation at 3 T. Journal of Magnetic Resonance Imaging 2013; 37:944–949.
6. Bingölbali A, Fallone BG, Yahya A: Comparison of optimized long echo time STEAM and PRESS proton MR spectroscopy of lipid olefinic protons at 3 Tesla. Journal of Magnetic Resonance Imaging 2015; 41:481–486.
7. Hamilton G, Smith DL, Bydder M, Nayak KS, Hu HH: MR properties of brown and white adipose tissues. Journal of Magnetic Resonance Imaging 2011; 34:468–473.
8. Ren J, Dimitrov I, Sherry AD, Malloy CR: Composition of adipose tissue and marrow fat in humans by 1H NMR at 7 Tesla. J Lipid Res 2008; 49:2055–2062.
9. Bydder M, Bydder M, Girard O, Hamilton G, Hamilton G: Mapping the double bonds in triglycerides. Magn Reson Imaging 2011; 29:1041–1046.
Figures