5114
Subregional variation in proximal femoral bone marrow fat composition assessed at 3T1Department of Radiology, New York University School of Medicine, Bernard and Irene Schwartz Center for Biomedical Imaging, New York City, NY, United States, 2Université de Lyon; CREATIS CNRS UMR 5220, Inserm U1206, INSA-Lyon, UCBL Lyon 1, Villeurbanne, France
Synopsis
Recent studies have shown skeletal variation of bone marrow adipose tissue (bMAT) and its role in bone remodeling. Our aim was to assess the variation in bMAT composition in five regions within the proximal femur in both controls and OP patients using a chemical shift encoded (CSE) imaging technique.
Introduction
Bone marrow adipose tissue (bMAT) plays an important role in the pathophysiology of osteoporosis (OP). In the setting of OP, a disease of low bone mass and increased fracture risk, recent studies have shown that bMAT is increased in the femur [Griffith, Yeung] and that there is also reduced unsaturated lipid in the lumbar spine and femoral neck1,2. Changes in bMAT distribution have been described mainly in femoral head3 and its composition has been studied through mono-voxel magnetic resonance spectroscopy mainly in the femoral head. Other studies have shown skeletal variation of bMAT and its role in bone remodeling4. Our aim was to assess the variation in bMAT composition in five regions within the proximal femur in both controls and OP patients using a chemical shift encoded (CSE) imaging technique.Methods
This study had institutional review board approval and we obtained written informed consent from all subjects. MR acquisitions were performed on a Siemens Magnetom Prisma 3.0T system (Siemens Erlangen, Germany) using a 3D spoiled gradient echo sequence with flyback readout gradients. A total of n=12 echoes were acquired (n×1.2). TR/FA = 16ms/5° and BW= 2000 Hz/px. 32 coronal slices of both hips of a subject were acquired in a given scan time of ~ 4min. Images were post-processed according to the method by Leporq et al5. Fat and water only images, PDFF, T2*, saturated (SFA), monounsaturated (MUFA) and polyunsaturated (PUFA) parametric maps were obtained. An active contour was used for segmentation of femoral bone using dual contrast obtained by fat and water only images. Using PDFF information, separation of bMAT in term of constitutive (cMAT) and regulated (rMAT) was achieved. This method was evaluated on healthy controls (n=7, 25.75 +/- 3.58y) and osteoporotic patients (n=6, 58.4 ± 5.6y). Five regions of interest (ROI) were drawn in the proximal femur (femoral head, neck, great trochanter, wards triangle, shaft) and an additional ROI was drawn in the subcutaneous white adipose tissue (sWAT) in the upper hip leg and used to integrate value in the parametric maps. Comparisons were performed using a two-tailed student t-test. Significance was assumed for a p-value smaller than 5%.Results
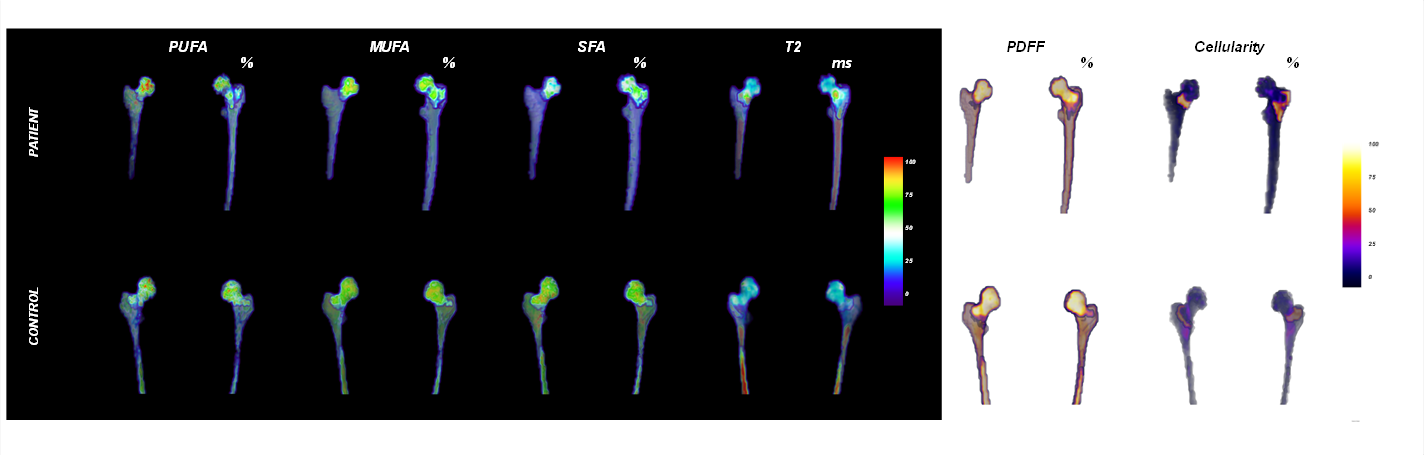
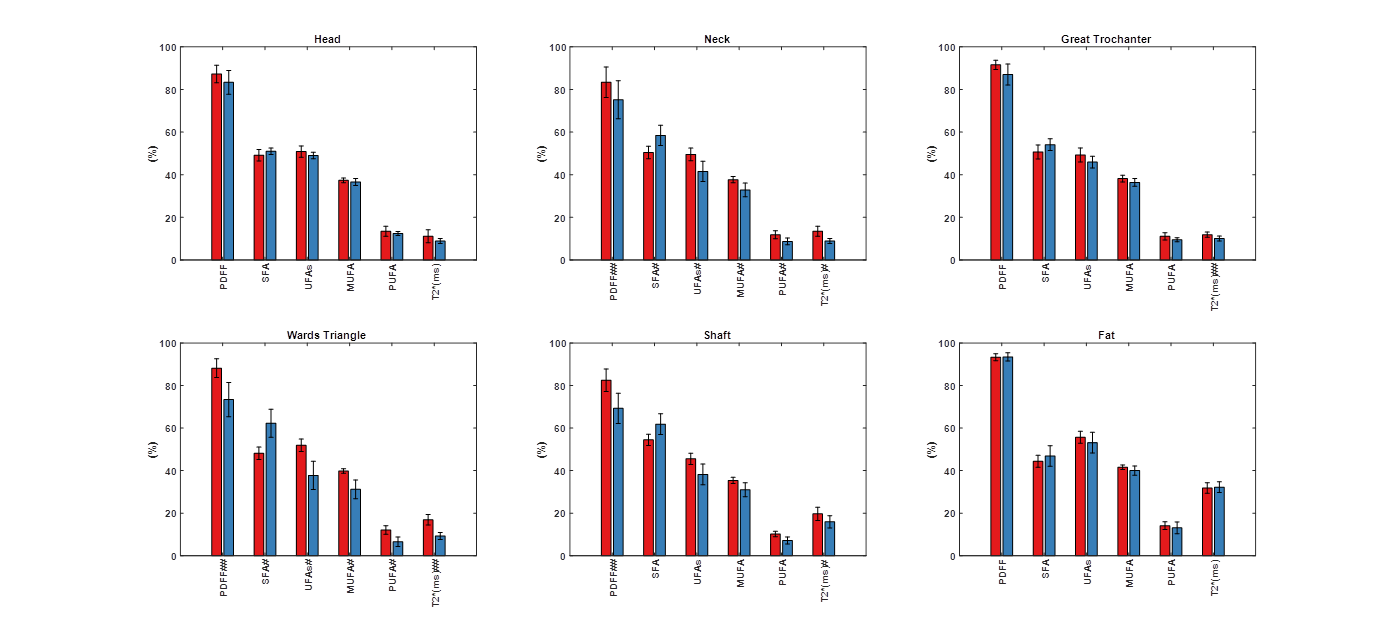
No differences were found between right and left proximal femurs for each subregion. Parametric maps display local quantitative features between controls and patients (Figure 1). Intra subject bMAT composition was tested and expose none significant variation between ROI of left and right hip. In Figure 2 it can be pointed sub regional variation with significative difference notably for SFA, PUFA and MUFA. SFA increase for all ROI about 3-14% whereas UFAs decrease about 3-12%. Triangle is the more important siege of change in term of composition (+14% SFA, - 14%UFAs) with femoral neck (+9% SFA, -8%UFAs).Discussion
Our results agree with those of previous studies2, which reported a lower level of unsaturation in patients compared to controls, especially in the subregion of Ward triangle. There was no difference in sWAT between groups in terms of quantity or composition. Our result expose differences in the most common fracture site and corroborate recent studies suggesting that PUFA has significant role in bone loss6,7.Conclusion
Using a single acquisition, we assessed bMAT composition and highlighted several subregional differences occurring in OP situation in a reasonable clinical time.Acknowledgements
No acknowledgement found.References
1. D. K. W. Yeung, J. F. Griffith, G. E. Antonio, F. K. H. Lee, J. Woo, and P. C. Leung, “Osteoporosis is associated with increased marrow fat content and decreased marrow fat unsaturation: A proton MR spectroscopy study,” J. Magn. Reson. Imaging, vol. 22, no. 2, pp. 279–285, Aug. 2005.
2. G. Di Pietro et al., “Bone Marrow Lipid Profiles from Peripheral Skeleton as Potential Biomarkers for Osteoporosis: A 1H-MR Spectroscopy Study,” Acad. Radiol., vol. 23, no. 3, pp. 273–283, Mar. 2016.
3. J. S. Gregory et al., “MRI and the distribution of bone marrow fat in hip osteoarthritis,” J. Magn. Reson. Imaging, p. n/a-n/a, May 2016.
4. E. L. Scheller et al., “Region-specific variation in the properties of skeletal adipocytes reveals regulated and constitutive marrow adipose tissues,” Nat. Commun., vol. 6, p. 7808, Aug. 2015.
5. B. Leporq, S. A. Lambert, M. Ronot, V. Vilgrain, and B. E. Van Beers, “Quantification of the triglyceride fatty acid composition with 3.0 T MRI,” NMR Biomed., vol. 27, no. 10, pp. 1211–1221, Oct. 2014.
6. K. M. Mangano, S. Sahni, J. E. Kerstetter, A. M. Kenny, and M. T. Hannan, “Polyunsaturated Fatty Acids and Their Relation with Bone and Muscle Health in Adults,” Curr. Osteoporos. Rep., vol. 11, no. 3, pp. 203–212, Jul. 2013.
7. H. A. Weiler and M. C. Kruger, “Polyunsaturated fatty acids and bone mass,” Am. J. Clin. Nutr., vol. 80, no. 4, pp. 1085–1086, Oct. 2004.
Figures