5113
Long-term prognostic value of whole-body MRI fat fraction signal changes following initial Bortezomib treatment of patients with multiple myeloma1University College London, London, United Kingdom, 2University College London Hospital, United Kingdom
Synopsis
Quantitative MRI assessment of treatment response using advanced novel imaging techniques have shown promises for monitoring outcome in patients with symptomatic multiple myeloma (MM), undergoing intensive chemotherapy.
In this work we are investiagting the potential of whole-body mDixon MRI's signal fat fraction early changes as a prognostic imaging biomarker for long-term follow-up of MM patients.
Introduction:
Multiple myeloma is a heterogeneous primary bone marrow malignancy with tendency to involve any bony site in skeleton. Intra-individual variations between multiple lesions within the same patient have been previously documented on genetic testing of targeted biopsies of bone lesions and by assessing functional MRI signal characteristics and its changes following chemo/radio therapy [1,2]. Whole-body MRI (WB-MRI) provides a highly sensitive and non-invasive assessment of entire skeleton [3] that provides the unique opportunity to interrogate the potential spatial differences between lesions at diagnosis; together with temporal heterogeneity of response/non-response at lesional level following designated therapy regimens [2,4]. In this study we investigate early (8-week post-treatment) change in the WB-MRI fat fraction signal (sFF) of focal lesions’ (FLs) within patients as a prognostic marker of outcome at 3 years.Materials and methods:
Twenty-one patients [male 13, female 8, mean age 55 range (36-69)] (Table 1) were prospectively recruited and scanned using a 3.0 T scanner at two timepoints; (a) baseline and (b) 8-weeks following Bortezomib based induction chemotherapy. T2 weighted imaging (T2-TSE) and axial DWI-MRI (4 b-values 0,100, 300, 1000) were supplemented by pre- and post-contrast coronal 2-point mDixon imaging, covering head to toe. sFF of a maximum of 20 FLs per patient was measured at baseline and re-measured at 8- week post-treatment using a systematic selection criteria of lesions distributed across the skeleton as previously reported [5]. All patients were followed up with standard biochemical investigations [Beta-2 microglobulin, Light-chain assays, bone marrow biopsy] for a minimum 3-years following initiation of chemotherapy. Based on previous work [5], an increase of ≥ 12.6% of sFF within a FL was used to separate responding from non-responding disease sites. The total number of responding and non-responding lesions was recorded for each patient. Individual patient response following initial chemotherapy was classified as per standard IMWG criteria [6]. Time to disease relapse from induction chemotherapy was determined from biochemical and clinical records and death and its date was noted.Results:
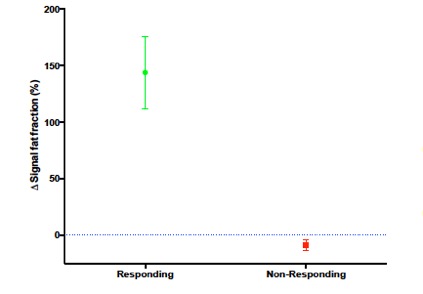
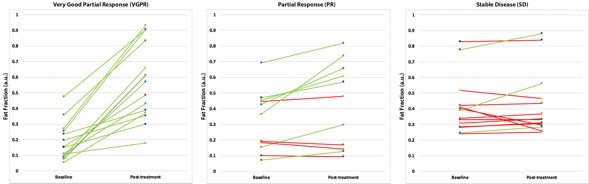
Fifteen of twenty-one patients achieved a minimum of partial response (≥ PR) whilst 6 had < PR [6] and went on to have salvage chemotherapy. From our total lesion count of 254 FLs across all patients [range 1-18 per patient]; 160 and 21 FLs from responding and non-responding patients’ cohorts constitute the responding FLs (n=181). In responding FLs, sFF increased by a mean of 150% [SD 216%] at 8-week following treatment; 26 and 47 FLs from responding and non-responding patients establish the non-responding FLs (n=73) which demonstrated a mean 8% [SD 19%] reduction in sFF following treatment (Figure 1). Figure 2 shows typical sFF change from three patients that corresponded well with IMWG response criteria. All FLs (14/14) demonstrated response (green lines) in the patient with very good partial response (VGPR) following induction chemotherapy; whilst 4/11 were classified as non-responding by sFF (red lines) in a patient with partial response (PR); and 10/13 non-responding by sFF in a patient classified as having stable disease (SD). Presently, three-years clinical follow-up data are available from 13/21 patients recruited into the study; 7/21 are yet to complete this period of follow-up. Of these 13 patients, 8/13 relapsed within 3 years and 5/13 remain in remission. Of the 8 patients that relapsed 7/8 had one or more non-responding lesions as defined on WB-MRI sFF change (median number of non-responding FLs per patient of 1 [range 0-5]). Out of the 5 patients that remain in remission, 3 had no non-responding FLs and 2 had 1 non-responding lesion (median number of non-responding lesion per patient of 0 [range 0-1]). The non-responding patients had a median of 6 (range 4-15) non-responding FLs per patient.Discussion and Conclusion:
Our results demonstrate the value of WB-MRI sFF as a marker of heterogenous response in patients treated with multiple myeloma. sFF changes reflect global response measures as defined by the IMWG. Furthermore, our initial outcome data at 3-years supports the hypothesis that non-responding lesions following treatment are associated with a shorter time to disease progression. Collection of outcome data for the remaining 7 patients is awaited. Furthermore, our results require validation in a prospective study with larger number of patients and possibly with long-term follow-up imaging using WB-MRI.Acknowledgements
No acknowledgement found.References
[1] Roudier MP, Morrissey C, True LD, et al. Histopathological assessment of prostate cancer bone osteoblastic metastases. J Urol 2008; 180:1154-1160.
[2] Messiou C, Giles S, Collins DJ, et al. Assessing response of myeloma bone disease with diffusion-weighted MRI. Br J Radiol 2012; 85: e1198–1203.
[3] Messiou C and Kaiser M. Whole body diffusion weighted MRI- a new view of myeloma. Br J Haematol 2015; 171: 29-37.
[4] Hillengass J, Bauerle T, Bartl R, et al. Diffusion-weighted imaging for non-invasive and quantitative monitoring of bone marrow infiltration in patients with monoclonal plasma cell disease: a comparative study with histology. Br J Haematol 2011; 153: 721-728.
[5] Latifoltojar A, Hall-Craggs M, Bainbridge A, et al. Early Post-Treatment Changes of Multi-parametric Whole-Body MRI Quantitative Parameters Following Bortezomib Inducation in Multiple Myeloma: Preliminary Results at 3.0 T. ISMRM 2016.
[6] Durie BGM, Harousseau JL, Miguel JS, et al. International uniform response criteria for multiple myeloma. Leukemia 2006; 20: 1467–1473.
Figures
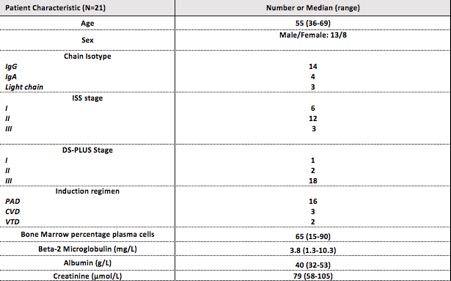
Figure 1: Demographics, routine blood tests, staging and chemotherapy regimen
ISS: International staging system DS-PLUS: Durie-Salmon PLUS
PAD: Bortezomib, Doxorubicin, Dexamethasone
CVD: Cyclophosphamide, Bortezomib, Dexamethasone
VTD: Bortezomib, Thalidomide, Dexamethasone