5111
Does Free Water T1 Differ in Different Regions of Human Cortical Bone? A Clinical Quantification Approach1Quantitative Medical Imaging Systems Group, Research Center for Cellular and Molecular Imaging, Tehran University of Medical Sciences, Tehran, Iran, Tehran, Iran, 2Medical Physics and Biomedical Engineering Department, Tehran University of Medical Sciences, Tehran, Iran, Tehran, Iran, 3School of Electrical and Computer Engineering, University of Tehran, Tehran, Iran, Tehran, Iran
Synopsis
MR structural imaging is proved to be able of featuring cortical bone hierarchical structure by obtaining enough signal from hydrogen protons of short T2* components of bone. Extreme variability of free water quantities found in cortical bone pores during aging or bone disease, furnishes researchers with a great source of information to inspect bone health. In this study, we employed short time of echo MR imaging approach to quantify cortical bone free water T1 in different regions of tibia to extract the porosity distribution pattern of cortical bone and its alteration with age in eight healthy volunteers.
Purpose
Aging is one of the most important factors affecting cortical bone structure, initiating cortical thinning and pore enlargement. As the number and size of the cortical bone pores increase the quantity of free water occupying large pores (i.e. Haversian canals and lacuna-canalicular system) augments1. This process culminates in bone weakness and raises the fracture risk. This fact highlights the importance of bone quality assessment through the quantification of cortical bone water as proposed in previous studies2,3. In this study, we focused on cortical bone free water T1 relaxometry, since bound water attached to collagen matrix and minerals, demonstrates a slight decline with age while free water alters significantly due to aging. Prior studies by means of microradiography of several human cadaveric cortical bones have shown that distribution and predomination of cortical pores is not a uniform pattern and there is a noticeable regional difference among four different anatomic regions (i.e. anterior, posterior, lateral, medial) of cortical bone4. In the present work we performed a region-based T1 analysis of human cortical bone so as to reveal the non-uniform pattern of bone porosity.Materials and Methods
Human mid-shaft tibiae of eight healthy volunteers (6 females and 2 males, 20 to 68 years old) were undergone dual-TR STE imaging with the following parameters: TE/TR1/TR2= 1.29/20/60 millisecond, field-of-view (FOV) = 267×267 mm2, spatial resolution = 0.8×0.8 mm2, slice thickness = 5 mm, flip angle = 20°, bandwidth = 781 Hz/Pix, number of slices = 10, total scan time of about 20 minutes.
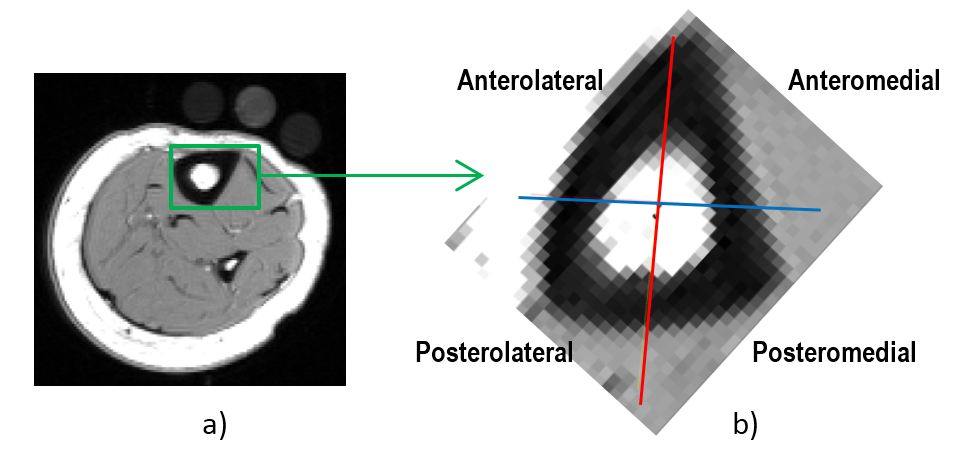
The endosteal boundaries were segmented manually and an ellipse was fitted on it while its short and long axes specified the center of ellipse. Four different regions named: anterolateral, anteromedial, posterolateral, and posteromedial were separated by the use of drawn axes. All the segmentation process was done by means of ImageJ software.
T1 quantification procedure embraced five steps5: 1) segmentation of the four cortical bone regions in both images (short-TR/long-TR), 2) computation of ratio value (r) as shown in Equation 1 by dividing mean signal intensity of the segmented cortical bone acquired from the long-TR (TR2) image by that of the short-TR (TR1) image, 3) calculation of the cortical bone free water T1-value in each slice for each region by solving Equation 1 using 'trust-region-dogleg' algorithm in MATLAB 7.14 4) repetition of the described three steps through all ten slices and computation of ten T1-values per each subject, 5) averaging all the obtained T1-values to be reported as the cortical bone free water longitudinal relaxation time of each individual region.
$$r=[(1-exp(-TR/T1)).(1-fzexp(-TR2/T1))]/(1-exp(-TR2/T1)).(1-fzexp(-TR1/T1))$$
Results
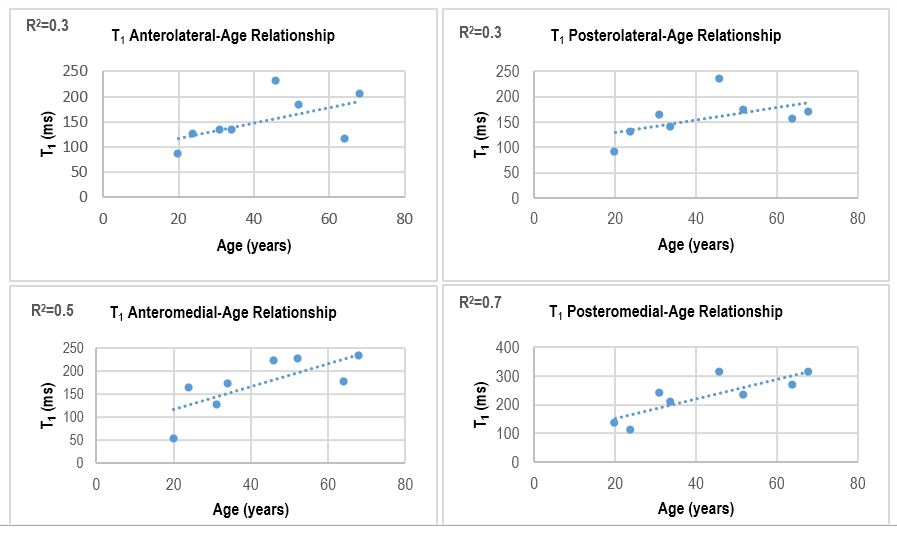
STE-MRI image of axial section of human tibia along with the four different regions of cortical bone are depicted in Figure 1. Cortical bone free water T1 values of each region were computed and the average values among 8 subjects were as follows: T1 Anteromedial=189.7±39 ms, T1 Posteromedial=215.7±74 ms, T1 Anterolateral= 161±44 ms, T1 Posterolateral=167±33 ms. Cortical bone free water T1 relationship with age in different regions of bone is demonstrated in Figure 2. Results introduced the posteromedial region of cortical bone as the most porous region (possessing the longest T1 value) which shows the highest alteration with age (r2=0.7), and the anterolateral and posterolateral regions as the least affected regions by age. Meanwhile, anteromedial region possessed the modest amount of porosity and alteration with age (r2=0.5).Discussion and Conclusion
Results declared the significance of region-based T1 analysis of cortical bone free water and accentuated the position of MR-based assessment of bone as a reliable measure of bone quality. Previous research has been quantified cortical bone free water values in different magnet fields in both human and cadaveric samples, but to the best of our knowledge this is the first study carried out to investigate the regional changes of cortical bone tibia with age. This regional assessment would provide us with the profound understanding of bone structure and its regional deterioration during aging or bone diseases like osteoporosis.Acknowledgements
No acknowledgement found.References
1.Techawibonwong, A., et al, Radiology, 2008 2. Li, C., et al., Radiology, 2014 3. Du, J., eMagRes, 2012 4. Thoms, C.D.L., S.A. Feik and J.G Clement, Hournal of anatomy, 2005 5. Akbari, A., et al, Bone, 2016Figures