5110
Three-Dimensional Adiabatic Inversion Recovery Prepared Ultrashort Echo Time Cones (3D IR-UTE-Cones) Imaging of Cortical Bone in the Hip1The University California, San Diego, San Diego, CA, United States, 2GE Healthcare, San Diego, CA, United States, 3Radiology Service, VA San Diego Healthcare System
Synopsis
Ultra short echo time (UTE) techniques have been used to image cortical bone. However, imaging cortical bone in hip has been challenging due to limited signal-to-noise ratio (SNR), robust long T2 suppression, and long scan time. UTE sequences with TEs down to 32μs are able to acquire signal from both short and long T2* tissue. To suppress long T2* tissue, the combination of inversion recovery (IR) and UTE imaging can be used. In this report, we applied three-dimensional adiabatic inversion recovery prepared UTE with Cones trajectories (3D IR-UTE-Cones) to suppress long T2 tissue and to directly quantify cortical bone in the hip in vivo at 3T.
Introduction
About 80% of the skeleton is composed of cortical bone, which demonstrates pure signal void with clinical magnetic resonance (MR) imaging sequences. In recent years a variety of ultrashort echo time (UTE) techniques have been developed to image cortical bone (1-4). Almost all of the UTE techniques have focused on cortical bone in the tibial midshaft, with a few examples showing success in imaging the femoral midshaft and the forearm. Direct MR imaging of cortical bone in the hip has not yet been performed, although the hip is among the most frequent and the most devastating of fractures (5). The near absence of research in this area is mainly due to the technical difficulties, including the thin cortex (requiring high resolution thus limited signal-to-noise ratio [SNR]), inefficient coils (no dedicated coils for hip bone imaging), requirement for robust long T2 suppression (in order to create high contrast images of bone), and long scan time. In this study, we report the use of three-dimensional adiabatic inversion recovery prepared UTE with Cones sampling (3D IR-UTE-Cones) to direct image and quantify cortical bone in the hip in vivo at 3T.Method
The 3D IR-UTE-Cones sequence employing a short pulse excitation followed by spiral sampling with conical view ordering was implemented on a 3T scanner (Signa HDx, GE Healthcare, Milwaukee, WI) (6). The sequence has a minimal TE of 32 µs and allows anisotropic field of view and spatial resolution for fast volumetric imaging. An adiabatic inversion pulse (duration = 8.64ms) was used for robust inversion and suppression of the longitudinal magnetizations of long T2 water and fat. Two healthy volunteers (30 and 34 years old, male) were scanned by using a Torso phased-array coil. The following scan parameters were used: TR = 116.7ms, TI = 50ms, four TEs (0.032, 0.2, 0.4, and 0.8ms), BW = 250kHz, FOV = 340 x 340mm2, slice thickness = 3mm, matrix = 128×128, flip angle = 18°, acquired voxel size = 2.6×2.6×3mm3, and scan time = 4.5 minutes for each dataset. T2* was quantified with a single-component decay fitting of IR-UTE-Cones images.Results
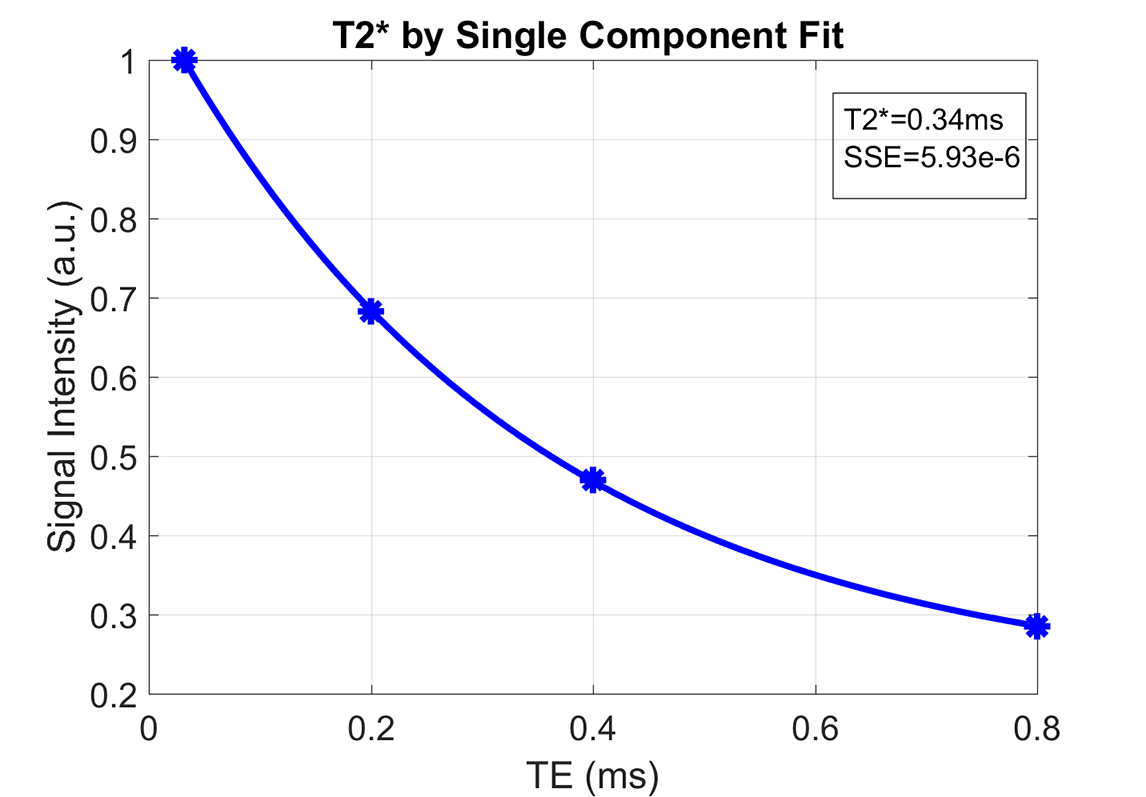
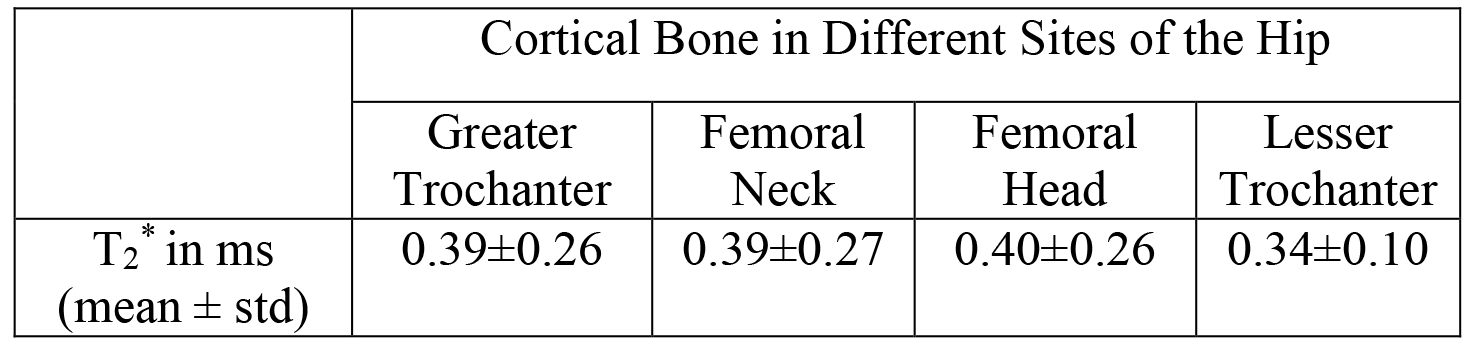
Figure 1 shows a representative slice of the hip of a 31-year-old male healthy volunteer imaged with the 3D IR-UTE-Cones sequence. Cortical bone in the femoral midshaft, femoral head and neck as well as greater trochanter is depicted with excellent image contrast. Muscle and marrow fat in the hip, which typically have far higher signals than that of cortical bone, are efficiently suppressed by the adiabatic inversion pulse. SNR for cortical bone in the femoral head is relatively low due to the thin structure and limited coil sensitivity from the clinical torso phased array coil. Four ROIs were drawn in the hip for T2* analysis, including the greater trochanter (ROI 1), the femoral neck (ROI 2), the femoral head (ROI 3), and the lesser trochanter (ROI4). A representative T2* decay curve using single component fitting is shown in Figure 2. Excellent single component decay was observed for all ROIs, consistent with pore water being suppressed by the IR pulse and only collagen bound water being detected by the IR-UTE-Cones sequence. Table 1 summarizes the mean and standard deviation for T2* values for the greater trochanter, the femoral neck, the femoral head, and the lesser trochanter, respectively, between the two volunteers. The average T2* values ranged from 0.34 ms to 0.4 ms, largely consistent with previously reported T2* values of bound water in the tibial midshaft.Discussion and Conclusion
Preliminary results from this study show that cortical bone in the hip can be imaged with relatively high spatial resolution using the 3D IR-UTE-Cones sequence. The adiabatic inversion pulse provides robust suppression of long T2 water and marrow fat, creating very high contrast for cortical bone. T2* can be reliably estimated via single-component fitting of 3D IR-UTE-Cones acquisitions with a series TEs. Further optimization of the imaging protocol, including in-plane resolution, slice thickness and scan time will be performed in future studies. The 3D UTE-Cones and IR-UTE-Cones sequences can potentially evaluate cortical porosity (pore water content) and organic matrix (bound water content) in the hip (7-9). These techniques may provide more comprehensive evaluation of cortical bone quality, and thus may serve as predictors for risk of future hip fractures.Acknowledgements
The authors acknowledge grant funding from the VA Clinical Science R&D Service (Merit Award I01CX001388) and the NIH (1R01 AR062581-01A1, 1 R01 AR068987-01).References
1. Reichert ILH, Robson MD, Gatehouse PD, He T, Chappell KE, Holmes J, Girgis S, Bydder GM. Magnetic resonance imaging of cortical bone with ultrashort TE (UTE) pulse sequences. Magn Reson Imaging 2005; 23:611-618.
2. Wu Y, Ackerman JL, Chesler DA, Graham L, Wang Y, Glimcher MJ. Density of organic matrix of native mineralized bone measured by water- and fat-suppressed proton projection MRI. Magn Reson Med 2003; 50:59-68.
3. Du J, Hamilton G, Takahashi A, Bydder M, Chung CB. Ultrashort TE spectroscopic imaging (UTESI) of cortical bone. Magn Reson Med 2007; 58:1001-1009.
4. Techawiboonwong A, Song HK, Leonard MB, Wehrli FW. Cortical bone water: in vivo quantification with ultrashort echo-time MR imaging. Radiology 2008; 248:824-833.
5. Cummings SR, Nevitt MC, Browner WS, Stone K, Fox KM, Ensrud KE, Cauley J, Black D, Vogt TM. Risk factors for hip fracture in white women. Study of osteoporotic fractures research group. N Engl J Med 1995; 332:767-773.
Figures