5108
Assessing reliability of 3D Cones UTE-T2* sequence for detecting subsurface changes in cartilage and meniscus1Department of Orthopedic Surgery, Stanford University, Stanford, CA, United States
Synopsis
The purpose of this study is to establish the reliability of the UTE-T2* mapping method using 3DCones sequence shown to detect subsurface changes in knee cartilage and meniscus. Scans were performed on cadaver knee specimen using 3DCones acquisition at 3T with 8 and 12 TEs. Reliability was assessed by the intraclass correlation coefficient (ICC) calculated as 0.77 and 0.91 for the 8 and 12 point techniques. The method is good to excellently reproducible for both techniques. Hence, the 3DCones UTE-T2* mapping technique can reliably evaluate subsurface changes in meniscus and cartilage and help identify at-risk OA patients.
Introduction:
Articular cartilage and meniscus degeneration have been implicated in the development of Osteoarthritis (OA), one of the most common and disabling diseases with major implications for individual and public health care1,2. Standard diagnostic imaging techniques including radiographs and morphological MRI have been unsuccessful in identifying potentially reversible subsurface changes in surface intact articular cartilage and menisci. Thus, improved diagnosis and staging of early disease is needed to develop early intervention strategies to delay or prevent OA in vulnerable populations3. A novel UTE-T2* mapping technique employed by our group has previously demonstrated an ability to detect reversible subsurface changes in cartilage and menisci after anterior cruciate ligament reconstruction (ACLR) surgery4-6. The purpose of this study is to establish the reliability of the UTE-T2* maps from data acquired using a new 3D Cones sequence for detecting subsurface changes in cartilage and meniscus by evaluating its repeatability ex vivo and in vivo.Methods:
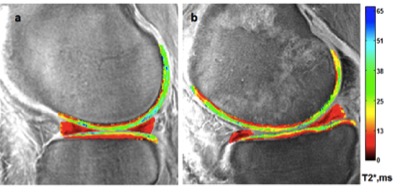
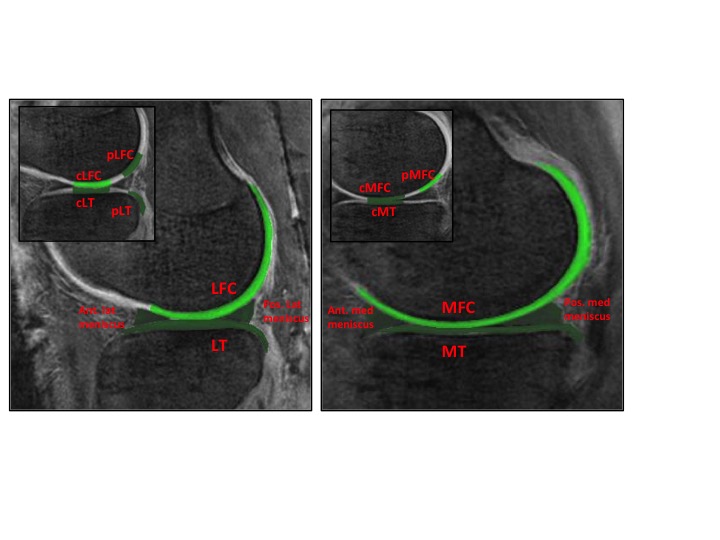
Image acquisition and analysis: Test retest scans were performed on three cadaver knee specimen on a 3T MRI scanner (MR 750, GE Healthcare, Milwaukee, WI) with a transmit-receive 8-channel knee coil (GE Healthcare) using a radial out 3D cones acquisition at: 32μs, 3.6,7.2,16 and 1, 4.7, 9, 25ms for the 8 point and 32μs, 3.6, 7.2, 25ms, 1,4.6,9,16 and 0.5,4.1,12.7,20ms TEs for the 12 point acquisition. The cones sequence samples MRI data starting at the center of k-space and twisting outwards along conical surfaces in 3D while allowing for anisotropic FOV and resolution7. The selection of echo times was optimized to specifically assess deep articular cartilage, the portion of cartilage extending from the bone-cartilage interface through half of the articular thickness. UTE-T2* maps were calculated via mono-exponential pixel-by-pixel fitting on a series of T2*-weighted MR images using MRIMapper software (Beth Israel Deaconess Medical Center, Boston, Massachusetts, USA and Massachusetts Institute of Technology, Cambridge, Massachusetts, USA) running on a Matlab platform (The Mathworks, Natick, Massachusetts, USA) (Figure1). Mean T2* values were calculated for sixteen pre-defined regions: global medial and lateral femoral condyle (MFC, LFC) and tibial plateaus (MT, LT) along with central and posterior femoral condyles and tibial plateau (cMFC, pMFC, cLFC, pLFC, cMT, cLT and posteriolateral tibia pLT) (Figure2). Additionally, T2* values of anterior and posterior menisci regions were also measured. Zonal/laminar cartilage differences were assessed by further segmenting regions of interest in cartilage into superficial and deep halves. All scans were performed with the same acquisition protocol and on the same scanner without any scanner updates during the course of the study. The retest scans were done after taking the cadaver samples out of the scanner and repositioning them in the coil on the same day.
Statistics: Reliability was assessed by calculating the intraclass correlation coefficient (ICC) with 95% confidence intervals (CI) (SAS v 9.4). ICC values range from 0-1 with values closer to one indicating better reliability8.
Results:
For both the 8 and 12-point acquisition techniques, histograms showing the distribution of the differences between the first and second scans demonstrated that the data closely followed normal distributions centered near zero. The ICC for the 8-point technique was 0.77 (95% CI: 0.57, 0.88) and the 12-point technique was 0.91 (95% CI: 0.82, 0.96).
Discussion:
A reliable quantitative T2* measurement technique is required to detect subtle subsurface matrix changes occurring early in OA development, which are not typically observable in standard clinical MRI scans. Our experiments show that the repeatability of the T2* measurements is good to excellent for both techniques. The minimal repeatability error we observed is likely related to slight differences in segmentation and specimen positioning between the scans. However, repeatability experiments are generally influenced by these factors and small differences in images obtained by two sequential scans are thus expected9. We plan on expanding this study in a larger population and an in-vivo study in volunteers is ongoing.Conclusion:
Structural changes from cartilage and meniscus injury and degeneration prior to surface breakdown typically precede clinical OA symptoms. However, pathological changes have the highest likelihood of reversal at these earlier stages4. Our study shows that the test retest analyses of the 3D Cones UTE-T2* quantitative MRI method is good to excellently reproducible. In conclusion, this data supports the reliability of the 3D UTE Cones T2* mapping technique to evaluate subsurface matrix changes in meniscus and cartilage reflective of subsurface injury and early degeneration potentially related to heightened OA risk.Acknowledgements
NIH RO1 AR052784 (CR Chu), GE Healthcare and Jayme Koltsov.References
1. Roemer FW, Crema MD, Tratting S, Guermazi A. Advances in Imaging of Osetoarthritis and Cartilage. Radiology 2011; 260(2): 332-54
2. Cross M, Smith E, Hoy D, Nolte S, Ackerman I, Fransen M, Bridgett L, Williams S, Guillemin F, Hill CL, Laslett LL, Jones G, Cicuttini F, Osborne R, Vos T, Buchbinder R, Woolf A, March L. The global burden of hip and knee osteoarthritis: estimates from the global burden of disease 2010 study. Ann Rheum Dis. 2014;73(7):1323-30
3. Chu CR, Andriacchi TP. Dance between biology, mechanics and structure: a systems-based approach to developing osteoarthritis prevention strategies. Journ of Orth Research 2015; 33(7): 939-947.
4. Williams A, Qian Y, Bear D, Chu CR. Assessing degeneration of human articular cartilage with ultra-short echo time (UTE) T2* mapping. Osteoarthritis Cartilage. 2010;18(4):539-46.
5. Chu CR, Williams A, West RV, Qian Y, Fu FH, Do BH, Bruno S. Quantitative Magnetic Resonance Imaging UTE T2* Mapping of Cartilage and Meniscus Healing after Anterior Crucial Ligament Reconstruction. Am J Sports Med 2014; 42(8): 1847-56.
6. Williams A, Qian Y, Golla S, Chu CR. UTE-T2* mapping detects sub-clinical meniscus injury after anterior ligament tear. Osteoarthritis and Cartilage. 2012; 10.1016/j.joca.2012.01.009.
7. Gurney PT, Hargreaves BA, Nishimura DG. Magn Reson Med 2006;55(3):575-582
8. Shrout PE, Fleiss J. Intraclass correlations: use in assessing rater reliability. Psychol Bul. 1979;86:420-428.
9. Whisenhunt JG, Ayers GD, Loveless ME, Barnes SL, Colvin DC, Yankeelov TE. Asessing reproducibility of diffusion weighted magnetic resonance imaging studies in a murine model of HER2+ breast cancer. Magn Reson Med 2014; 32(3):245-249.
Figures