5107
Validation study T2 and T1rho mapping of the ankle cartilage using healthy volunteersHon J. Yu1, Alex Luk1, Jimmy Ton1, Edward Kuoy1, Jeff Russell2, Kelli Sharp3, and Hiroshi Yoshioka1
1Radiological Sciences, University of California, Irvine, CA, United States, 2Science and Health in Artistic Performance, Ohio University, Athens, OH, 3Arts-Dance, University of California, Irvine, CA, United States
Synopsis
This study demonstrates feasibility in manual segmentation of talar dome using MRI of the ankle and provides a systematic approach in assessment of image-based segmentation utilizing purely geometrical attributes and subsequent validation of angle-dependent analysis of T2 and T1ρ mapping of the cartilage. The results clearly demonstrates the magic angle effect of the talar dome cartilage on T2 mapping and also the important fact that repeatability assessment of segmentation should be made using the geometrical attributes rather than the underlying segmentation-based quantity.
Purpose
T2/T1ρ mapping is a new physiologic/biochemical and quantitative MRI recently introduced for evaluation of the knee or hip cartilage. However, it has rarely been used in the ankle. The purpose of this study was to determine reproducibility of quantitative measurement of T2/T1ρ mappings of healthy talar dome cartilage using angle-dependent approach, and to investigate their regional variations within the talar dome cartilage.Materials and Methods
The study protocol was approved by the institutional review board, and all subjects gave written informed consent before any study-related procedures were done. Ten healthy female volunteers (mean: 20.4 yrs, range: 19-24) were enrolled and scanned for the equal number of left and right ankles. All MR studies were performed on a 3T scanner (Achieva, Philips Healthcare, Netherlands) using an 8-channel, dedicated ankle/foot coil. Three sagittal images were acquired including fat suppressed (FS) proton density-weighted imaging (PDWI) sequence, T2 mapping sequence, and T1ρ mapping sequences with true sagittal angulation parallel to the magnetic static field (B0). The acquisition parameters were as follows. FS PDWI: 2D turbo spin-echo; repetition time (TR)/echo time (TE)= 3958/30 ms, number of excitation (NEX)=1, and total acquisition time=2.5 minutes. T2 mapping: 2D turbo spin-echo; TR/TE=3000/13, 26, 39, 52, 65, 78, 91 ms, NEX=1 and total acquisition time=11 minutes. T1ρ: 3D FS PROSET (PRinciple Of Selective Excitation Technique); TR/TE=7.5/3.8 ms, flip angle=10°, NEX=1, spin-lock frequency=575 Hz, time of spin-lock (TSL)= 0, 10, 20, 40, and 80 ms, and acquisition time=3 minutes 51 seconds for each TSL. All images were obtained with field of view (FOV)=140x140mm, slice thickness/gap=3/0 mm, image matrix=512×512, and number of slices=20. Manual cartilage segmentation of the entire talar dome on randomized T2 and T1ρ images was performed by one reader using in-house developed and implemented software in MatLab (MathWorks, Natick, USA). With an interval of two weeks, cartilage segmentation was repeated by the same reader after another randomization of data. T2 and T1ρ angle-dependent profiles of the entire talar dome were created by angular segmentation in steps of 4-degrees over the length of the segmented cartilage (with the angle 0 defined along B0 as shown Fig.1) using a custom Matlab program. Intra-reader reproducibility was investigated using Bland-Altman (BA) analysis on geometrical aspects of segmentation (the number of pixel from and the radial-distance as shown in Fig. 1 to each segment) as well as T2 and T1ρ values from individual angular segmentation.Results
The repeatability of segmentation was first assessed using correlation and BA plot of the radial distance (Fig.2) and number of pixels (Fig.3), respectively, over the common slices and angular ranges where the segmentation was repeated. A relatively high repeatability was observed between the first and second segmentation in terms of the geometrical attributes of each angular segment. A statistically significant linear correlation (r > 0.999) was observed from both T2 and T1ρ segmentation in terms of the radial distance. Segmentation using T2 yielded a slightly more consistent size of angular segment than that of T1ρ when repeated (mean-difference in pixel-#: 0.36 vs. 0.54, respectively, for T2 and T1ρ). T2 and T1ρ values from the individual angular segments were compared using BA plot (Fig.4). An appreciably higher repeatability can be observed with T1ρ than T2 (mean-difference: 0.23 vs. 0.50, respectively). Since a similar segmentation repeatability was observed from both in terms of the geometrical aspects, this is very likely due to a more homogeneous nature of T1ρ within the cartilage in comparison to T2 as well as the chemical-shift artifact influencing more on T2 than T1ρ mapping. The central segmented slice from each subject was also pooled together to demonstrate the angular profile in T2 and T1ρ as the average of and the difference from the repeated segmentation for each quantity (Fig.5). The graph of mean T2 mapping demonstrates minimum values near 180 degree parallel to the B0 direction, while it increased over the anterior and posterior talar dome when it approached the magic angle. On the other hand, the angular dependent changes were much more subtle in T1ρ of talar dome cartilage.Conclusion
This study demonstrates feasibility in manual segmentation of talar dome using MRI of the ankle and provides a systematic approach in assessment of image-based segmentation utilizing both purely geometrical attributes and the underlying segmentation-based quantity (here, T2 and T1ρ). Angle-dependent approach clearly demonstrated the magic angle effect of the talar dome cartilage on T2 mapping. The results also demonstrate the important fact that repeatability assessment in image-segmentation can be misleading when such assessment is based on the underlying segmentation-based quantity rather than the geometrical nature of segmentation.Acknowledgements
Funding source: Institute for Clinical & Translational Science (ICTS) at University of California, Irvine, School of Medicine/Clair Trevor School of Arts Grant: T2 and T1ρ cartilage mapping of the ankle joint of ballet dancersReferences
No reference found.Figures
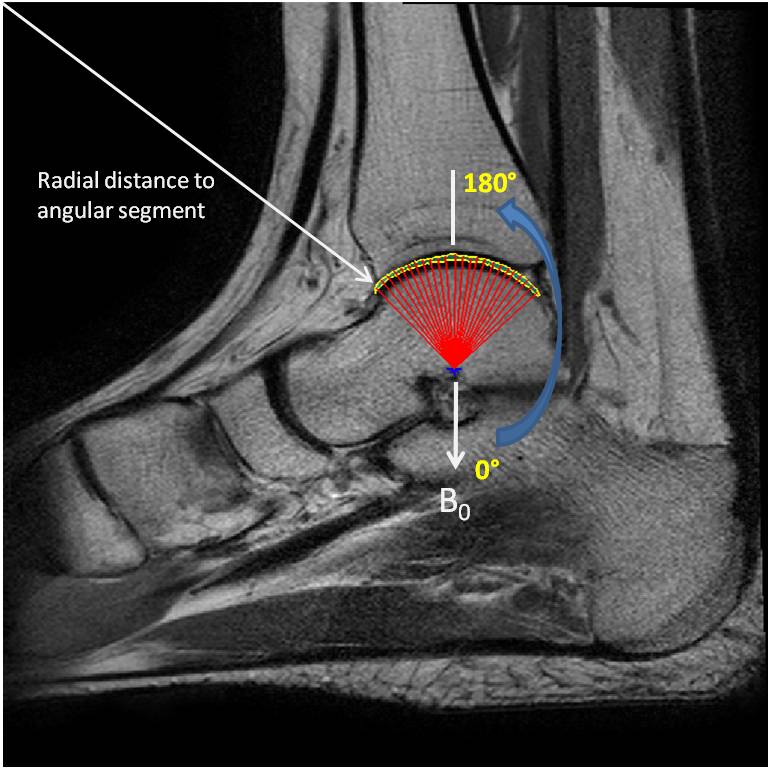
Figure 1. A sample
ankle image with angular segmentation and the definitions for angular orientation
and radial distance to each angular segment.
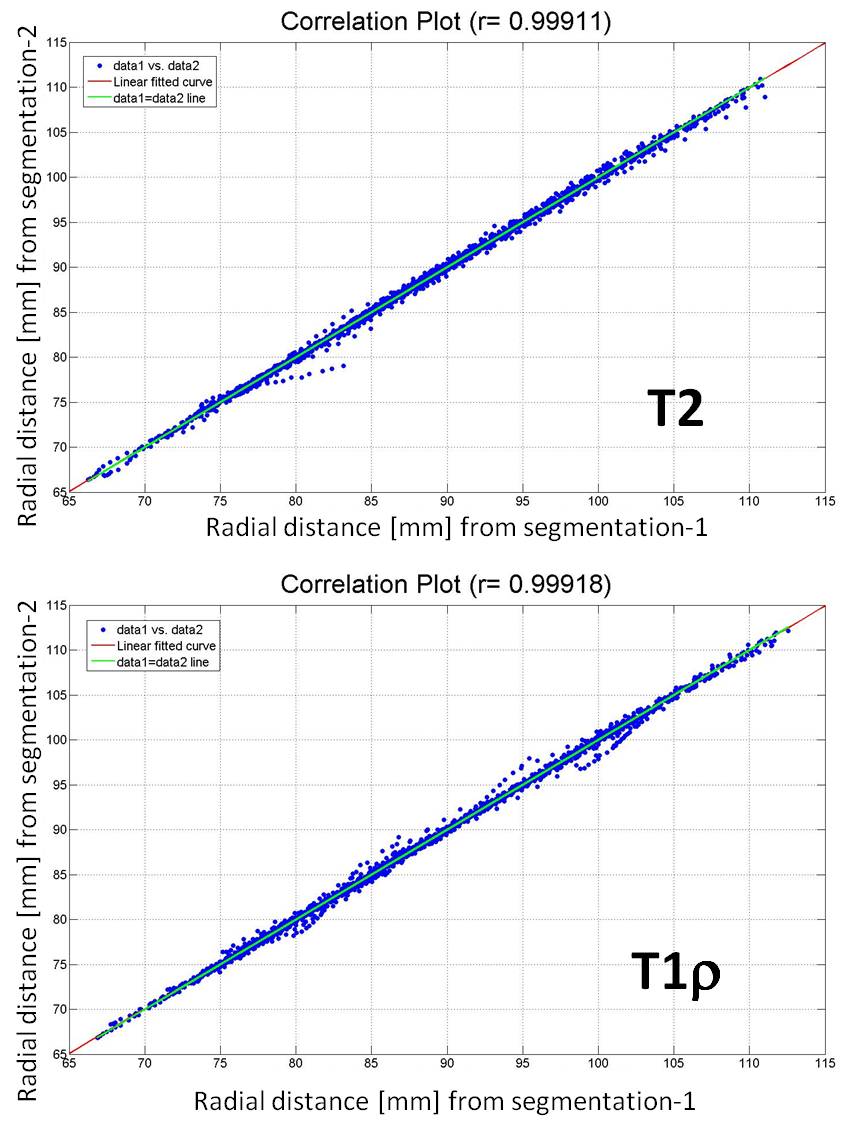
Figure 2. Correlation
plots of radial distance from 2 segmentation operations in T2 and T1ρ image
(P < 0.0005 for both).
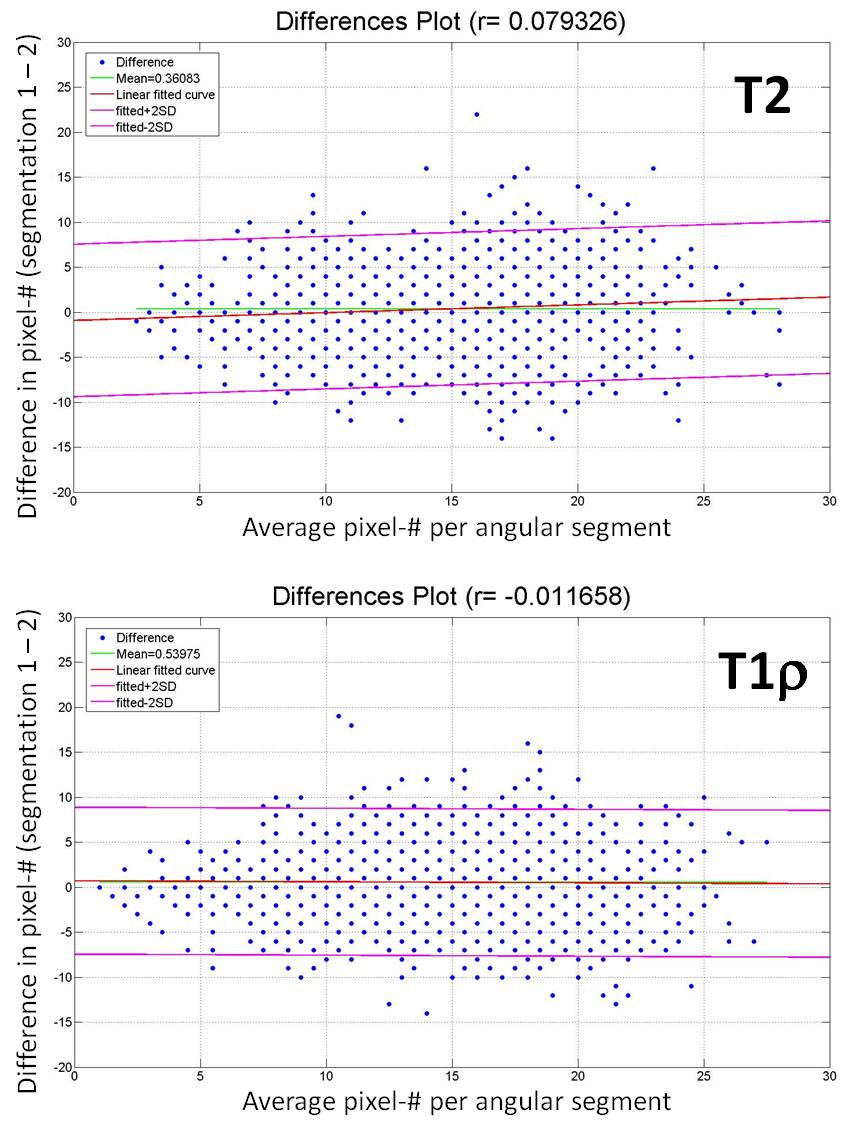
Figure 3. BA
plots of number of pixels per angular segment from 2 segmentation operations in
T2 and T1ρ images.
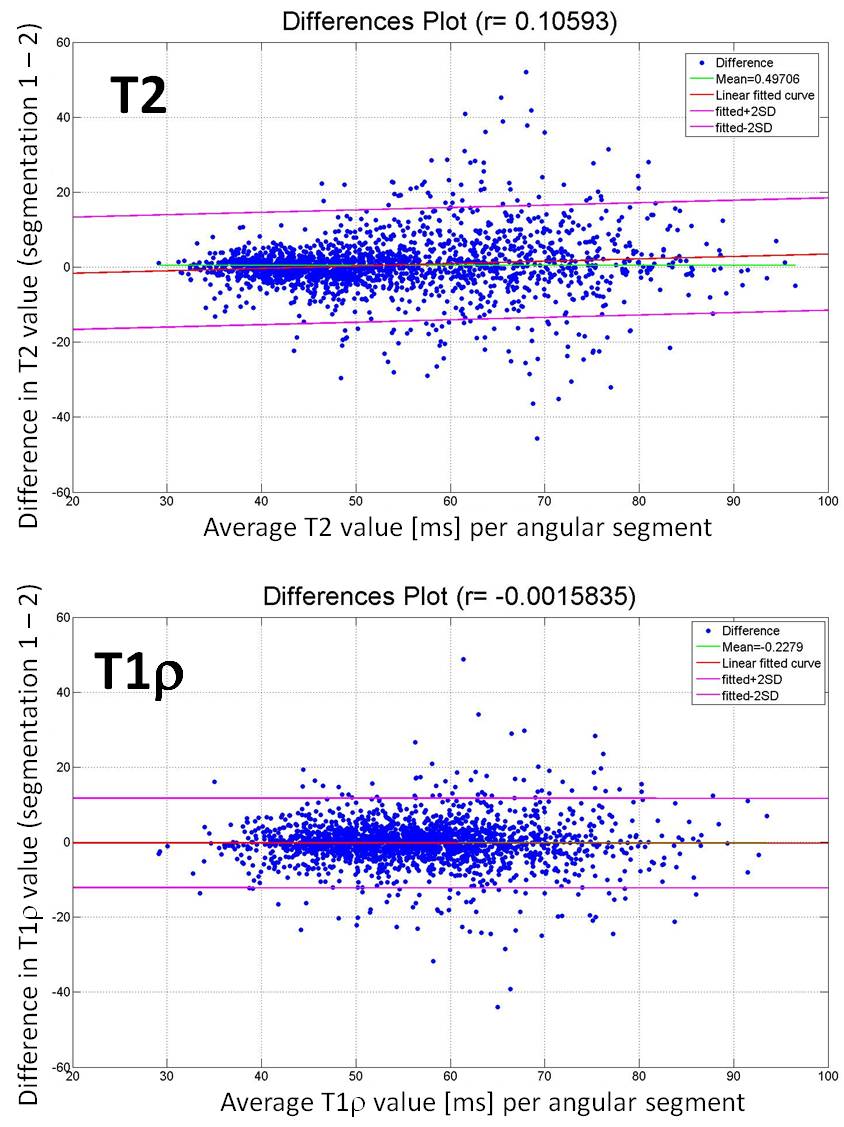
Figure 4. BA
plots of T2 and T1ρ value per angular segment from 2 segmentation operations.
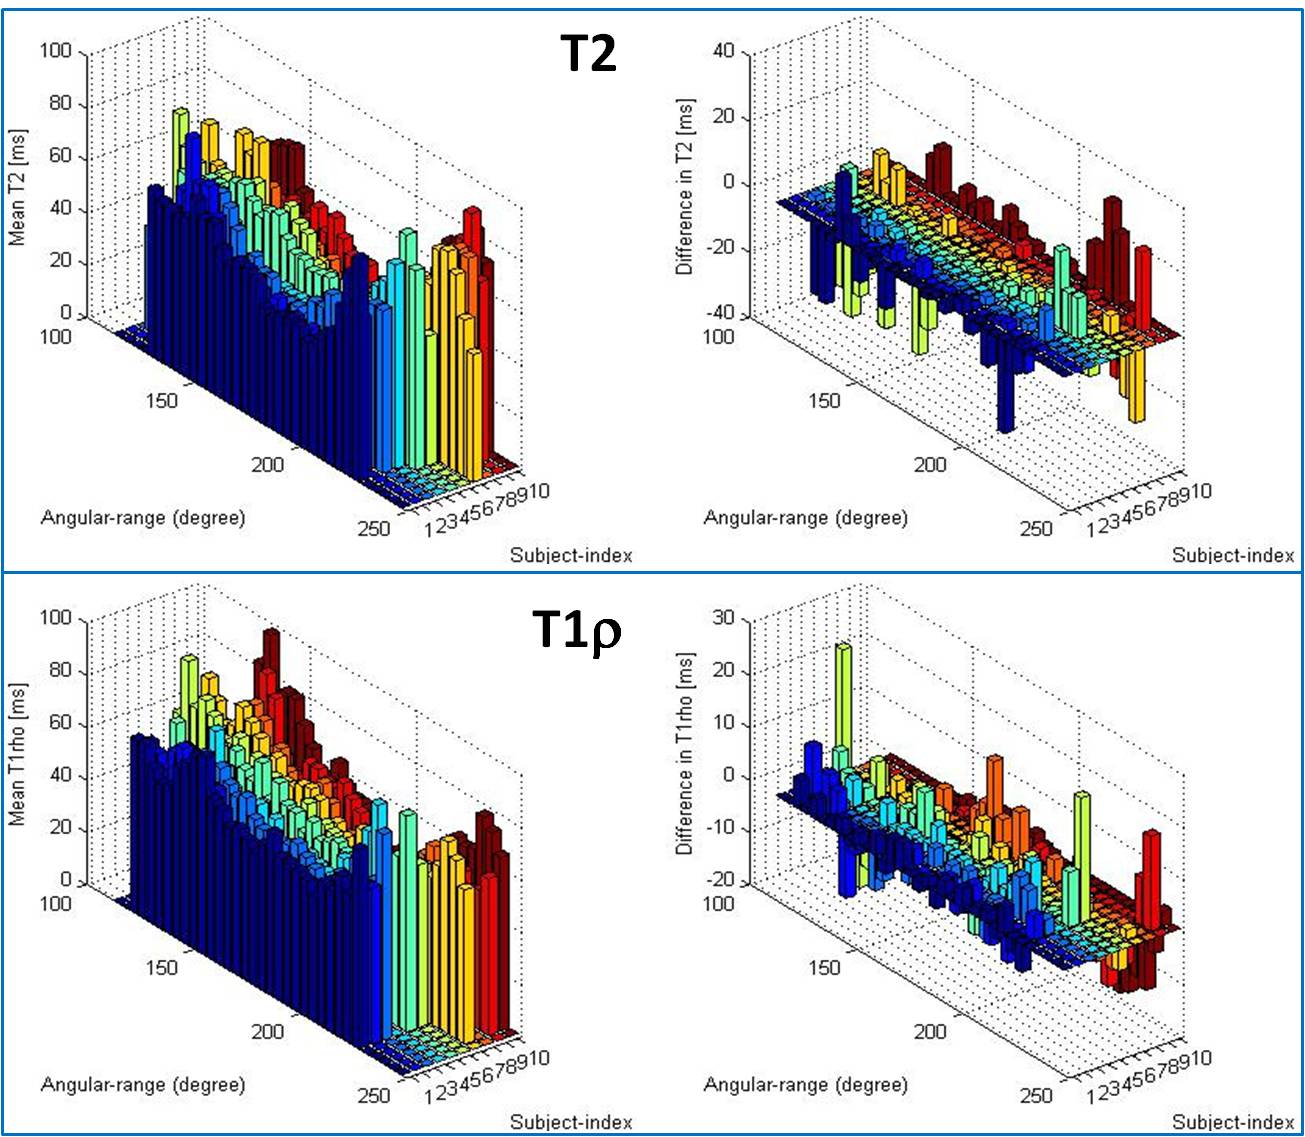
Figure 5. Averages
and differences from 2 segmentation operation for T2 and T1ρ profiles from
the central-segmented slice in each subject.