5106
Comparison of T2 and T1rho mapping of ankle cartilage between young healthy females and dancers1Radiological Sciences, University of California, Irvine, CA, United States, 2Science and Health in Artistic Performance, Ohio University, Athens, OH, 3Arts-Dance, University of California, Irvine, CA, United States
Synopsis
This study demonstrates an angular-dependent T2 and T1ρ profile of talar dome cartilage at 3T using novel angular-segmentation methodology for the potential of quantitative functional assessment of cartilage in vivo. The results in this study indicate T2 values over the posterior weight-bearing portion were higher in young dancers than age-matched healthy volunteers even though cartilage thickness and volumes were not significantly different between two cohorts.
Purpose
Many dancers begin their training long before skeletal maturity for years. This causes ankle pain, and can lead to ankle arthritis in experienced ballet dancers. However, ankle problems of dancers are often treated sub-clinically and MRI is rarely used for diagnosis. Accurate imaging diagnosis of ankle disease is important due to the popularity of recreational, university, and vocational ballet dance. Because ballet dancers are relatively young and mostly female, non-invasive and non-irradiative MRI is the best imaging modality for ankle disease in this population. The purpose of this study was to quantify and evaluate early and advanced cartilage degeneration of the ankle in ballet dancers compared with young healthy females using an orientation dependent T2 and T1ρ mapping approach.Materials and Methods
The study protocol was approved by the institutional review board, and all subjects gave written informed consent before any study-related procedures were done. Ten healthy female volunteers (mean: 20.4 yrs, range: 19-24) and 10 dancers (mean: 21.7 yrs, range: 19-30) were enrolled and scanned for the equal number of left and right ankles in each group. All MR studies were performed on a 3T scanner (Achieva, Philips Healthcare, Netherlands) using an 8-channel, dedicated ankle/foot coil. Three sagittal images were acquired including fat suppressed (FS) proton density-weighted imaging (PDWI) sequence, T2 mapping sequence, and T1ρ mapping sequences with true sagittal angulation parallel to the magnetic static field (B0). The acquisition parameters were as follows. FS PDWI: 2D turbo spin-echo; repetition time (TR)/echo time (TE)= 3958/30 ms, number of excitation (NEX)=1, and total acquisition time=2.5 minutes. T2 mapping: 2D turbo spin-echo; TR/TE=3000/13, 26, 39, 52, 65, 78, 91 ms, NEX=1 and total acquisition time=11 minutes. T1ρ: 3D FS PROSET (PRinciple Of Selective Excitation Technique); TR/TE=7.5/3.8 ms, flip angle=10°, NEX=1, spin-lock frequency=575 Hz, time of spin-lock (TSL)= 0, 10, 20, 40, and 80 ms, and acquisition time=3 minutes 51 seconds for each TSL. All images were obtained with field of view (FOV)=140x140mm, slice thickness/gap=3/0 mm, image matrix=512×512, and number of slices=20.
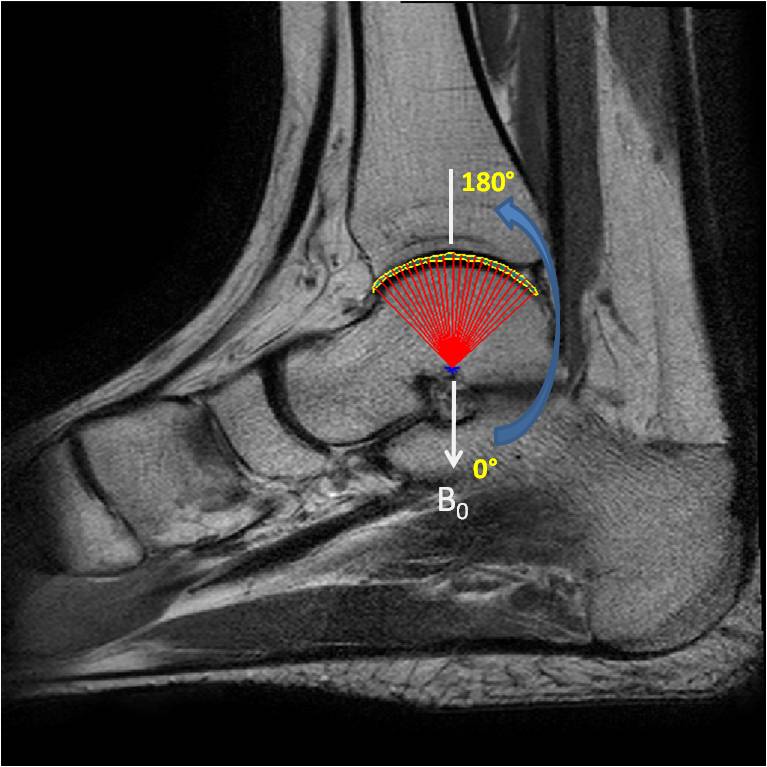
Manual cartilage segmentation of the entire talar dome on randomized T2 and T1ρ images was performed by one reader using in-house developed and implemented software in Matlab (MathWorks, Natick, USA). With an interval of two weeks, cartilage segmentation was repeated by the same reader after another randomization of data. T2 and T1ρ angle-dependent profiles of the entire talar dome were created by angular segmentation in steps of 4-degrees over the length of the segmented cartilage (with the angle 0 defined along B0 as shown in Fig.1) using a custom Matlab program. Mean cartilage T2 and T1ρ values as well as cartilage mean thickness and volume of the entire talar dome from two cohorts were compared.
Results
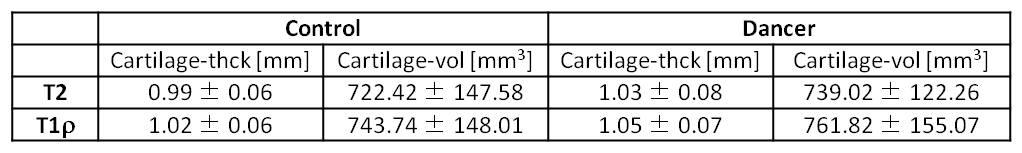
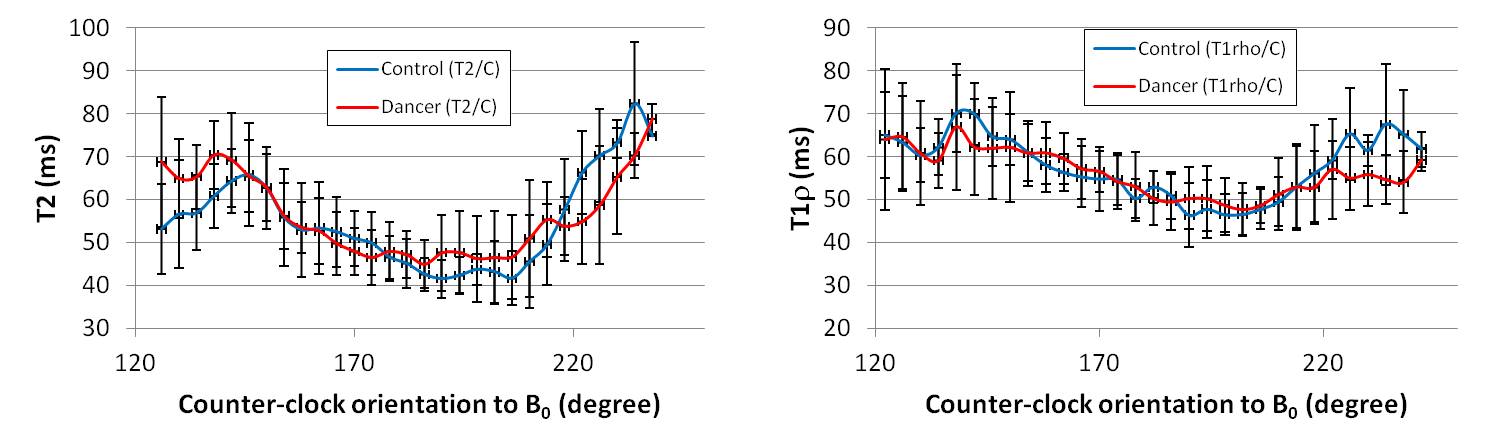
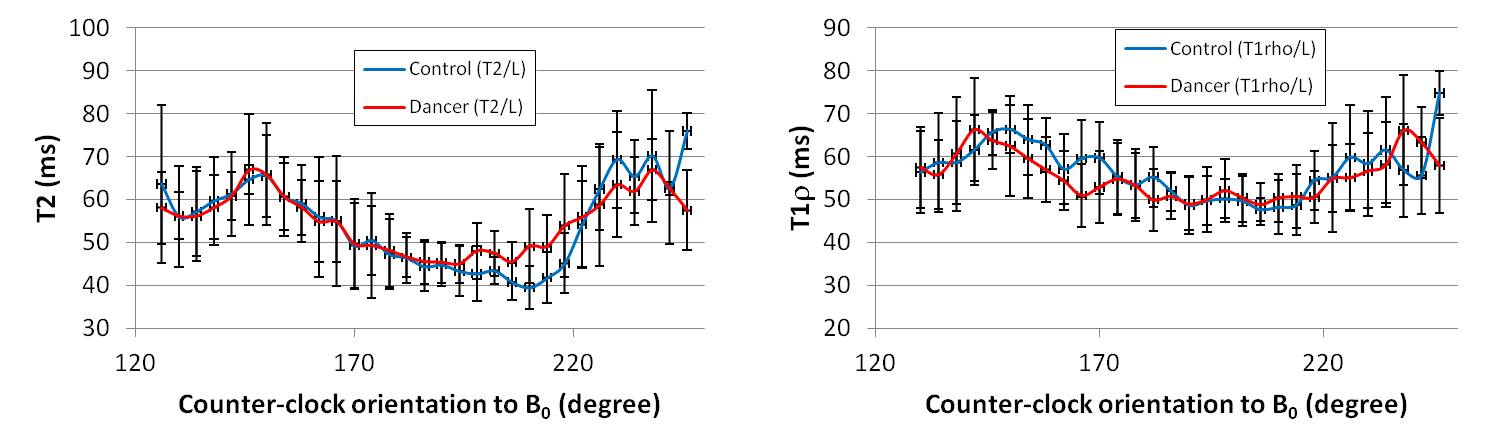
The size of cartilage in each subject was averaged from the 2 segmentation operations and shown for each cohort separately for T2 and T1ρ in Table 1. T1ρ tended to yield slightly larger size measurements in comparison to that of T2 for both cohorts because deep cartilage is dark similar to the subchondral bone plate on T2 mapping leading to underestimation. However, the differences were not significant. The size differences between the cohorts as measured with both T2 and T1ρ were not statistically significant either. The angular T2 and T1ρ profiles were compared between the cohorts here using the three central slices segmented in each subject: (M) medial, (C) central, and (L) lateral slice, and shown in Figures 2-4, respectively. Dancers showed slightly increased T2 values from the angular range of approximately 180° to 210° from all 3 slices, which corresponds to the posterior weight-bearing portion of the talar dome cartilage. T1ρ profile showed more of an overlap between the cohorts across all 3 slices, with an exception for the decrease observed in dancers around 230° mark from both the medial and central slices.Conclusion
This study demonstrates an angular-dependent T2 and T1ρ profile of talar dome cartilage at 3T using novel angular-segmentation methodology for the potential of quantitative functional assessment of cartilage in vivo. The results in this study indicate T2 values over the posterior weight-bearing portion were higher in young dancers than age-matched healthy volunteers even though cartilage thickness and volumes were not significantly different between two cohorts. They also reiterate the importance of taking into account of the regional/angular dependency in such assessment where a comparison based on gross overall average over the cartilage might not be able to reveal any difference.Acknowledgements
Funding source: Institute for Clinical & Translational Science (ICTS) at University of California, Irvine, School of Medicine/Clair Trevor School of Arts Grant: T2 and T1ρ cartilage mapping of the ankle joint of ballet dancers.References
No reference found.Figures