5102
Orientation anisotropy of quantitative MRI relaxation parameters in articular cartilage1Department of Applied Physics, University of Eastern Finland, Kuopio, Finland, 2Research Unit of Medical Imaging, Physics and Technology, University of Oulu, Oulu, Finland, 3Medical Research Center Oulu, Oulu University Hospital and University of Oulu, Oulu, Finland, 4Department of Diagnostic Radiology, Oulu University Hospital, Oulu, Finland, 5Diagnostic Imaging Center, Kuopio University Hospital, Kuopio, Finland
Synopsis
Classical and several rotating frame quantitative MR relaxation parameters have been used for evaluation of composition and structure of articular cartilage, and demonstrated to have variable sensitivity to orientation of the tissue in magnetic field. The orientation dependence of several relaxation parameters in articular cartilage have been previously investigated and were now further analyzed and compared to polarized light microscopy results. T1, adiabatic T1ρ with HS1 pulse and CW-T1ρ at 2 kHz spin-lock demonstrated the least orientation dependence. Usefulness of the parameters for osteoarthritis diagnostics, as reported in the literature, was evaluated together with the orientation sensitivity.
Purpose
The amount of relaxation anisotropy varies between different quantitative MRI (qMRI) relaxation parameters. T1 has been shown not to be sensitive to orientation1, whereas T2 and continuous wave (CW) T1ρ have been shown to have excessive sensitivity to orientation2,3. For CW-T1ρ, reduction of orientation sensitivity in articular cartilage has been reported with increasing spin-lock powers2,4. The purpose of this study was to further investigate and analyze the orientation dependence of different qMRI parameters and evaluate them against collagen fibril orientation and anisotropy, as measured by quantitative polarized light microscopy (qPLM). Orientation sensitivity was evaluated together with usefulness of the parameters for osteoarthritis (OA) diagnostics, as reported in literature.Methods
Cylindrical osteochondral plugs (n=4, diameter=6mm) from visually intact bovine patella were prepared. The samples were immersed in perfluoropolyether in a holder, which allowed rotation of the specimens with respect to the B0. MRI scans were conducted at 9.4 T using a 19 mm quadrature RF volume transceiver and VnmrJ3.1 Varian/Agilent DirectDrive console. The samples were imaged at seven different orientations (0-90 degrees) with respect to B0. The orientation was confirmed from scout images and later measured from 3-D gradient echo (GRE) data. Relaxation time measurements were realized using a global preparation block coupled to fast spin echo readout (TR=5s, ESP=5.5ms, ETL=8, matrix=256x64, FOV=16x16mm, 1mm slice, resolution along cartilage depth 62.5μm). Imaging slice was positioned at the center of the specimen, perpendicular to the axis of specimen rotation and was rotated with the specimen. The measurements included T1 relaxation time with inversion recovery, T2 with spin echo preparation, CW-T1ρ with four spin-lock amplitudes (γB1=250, 500, 1000 and 2000Hz), adiabatic T1ρ with HS1, HS4 and HS8 pulses (τp=4.5ms, and γB1,max=2.5, 1.2 and 1.04kHz, respectively, to match RMS power between the pulse shapes)5, adiabatic T2ρ with HS1-train embedded between adiabatic half passages and TRAFF6 (γB1,max=625Hz, τp=9ms). T2* relaxation time was measured using multi-echo-GRE. All measurements were repeated for every orientation. After the MRI studies, the samples were fixed in 10% formalin for qPLM measurements of collagen fibril orientation and anisotropy.
Some of the data have been previously reported7, and were re-analyzed in the present study. Depth-wise relaxation time profiles were calculated for each orientation, and relaxation anisotropy was calculated from these. PLM anisotropy profiles were similarly calculated. Anisotropy profiles were calculated for each sample as Michelson contrast8,9 and averaged after normalizing with the thickness of cartilage. Correlations between the anisotropy profiles of different MRI parameters and PLM were calculated per sample. The anisotropies of the parameters were compared by calculating average values for deep cartilage (from 40 to 80% of depth). Average anisotropies of the parameters were plotted against the relative changes of the parameters between early OA and advanced OA, as found in various different models in literature10–15.
Results
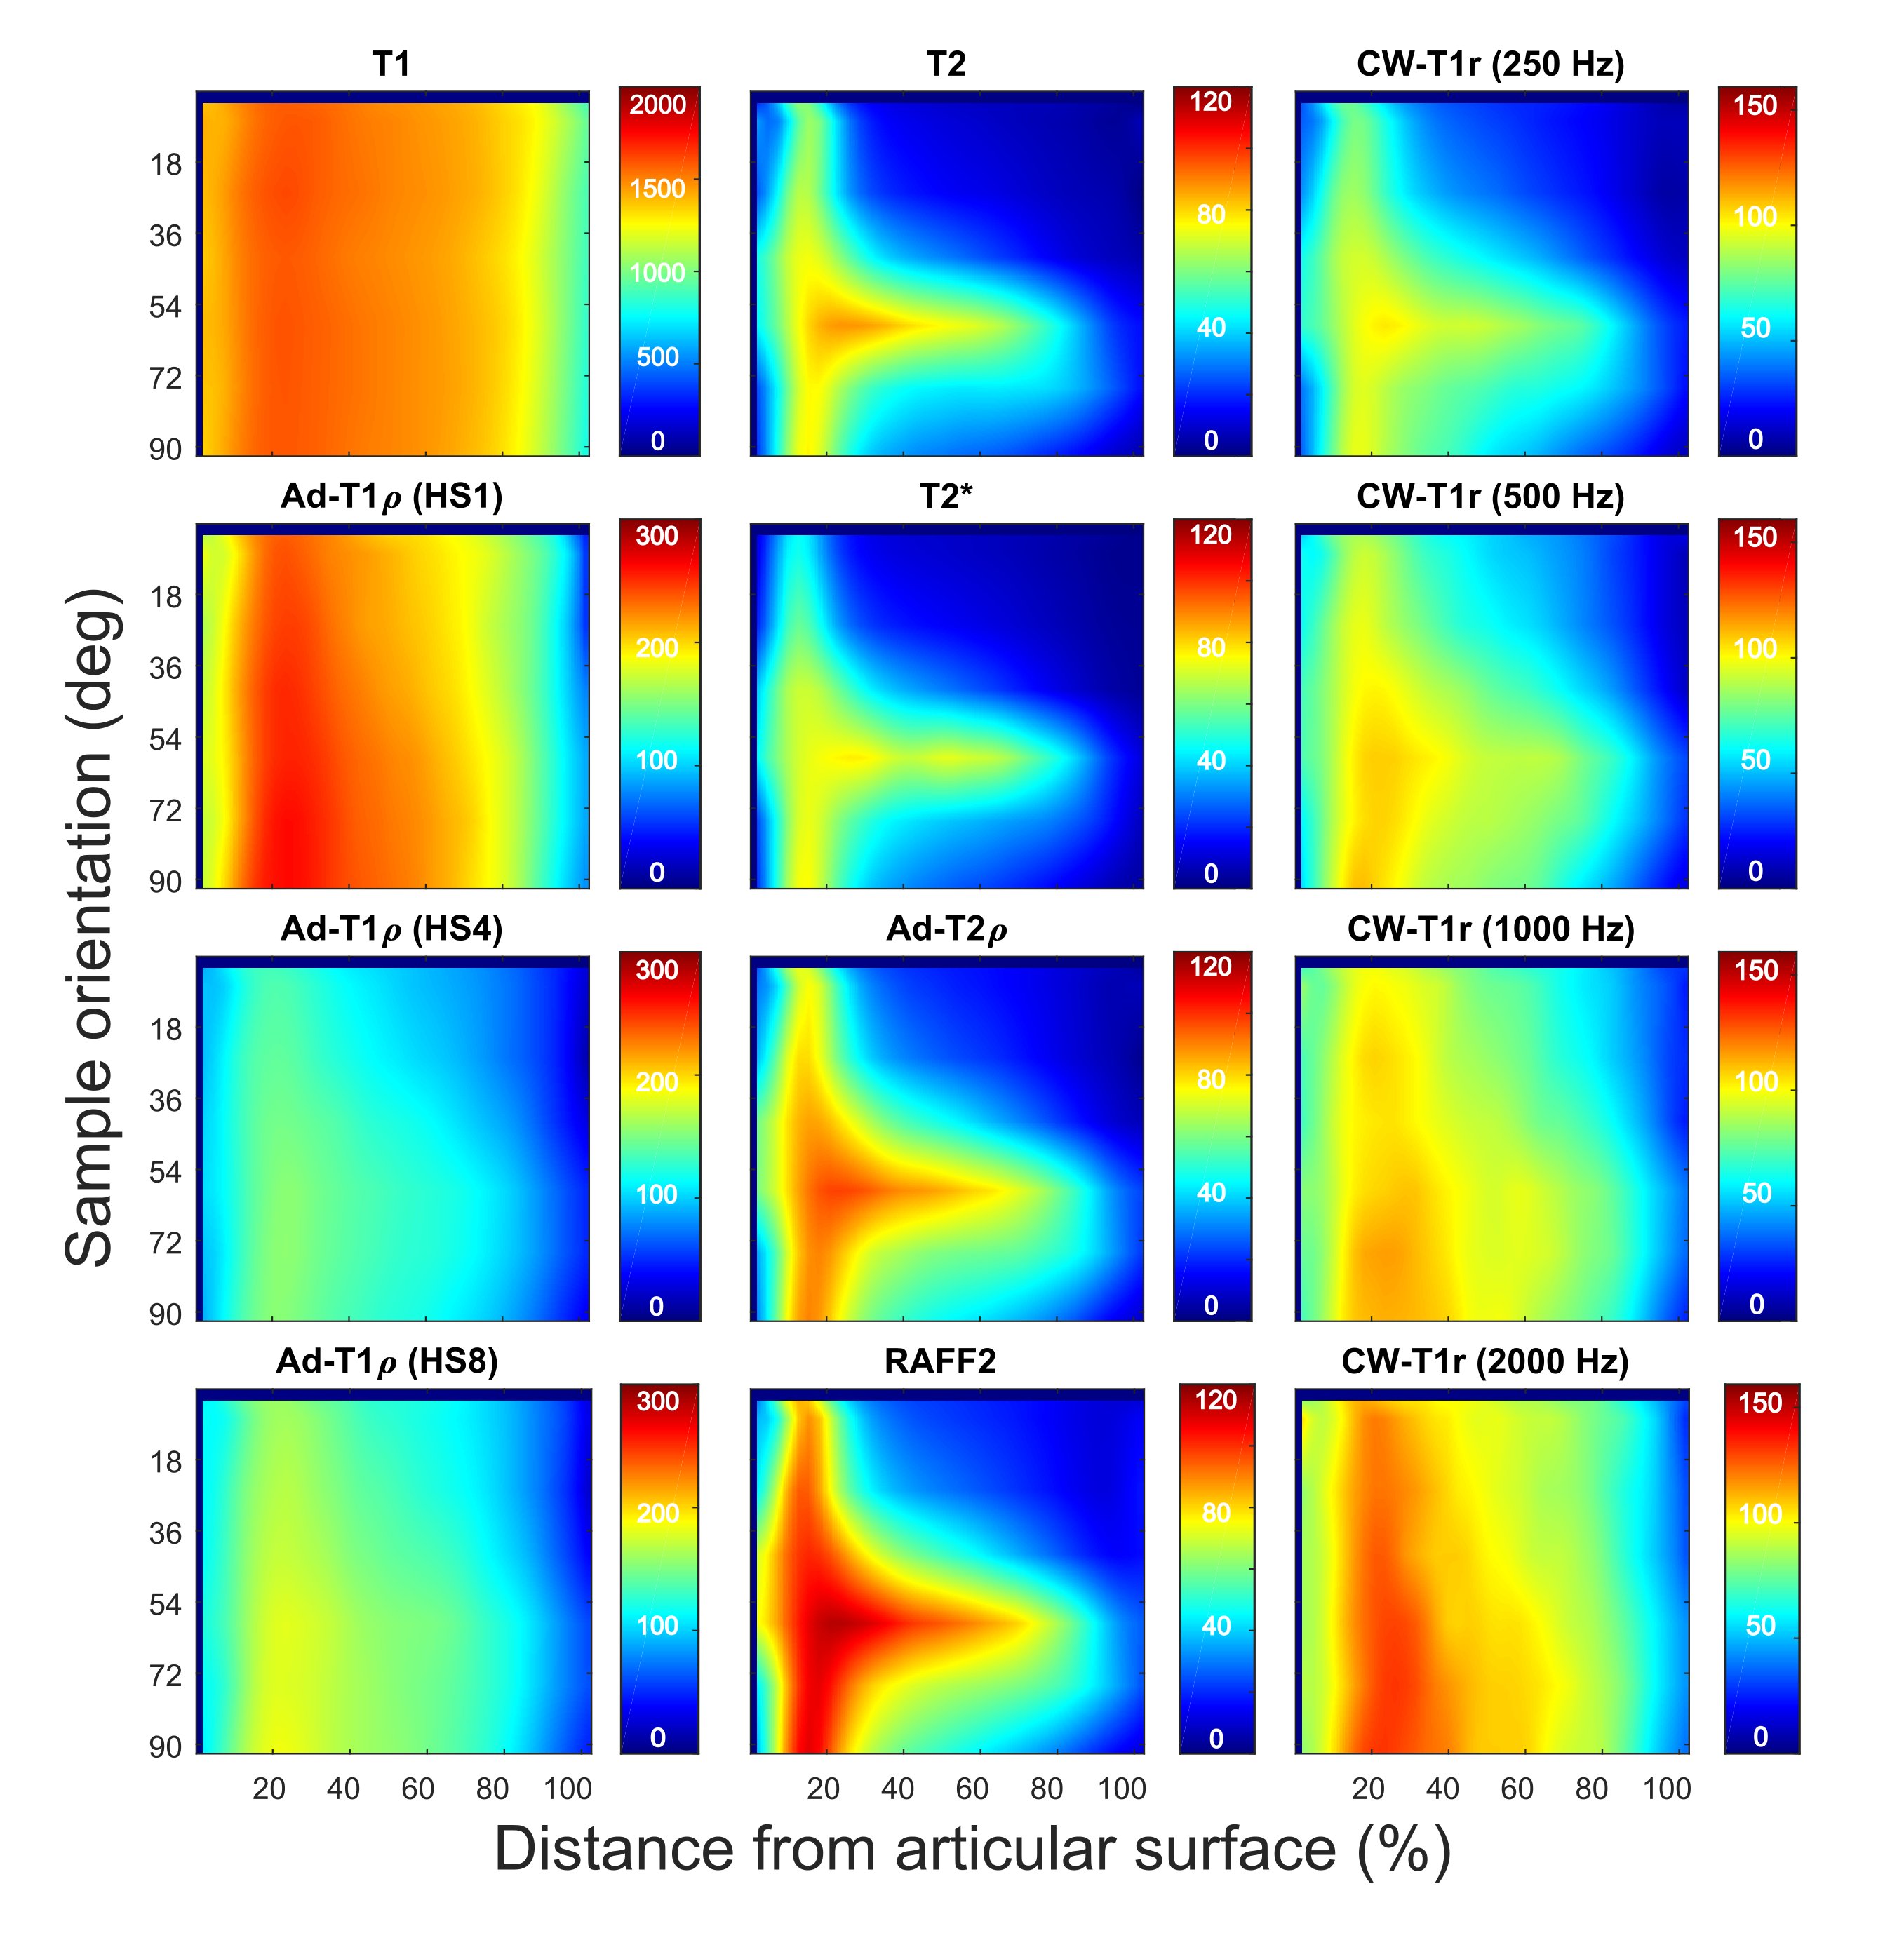
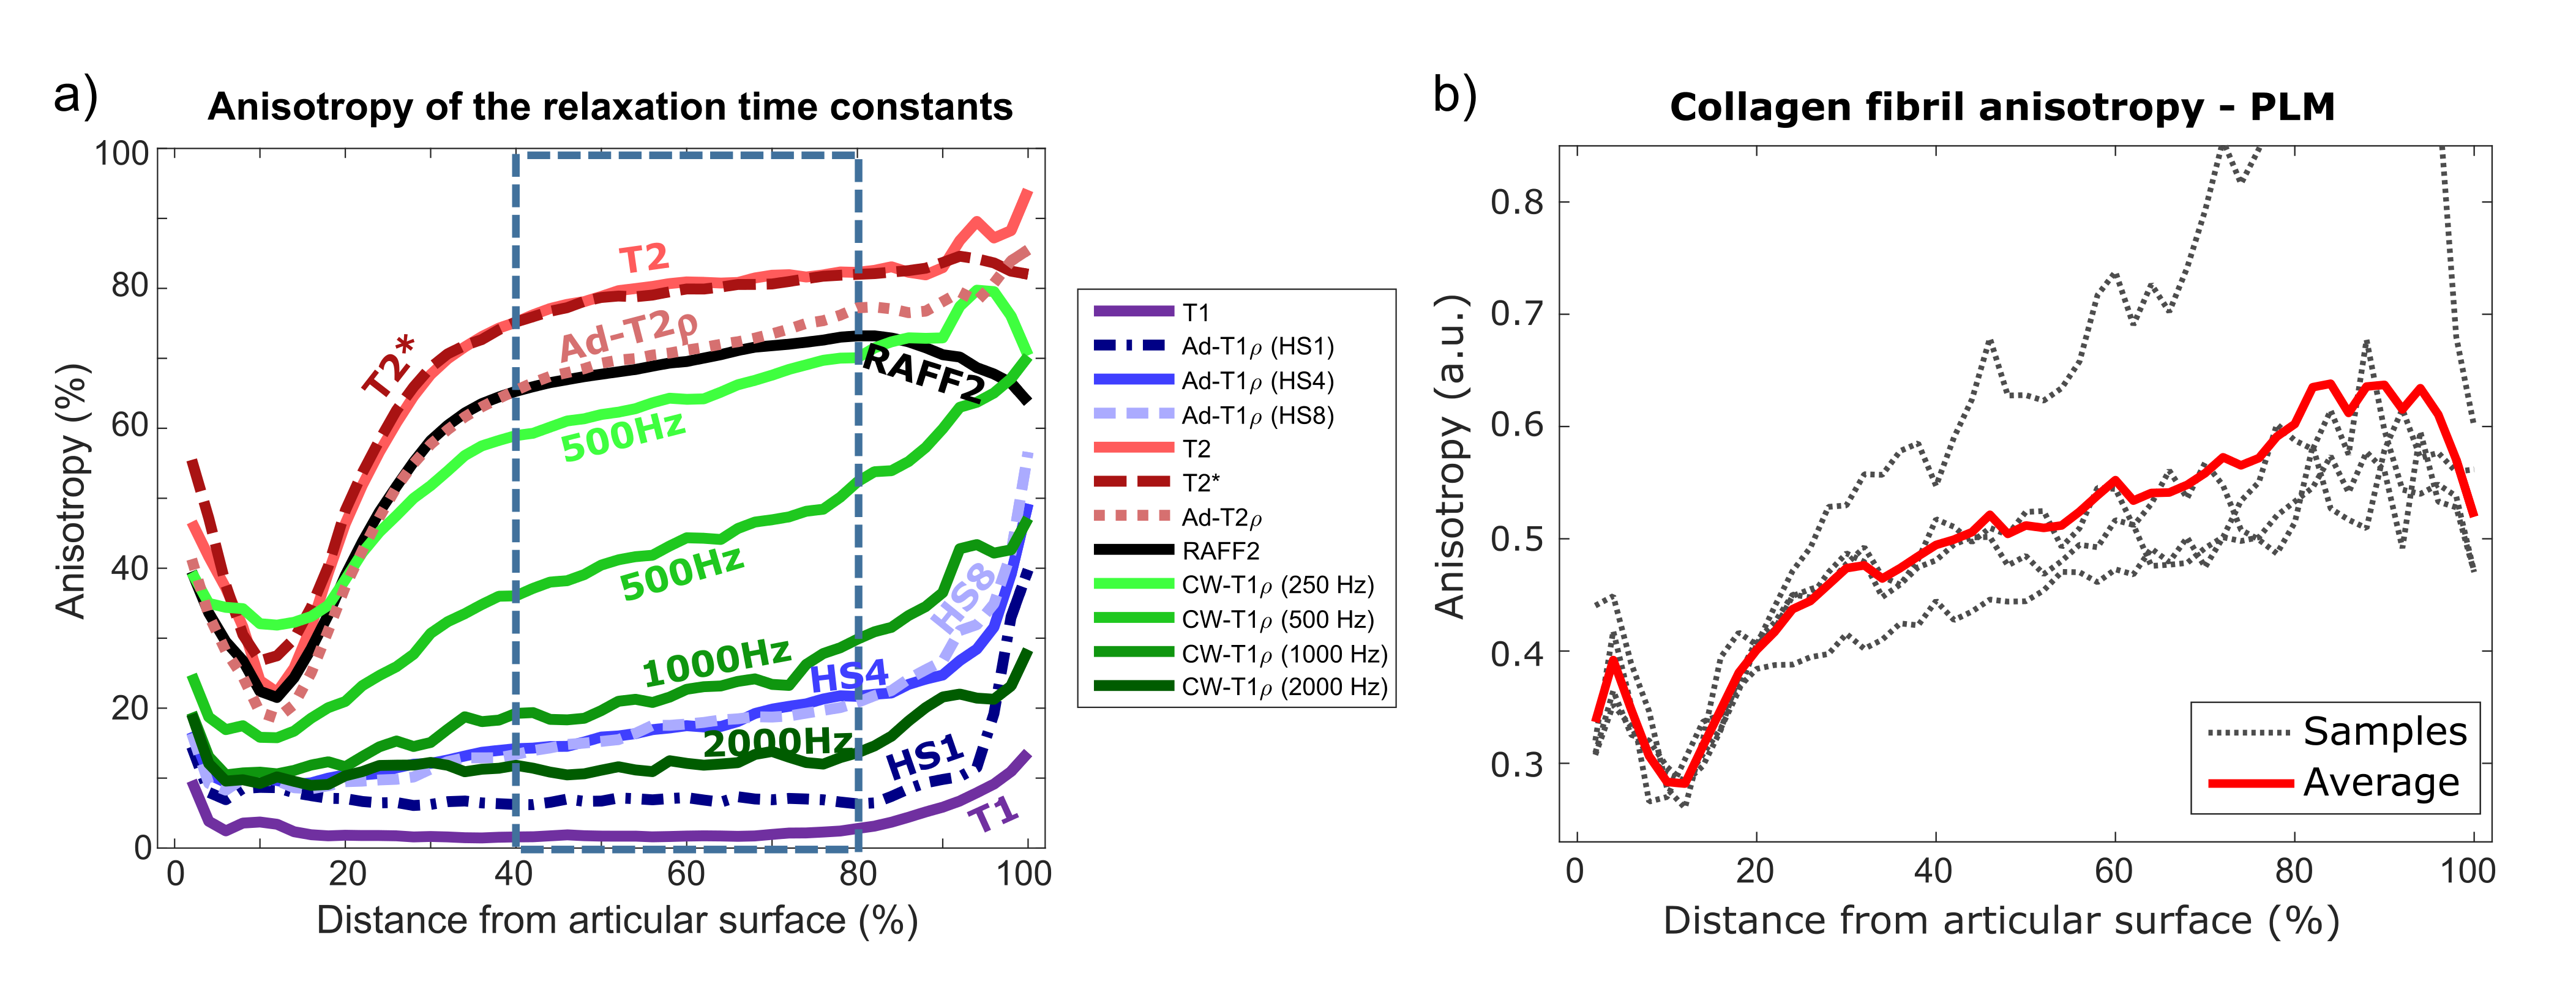
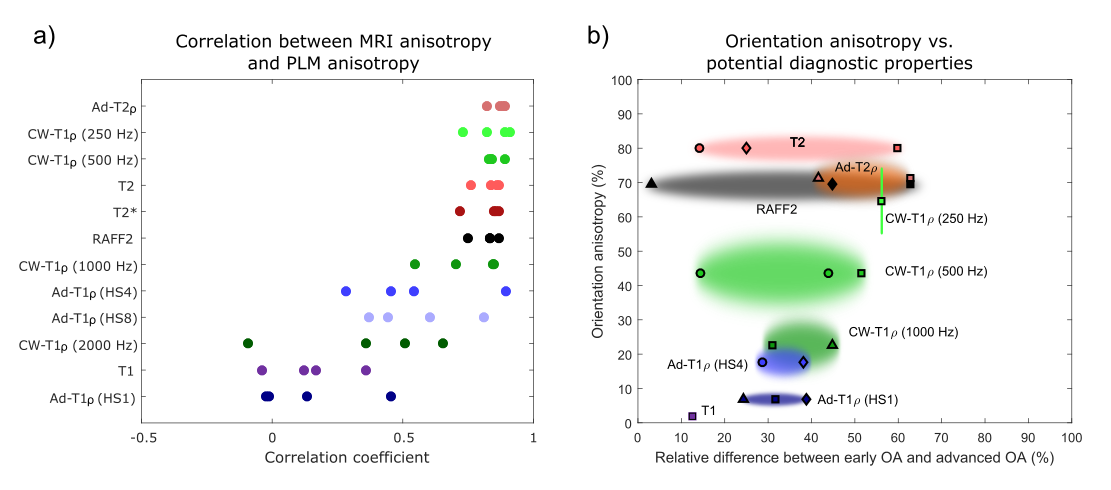
Interpolated depth-wise relaxation time profiles over the 90-degree orientation range visualize the differences in the orientation sensitivities of the parameters (Fig. 1). T1 relaxation time, T1ρ with HS1 pulse modulation and CW-T1ρ at 2 kHz spin-lock amplitude showed the least variation, while T2, T2*, adiabatic T2ρ and TRAFF had the highest sensitivity to sample orientation, especially in the deep tissue. For MRI parameters exhibiting the orientation sensitivity, anisotropy changes as a function of depth (Fig. 2a): minimum observed at the transitional zone, higher relaxation anisotropy at the surface and the maximum in the deep tissue, resembling the true collagen network anisotropy (Fig. 2b). T1ρ with HS1 pulse and T1 had the lowest correlations with qPLM anisotropy, while adiabatic T2ρ, CW-T1ρ at 250 and 500 Hz, T2, T2* and TRAFF all had relatively strong correlations (Fig 3a). Broadly, parameters with higher sensitivity to orientation anisotropy also demonstrated largest relative differences between intact and degenerated articular cartilage (Fig. 3b).Discussion and Conclusion
Practical usefulness of qMRI parameters depends on how well they can be used in diagnosis of diseases. The most optimal parameter would exhibit zero sensitivity to orientation while having the maximum sensitivity to tissue degeneration or to changes in tissue properties. The correlation of the anisotropy of the qMRI parameters with the qPLM anisotropy indicates the sensitivity of different parameters to geometrical factors of the scan setup. In many cases, the orientation of a subject in an MRI scanner cannot be altered and, thus, these parameters may not provide unambiguous information of the tissue status.
Based on the literature findings and the measured relaxation anisotropies, parameters with higher sensitivity to orientation anisotropy generally also demonstrated larger relative differences between intact and degenerated articular cartilage. The quest for the most optimal MRI parameter for osteoarthritis diagnostics remains open.
Acknowledgements
Support from the Academy of Finland (grants #285909, #293970, #297033 and #303786) and European Research Council (project #336267) is gratefully acknowledged. The authors wish to thank Mr. Hassaan Elsayed for the sample-rotation holder.References
1. Xia Y. Relaxation anisotropy in cartilage by NMR microscopy (µMRI) at 14-µm resolution. Magn Reson Med. 1998;39(6):941–9.
2. Akella SVS, Regatte RR, Wheaton AJ, Borthakur A, Reddy R. Reduction of residual dipolar interaction in cartilage by spin-lock technique. Magn Reson Med. 2004;52(5):1103–9.
3. Wang N, Xia Y. Dependencies of multi-component T2 and T1ρ relaxation on the anisotropy of collagen fibrils in bovine nasal cartilage. J Magn Reson. 2011;212(1):124–32.
4. Wang N, Xia Y. Depth and orientational dependencies of MRI T2 and T1ρ sensitivities towards trypsin degradation and Gd-DTPA 2- presence in articular cartilage at microscopic resolution. Magn Reson Imaging. 2012;30(3):361–70.
5. Garwood M, DelaBarre L. The return of the frequency sweep: designing adiabatic pulses for contemporary NMR. J Magn Reson. 2001;153:155–77.
6. Liimatainen T, Sorce DJ, O’Connell R, Garwood M, Michaeli S. MRI contrast from relaxation along a fictitious field (RAFF). Magn Reson Med. 2010;64(4):983–94.
7. Rautiainen J, Rieppo L, Saarakkala S, Nissi MJ. Orientation anisotropy of quantitative rotating and laboratory frame relaxation parameters in articular cartilage. In: Proceedings of International Society for Magnetic Resonance in Medicine. 2016. p. 62–5.
8. Michelson AA. Studies in Optics. Chicago: The University of Chicago Press; 1927.
9. Rieppo J, Hallikainen J, Jurvelin JS, Kiviranta I, Helminen HJ, Hyttinen MM. Practical considerations in the use of polarized light microscopy in the analysis of the collagen network in articular cartilage. Microsc Res Tech. 2008;71(4):279–87.
10. Borthakur A, Mellon E, Niyogi S, Witschey W, Kneeland JB, Reddy R. Sodium and T1ρ MRI for molecular and diagnostic imaging of articular cartilage. NMR Biomed. 2006;19:781–821.
11. Li X, Benjamin Ma C, Link TM, Castillo DD, Blumenkrantz G, Lozano J, et al. In vivo T1ρ and T2 mapping of articular cartilage in osteoarthritis of the knee using 3T MRI. Osteoarthr Cartil. 2007;15(7):789–97.
12. Casula V, Autio J, Nissi MJ, Auerbach EJ, Ellermann J, Lammentausta E, et al. Validation and optimization of adiabatic T1ρ and T2ρ for quantitative imaging of articular cartilage at 3 T. Magn Reson Med. 2016.
13. Rautiainen J, Nissi MJ, Salo E-N, Tiitu V, Finnilä M a J, Aho O-M, et al. Multiparametric MRI assessment of human articular cartilage degeneration: Correlation with quantitative histology and mechanical properties. Magn Reson Med. 2014;74(May):249–59.
14. Rautiainen J, Nissi MJ, Liimatainen T, Herzog W, Korhonen RK, Nieminen MT. Adiabatic rotating frame relaxation of MRI reveals early cartilage degeneration in a rabbit model of anterior cruciate ligament transection. Osteoarthr Cartil. 2014;22(10):1444–52.
15. Ellermann J, Ling W, Nissi MJ, Arendt E, Carlson CS, Garwood M, et al. MRI rotating frame relaxation measurements for articular cartilage assessment. Magn Reson Imaging. 2013;31(9):1537–43.
Figures