5101
Texture characteristics of articular cartilage of patients with articular cartilage osteoarthritis based on MR T2 mapping imagesShan Wang1, Cui-Ping Ren1, Jing-Liang Cheng1, and Zhi-zheng Zhuo2
1The First Affiliated Hospital of Zhengzhou University, ZhengZhou, People's Republic of China, 2Clinical Science, Philips Healthcare, Beijing, People's Republic of China
Synopsis
We tried to evaluat OA by using the T2 mapping and the texture characteristics. Thirty-seven patients and sixteen healthy volunteers were recruited in this study. The results showed that the T2 value is higher in patients than in controls and some texture characteristics in two groups are different. It can be concluded that texture analysis combined with T2 maping are an useful tool for diagnosis of OA patients.
Purpose
Osteoarthritis(OA) has been defined as a heterogeneous group of conditions that leads to joint symptoms and signs which are associated with defective integrity of articular cartilage, in addition to related changes in the underlying bone at the joint margins1. The degeneration of articular cartilage has been proved to be an important sign in the development of OA.T2 mapping was sensitive to the content changes of articular cartilage and can be used to evaluate the articular cartilage situation of OA patients2.However, the detection rates of early degeneration still remain moderate. In this study, we furtherly evaluated the OA by combining the T2 mapping and the texture characteristics extracted from the T2 mapping images within 7 separated regions of articular cartilage. Besides, based on T2 value and texture parameters, multiple classifiers were selected to furtherly differentiate the OA patients from normal controls.Methods
The study was approved by the Zhengzhou University First Affiliated Hospital’s institutional review board.Thirty-seven patients(aged45.4±1.59 years old;12 males and 26 females) with OA and sixteen healthy volunteers(aged35.2±2.54 years old;7 males and9 females)were recruited in this study. All subjects were evaluated by using the Western Ontario and McMaster Universities Osteoarthritis Index (WOMAC) for OA severity. Each subject underwent a MR scanning by using a 3T MRI scanner (Ingenia, Philips Healthcare, Best, the Netherlands) with an 8-chanel knee receiver coil. A multi-echo TSE-based sequence was performed for T2 mapping image calculation with the below protocol parameters: multi-slice sagittal acquisition, 6 echos with first TE=10ms and delta TE=10ms, TR=2000ms, FA=90°,FOV=100mm×100mm, voxel size=0.5mm×0.5mm,slice thickness=2.5mm, no slice gap, sense factor=2, fold-over direction=AP, totally 40 slices were scanned within 12mins. T2 values were extracted from 7 separated articular cartilage ROIs (Regions of Interest) (as shown in figure 1) and the texture parameters (based on histogram, co-occurrence matrix, run-length matrix, absolute gradient) were extracted within the 7 regions by using Mazda software. Finally, 77×7 parameterswere obtained for each subject. Two-sample T-test was carried out to compare the difference between OA patients and normal controls for each parameter and for each ROI. The parameter within a specific ROI which showed a significant difference according to the Student’s T-test was selected to form a feature vector for each subject. Classification of the subjects based on feature vectors were performed by using Artificial Neuro Network (ANN), Random Forest(RF), Naive Bayes(NB) and Linear Discriminant Analysis(LDA) methods.Result
For the 7 regions as a whole,the mean T2 values were 52.62±0.777ms in patients and 50.11±1.141ms incontrols(P<0.05). In patients, the most vulnerable parts of the knee are ROI4, ROI3 and ROI1, and the T2 value are 68.73± 9.538ms,60.622±8.271ms and 57.622±6.897ms respectively.For all the 7 ROIs, the texture parameters showed a significant difference (p<0.05) were summarized in Table 1. Some texture features extracted from ROI1, ROI2, ROI4, ROI5 and ROI6 showed a significant difference (P<0.05).Texture parameters within ROI5 showed the most significant difference.The results of classification using different classifiers were showed in Table 2.The ANN showed the best performance with a high classification accuracy (79.25%) compared to other classifiers.Discussion
This is a pilot study aiming to demonstrate the feasibility of using texture analysis to characterize the spatial distribution of T2 values within articular cartilage in OA patients. Compared to the normal controls, the increased T2 values and some other changed texture parameters may be related to the cartilage degeneration. Besides, some of the texture parameters extracted from ROI1, ROI2, ROI4, ROI5 and ROI6 showed a significant difference.In clinic, the diagnosis of OA mainly rely on the clinical symptom, related clinical evaluation and morphological imaging examination,which can’t diagnose disease earlier. The classification results showed that the texture analysis would provide more OA related features to differentiate the OA patients which would help doctors through a more non-objectively and reliable way. In future study, we will conduct a larger groups of OA patients, which will be grouped according to Kellgren Lawrence(KL)score(0-4),in order to investigate the feasibility of the above model as a potential surrogate marker for early cartilage degeneration.Conclusions
Texture parameters based on T2 mapping images are effective to demonstrate the characteristics within the articular cartilage of OA patients. And classifier such as ANN is able to identify patients with a high accuracy by using texture parameters, which might be helpful for the understanding and early detection of OA.Acknowledgements
No acknowledgement found.References
1 Buckwalter JA,Mankin HJ.Articular cartilage:Degeneration and osteoarthrosis,repair,regeneration,and transplantation.Instr Course Lect.1998;47:487-504.
2 Mosher TJ,Dardzinski BJ.Cartilage MRI T2 relaxation time mapping:overview and applications. Semin Musculoskelet Radiol.2004;8(4):355-368.
Figures
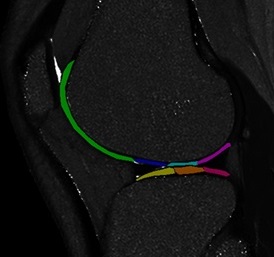
Figure 1. Definition of the 7 articularcartilage segmented
sub-compartments:ROI1, anterior femoral(green); ROI2, femoral cartilage
adjacent to the anterior horns (deep blue); ROI3, femoral cartilage adjacent to the central meniscus
(light blue); ROI4, femoral cartilage adjacent to the posterior horns (purple);
ROI5, tibial cartilage adjacent to the anterior horns (yellow); ROI6, tibial cartilage adjacent to the central
meniscus(brown); ROI7, tibial cartilage adjacent to the posterior horns(deepred).
And showed on a T2 mapping image
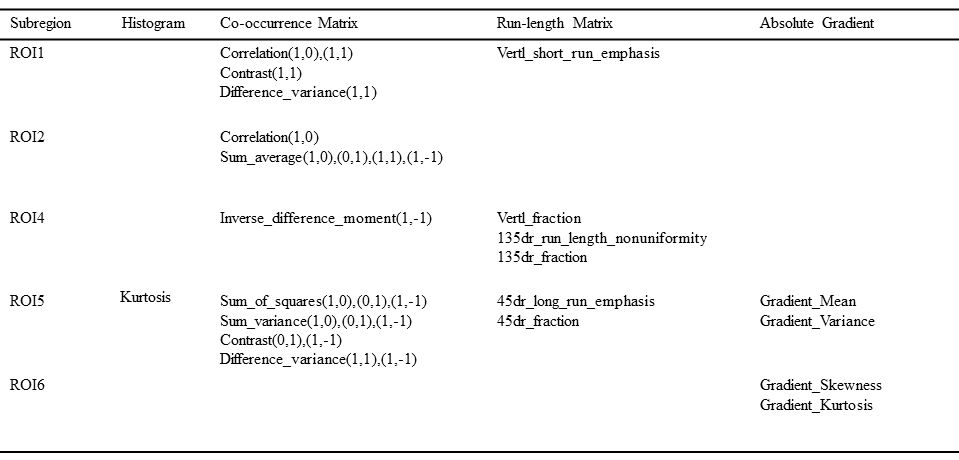
Table 1. The summary of texture parameters showed significant difference
by Two sample Student’s T-test (P<0.05). Note: (1,0),(1,1),(0,1),(1,-1) indicate the co-occurrence matrix with distance=1
pixeland with angles = 0°, 45°, 90° and 135°; Vertl means vertical, 45dr means 45°;
135dr means 135°.
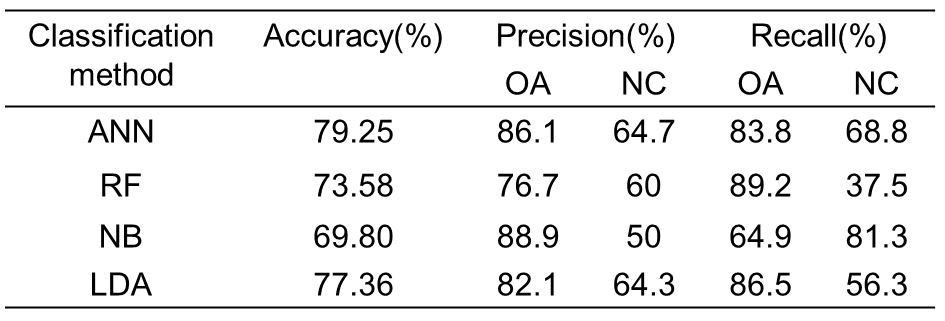
Table 2. The classification results of multiple classifiers by using the selected
texture features. ANN:Artificial Neuro Network, RF:Random
Forest, NB:Naive Bayes and LDA:Linear Discriminant Analysis.