5099
Cartilage mapping in asymptomatic hips with cam-type FAI: Does the MRI T1ρ profile change over time?1Medical Imaging, The Ottawa Hospital, Ottawa, ON, Canada, 2Radiology, University of Ottawa, Ottawa, ON, Canada, 3Orthopaedic Surgery, The Ottawa Hospital, Ottawa, ON, Canada, 4Faculty of Medicine, University of Ottawa, Ottawa, ON, Canada
Synopsis
In this study, we investigated whether the T1ρ profile of the hip cartilage changes over time in a subject group with asymptomatic cam-type femoroacetabular impingement (FAI). After the initial T1ρ data acquisitions, the scans were repeated on the same group in a mean time interval of 3.3 years. For the majority of the subject group there were no significant T1ρ changes in the whole joint and in different hip cartilage regions. However, 1 patient (out of 12) showed significant (>20%) increased T1ρ values (i.e. proteoglycan reduction).
Introduction
Cam deformity of the femoral head-neck junction may lead to osseous conflict with the acetabular rim and may predispose to femoroacetabular Impingement (FAI) and osteoarthritis (OA)1,2. However, not all individuals with a cam deformity are symptomatic. What changes, if any, take place in the hip cartilage of asymptomatic cam-type FAI hips is unknown but such knowledge would be important to guide management. Quantitative T1ρ MRI has the potential to detect early biochemical changes in the cartilage due its sensitivity to the proteoglycan (PG) content3. Increased T1ρ values, reflecting lower PG content, have been found in the antero-lateral region of the joint in symptomatic cam-type FAI hips, compared to asymptomatic controls, possibly representing the early stages of OA4. The aim of this study was to determine: Firstly, if asymptomatic hips with a cam deformity develop cartilage degeneration over time and secondly, whether any change in T1ρ is associated with the onset of symptoms.
Methods
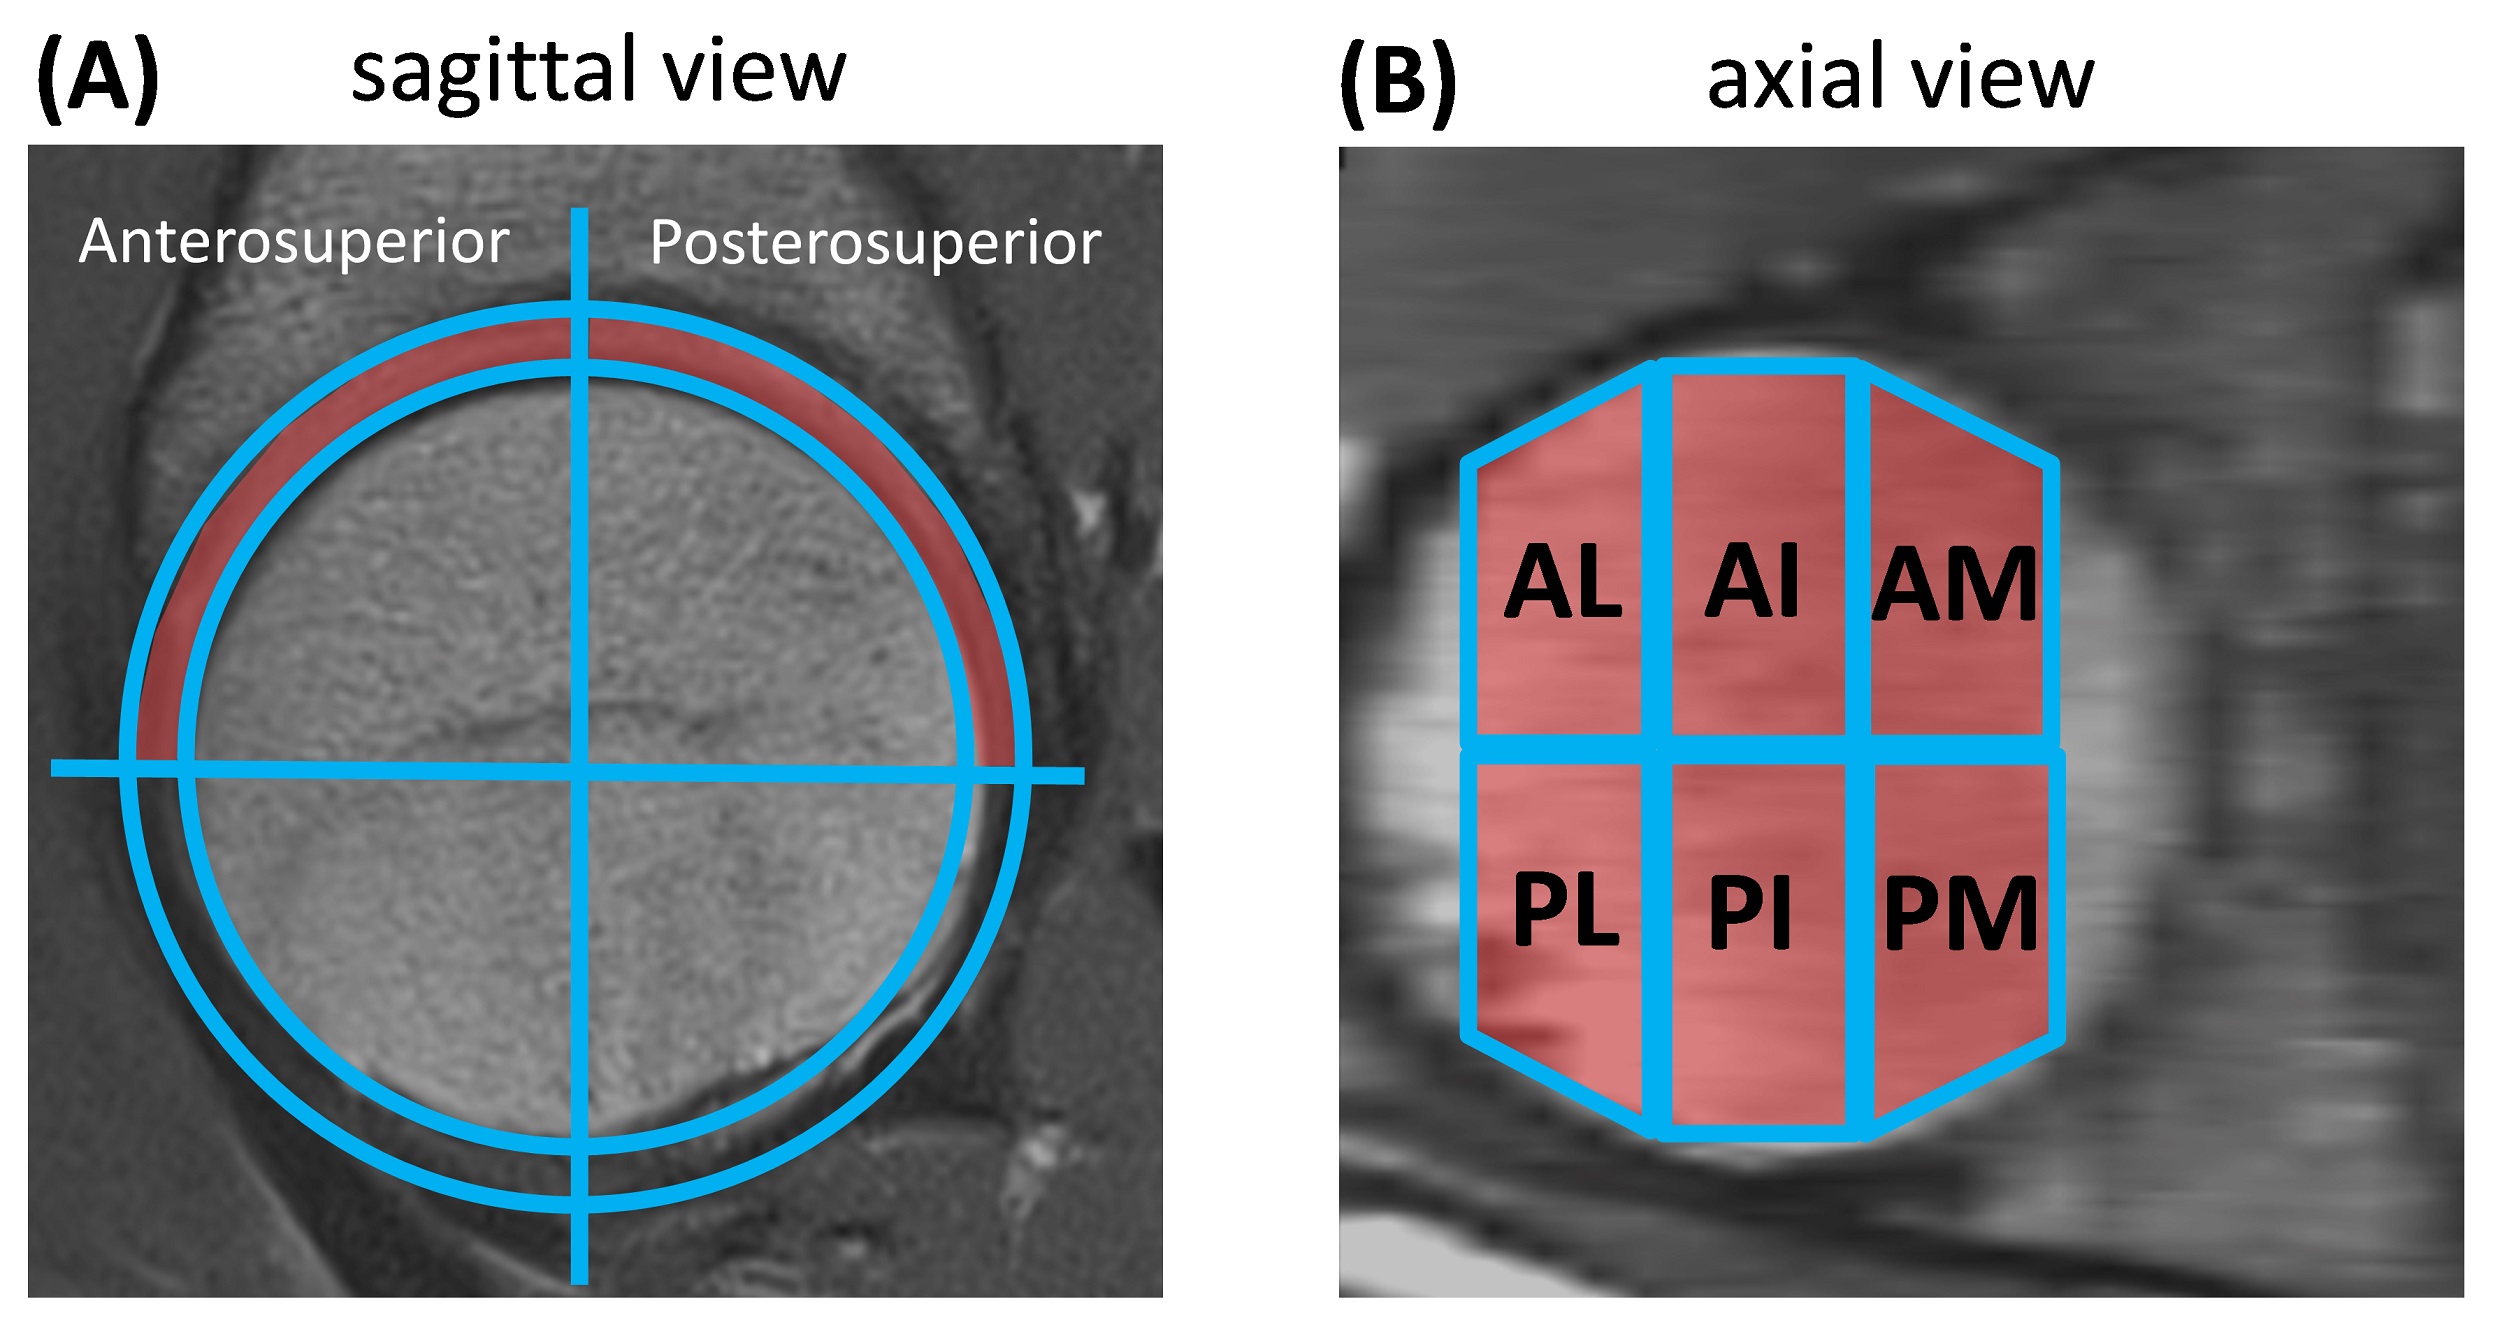
Twelve subjects/hips [11 males/1 female, mean age: 32.8 years (range: 26.8-44.4)] with an asymptomatic cam deformity were recruited. Inclusion criteria were: no previous hip pathology/surgery, no signs of OA based on radiographic assessments, WOMAC score (>90) at initial MRI, the presence of cam deformity based on axial imaging and consecutive T1ρ MRI scans with a minimum scan interval of 1 year (mean interval: 3.3 years; range: 1.5-4.7). T1ρ mapping was performed on a 1.5T MRI scanner (Siemens) using a spin-lock preparation module combined with a TSE acquisition scheme in a sagittal oblique orientation. Further parameters: FOV = 180x180mm2, slices = 22, slice thickness = 3mm, matrix = 384x384, resolution = 0.47x0.47mm2, TR = 274ms, TE = 13ms. Five different spin-lock times (TSL) of 12/18/25/35/45ms and a spin-lock field of B1 = 400Hz were used. The total scan time for T1ρ imaging was 21 minutes. The cartilage was segmented as a bilayer in seven to eight slices, starting from the lateral sourcil margin and extending medially. The joint was subdivided into anterior and posterior regions and the slices were divided into lateral, intermediate or medial zones, resulting in six region of interest (ROI): Antero-Lateral (AL), Antero-Intermediate (AI), Antero-Medial (AM), Postero-Lateral (PL), Postero-Intermediate (PI) and Postero-Medial (PM) (Figure 1). The differences in T1ρ values (ΔT1ρ) and were calculated as: ΔT1ρ = T1ρFollowUp–T1ρInitial and relative differences (%ΔT1ρ) = ΔT1ρ/ T1ρInitial. A %ΔT1ρ greater 10% was considered significant, as the normal variability of T1ρ values between ROI can be up to 10%. Statistical analysis was performed with SPSS (v.23, IBM Corp.) using non-parametric tests, with statistical significance set at p<0.05.Results
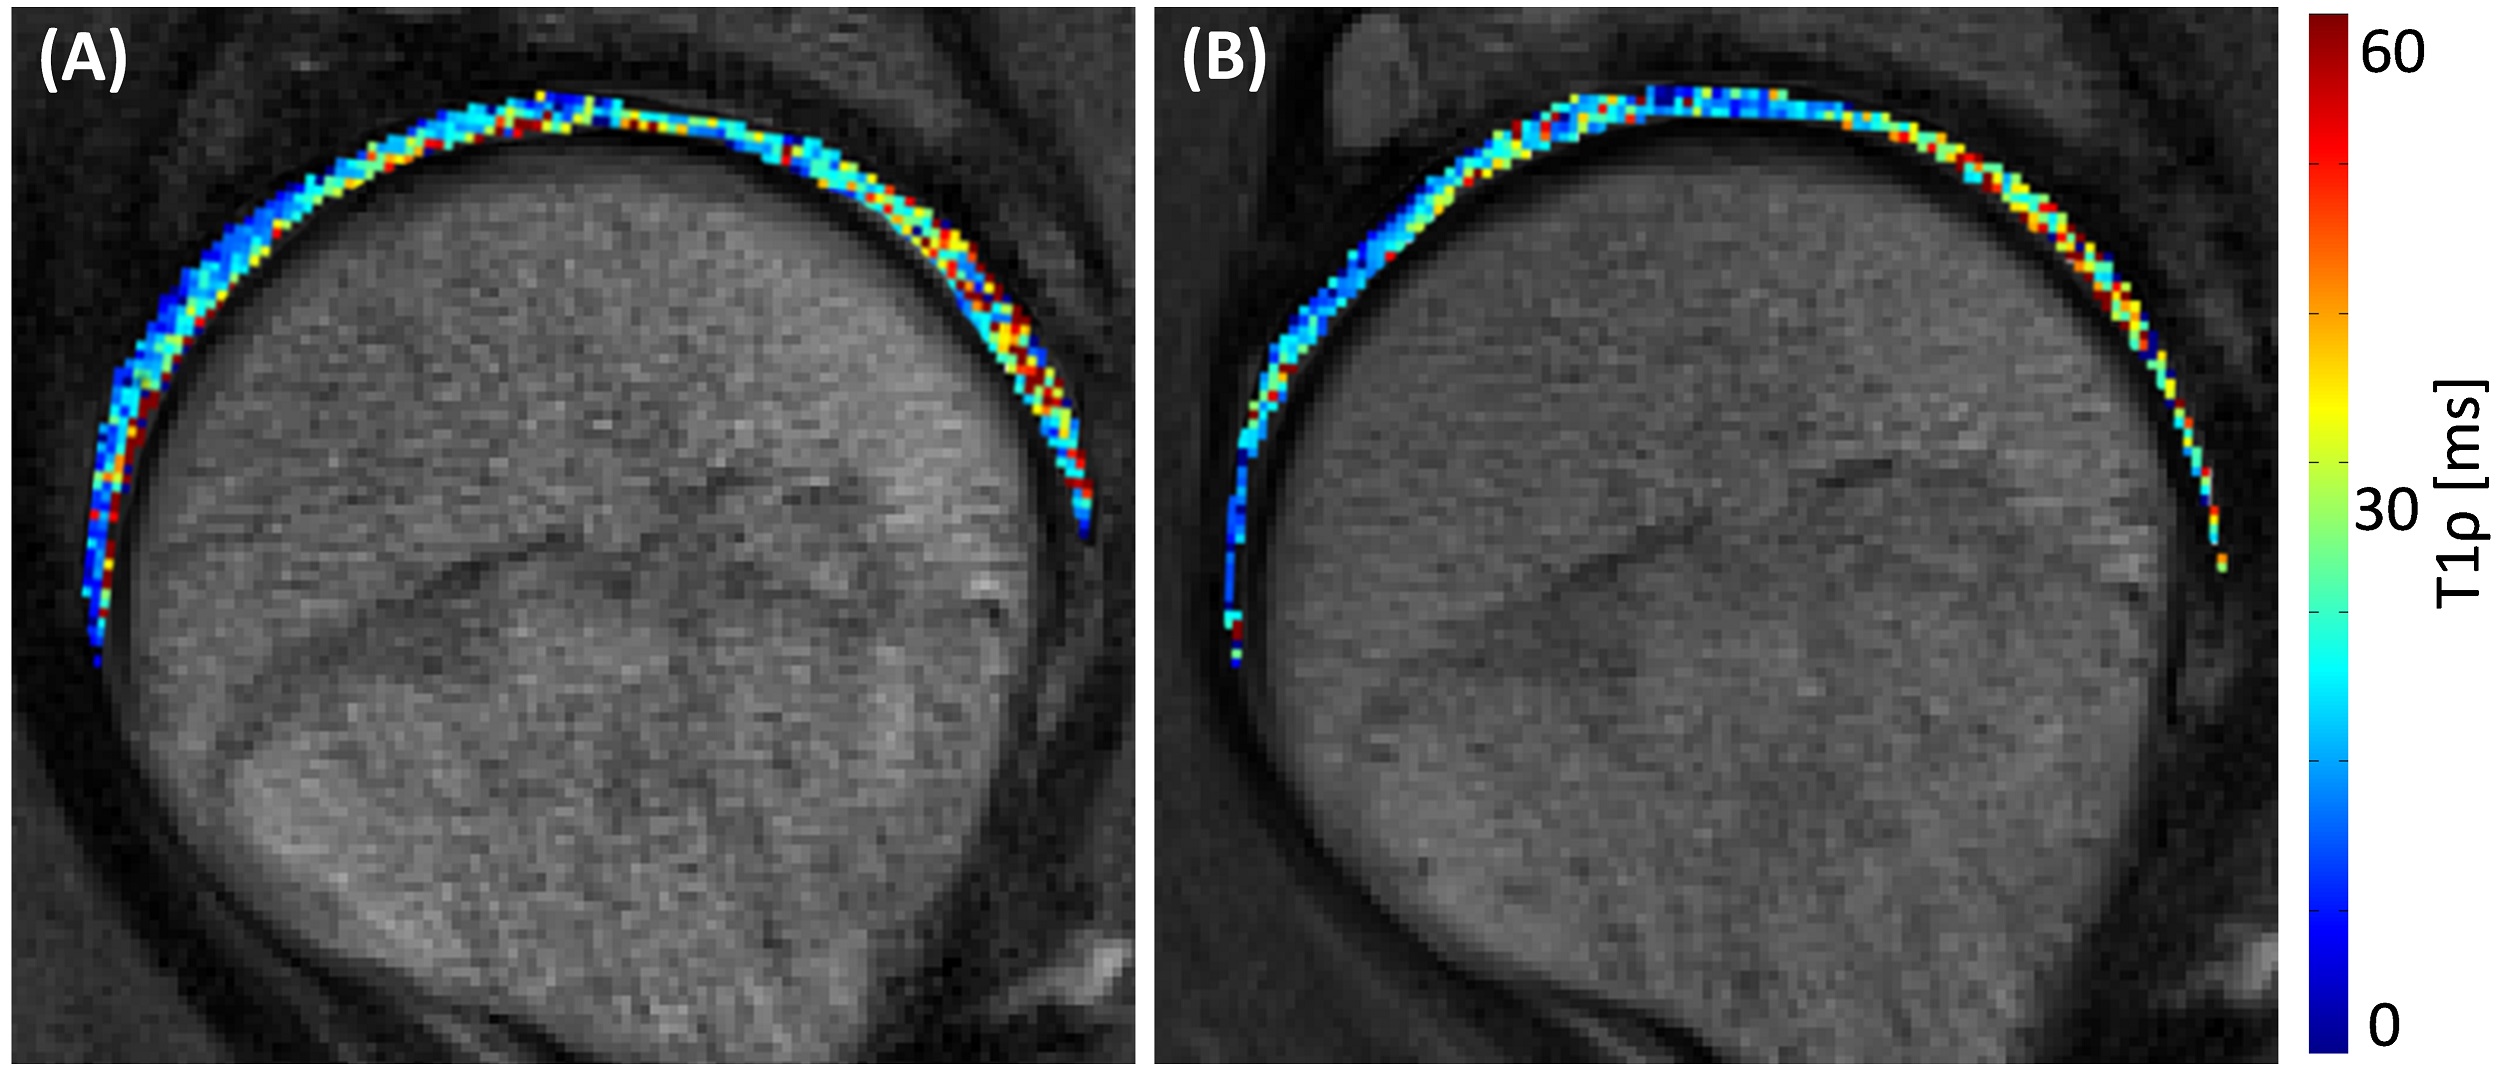
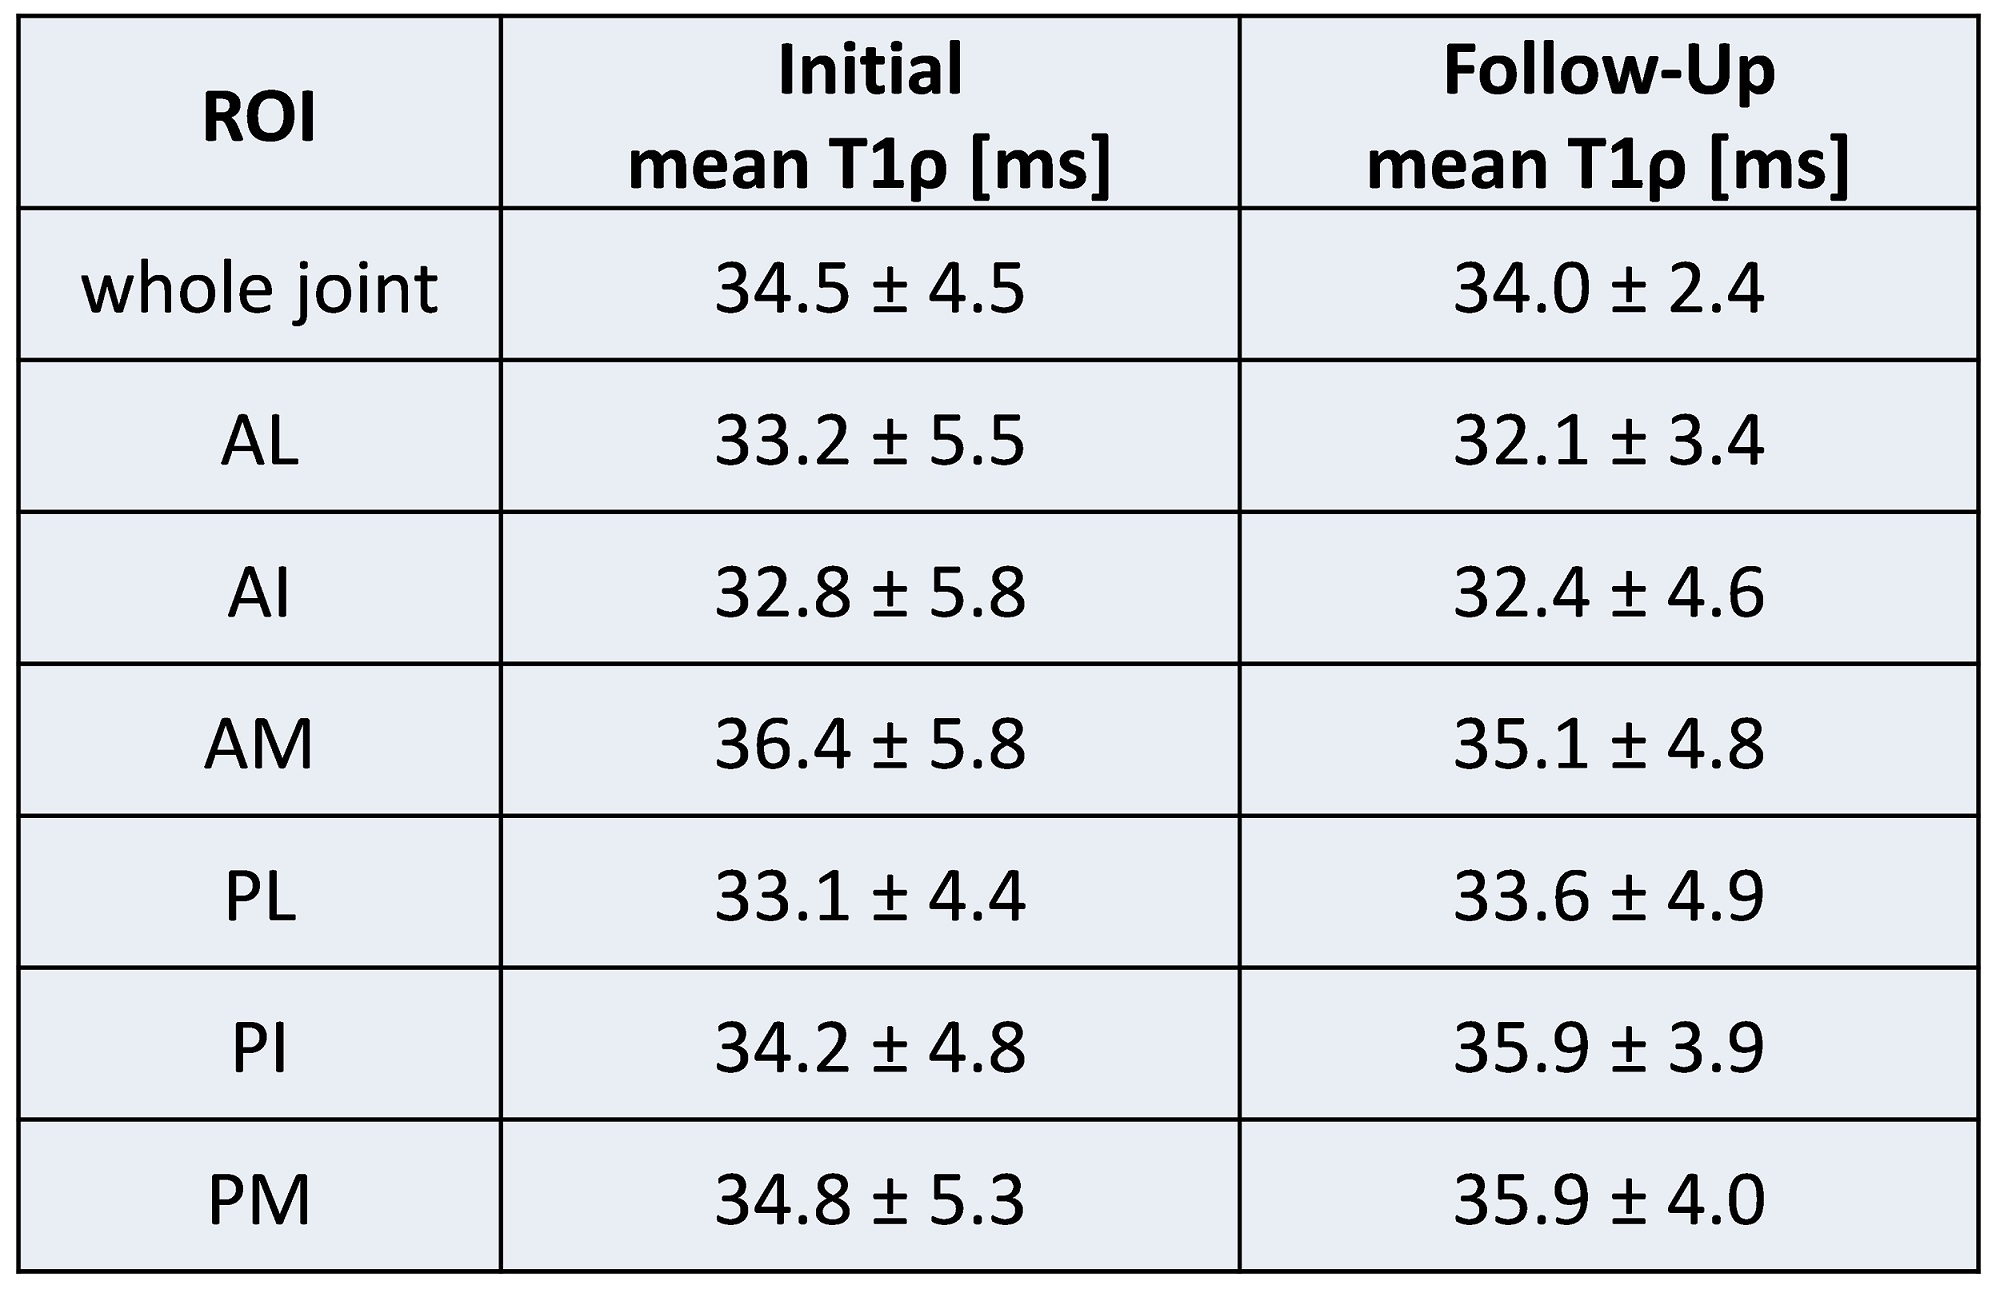
The mean alpha angles were 53° (range: 37–65°) at 3:00 and 65° (range: 49–77°) at 1:30 position. The WOMAC score remained unchanged in all but 3 patients; in 2 patients it reduced (from 100 to 91.6 and 86.4) and in 1 it increased (from 94.8 to 100). There was no difference in the mean T1ρ obtained between the two MRIs for the whole joint or any of the six ROIs (p>0.5) for the cohort (%ΔT1ρ: -9% to +8%) (Table 1). An example of an initial and follow-up T1ρ map is shown in Figure 2. The T1ρ value in the AL region increased in 5 cases (mean %ΔT1ρ: 10%, range: 3–26%) and reduced in 7 (mean %ΔT1ρ: -14%, range: -24 to -3%). Overall, %ΔT1ρ in the AL significantly reduced in 5 hips and increased in 1 hip.Discussion
In asymptomatic hips with cam-type deformity, no change in the T1ρ profile takes place within 3 years, suggesting stable PG content. Although the T1ρ values are prolonged compared to healthy controls, T1ρ did not change over the observed time interval of three years for the majority of the group. However, in 1 of the 12 patients a greater than 20% increase in T1ρ was detected in the AL and other ROIs. Interestingly, this was one of the 2 patients with reduced WOMAC score at follow-up. Whether this reduction in PG content will continue with time and whether this will accompany the onset of symptoms requires further surveillance. It is of interest that T1ρ decreased in a number of hips with time, suggesting a repair/regeneration mechanism within the hyaline cartilage.Conclusion
The study on asymptomatic hips with cam-type FAI shows that for the majority of the group no significant differences in T1ρ values were detected after 3 years. However, 1 patient (out of 12) showed significant (>20%) increased T1ρ (i.e. PG reduction) in the Antero-Lateral region of the joint and a drop in WOMAC score. Further individual surveillance is necessary to monitor cartilage health status.Acknowledgements
Canadian Institutes of Health Research (CIHR). Funding number: MOP 97778.References
1. Ganz R, Parvizi J, Beck M, Leunig M, Nötzli H, Siebenrock KA. Femoroacetabular impingement: a cause for osteoarthritis of the hip. Clin Orthop Relat Res. 2003.(417):112-20.
2. Beaulé PE, Zaragoza E, Motamedi K, et al. Three-dimensional computed tomography of the hip in the assessment of femoroacetabular impingement. J Orthop Res. 2005;23(6):1286-92
3. Wheaton AJ, Dodge GR, Elliott DM, et al. Quantification of cartilage biomechanical and biochemical properties via T1rho magnetic resonance imaging. Magn Reson Med. 2005;54(5):1087-93.
4. Anwander H, Melkus G, Rakhra KS, Beaulé PE. T1ρ MRI detects cartilage damage in asymptomatic individuals with a cam deformity. J Orthop Res.2016;34(6):1004-9.
Figures