5095
UTE-T2* Profile Analyses Correlate to Patient Reported Outcomes 2 Years After ACL Reconstruction1Department of Orthopaedic Surgery, Stanford University, Stanford, CA, United States
Synopsis
Identification of patients with early cartilage degeneration who are at greater risk for poor clinical outcomes is critical for development of interventions to reduce osteoarthritis risk after ACL injury. This study tested the hypothesis that UTE-T2* profile analysis of knee cartilage correlates with patient reported outcomes (PRO) in ACL-reconstructed subjects 2 years after surgery. UTE-T2* mean values and profile characteristics in 27 ACL-reconstructed subjects correlated with patient reported pain and symptoms. Side-to-side differences in UTE-T2* profiles of some high functioning individuals suggest that this UTE metric may provide earlier warning of cartilage at risk for progressive degeneration than PRO.
Purpose
Assessment of cartilage T2 as a function of distance from the subchondral bone, or T2 profiles, have demonstrated changes to the laminar structure of the cartilage matrix with age and disease1-3. Unlike conventional T2, ultrashort TE-enhanced T2* (UTE-T2*) has the potential to assess collagen fibril integrity and organization in deep cartilage where short T2* relaxation times (< 10ms) are abundant4,5. However, the clinical relevance and utility of UTE-T2* profile assessments and changes to UTE-T2* maps has yet to be established. This study was performed to test the hypothesis that profile analyses of 3-D Cones UTE-T2* maps correlate to patient reported outcomes (PRO) in ACL reconstructed subjects 2 years after surgery.Methods
Twenty-seven ACLR subjects (16F/11M, 35±10yrs, 2.21±0.23yrs post-unilateral ACL-reconstruction) consented to participate in these IRB-approved studies and underwent 3T MRI examination of both their ACLR and contralateral knees (MR 750, GE Healthcare, Milwaukee, WI). UTE-T2* maps were calculated via mono-exponential fitting of a series of T2*-weighted MR images acquired at eight TEs (32μs -16ms, non-uniform echo spacing) using a radial out 3-D cones acquisition6. Mean UTE-T2* values were calculated in 3 regions of interest (ROIs) weight-bearing deep cartilage (extending from the bone-cartilage interface through half of the cartilage thickness) of the central and posterior medial femoral condyle (cMFC and pMFC) and central medial tibial plateau (cMTP). UTE-T2* profiles were computed for each subject by averaging UTE-T2* values across the width of the ROI, along each line of pixels parallel to the subchondral plate, at increasing distances from the bone-cartilage interface. Side-to-side differences in UTE-T2* profiles were estimated by summing the differences (contralateral minus ACLR) in mean UTE-T2* at a nine evenly spaced depths between 25-75% of tissue thickness, Figure 1. The slope of each profile curve were estimated across the middle 25-75% of tissue depth. UTE-T2* processing was performed with Matlab (TheMathWorks, MA). Patient reported outcomes were assessed with Knee Injury and Osteoarthritis Outcome Scores (KOOS); all 5 KOOS subscales were included: Symptoms, Pain, function in daily living (ADL), function in sports and recreation (Sport/Rec), and knee-related quality of life (QOL)7. Normality in all data sets was assessed by Shapiro-Wilk tests. KOOS scores were compared to side-to-side differences in UTE-T2* profiles using Pearson’s correlations (or Spearman’s Rho when data was non-normally distributed). All statistical analyses were performed with SigmaPlot (Systat Software, San Jose, CA).Results
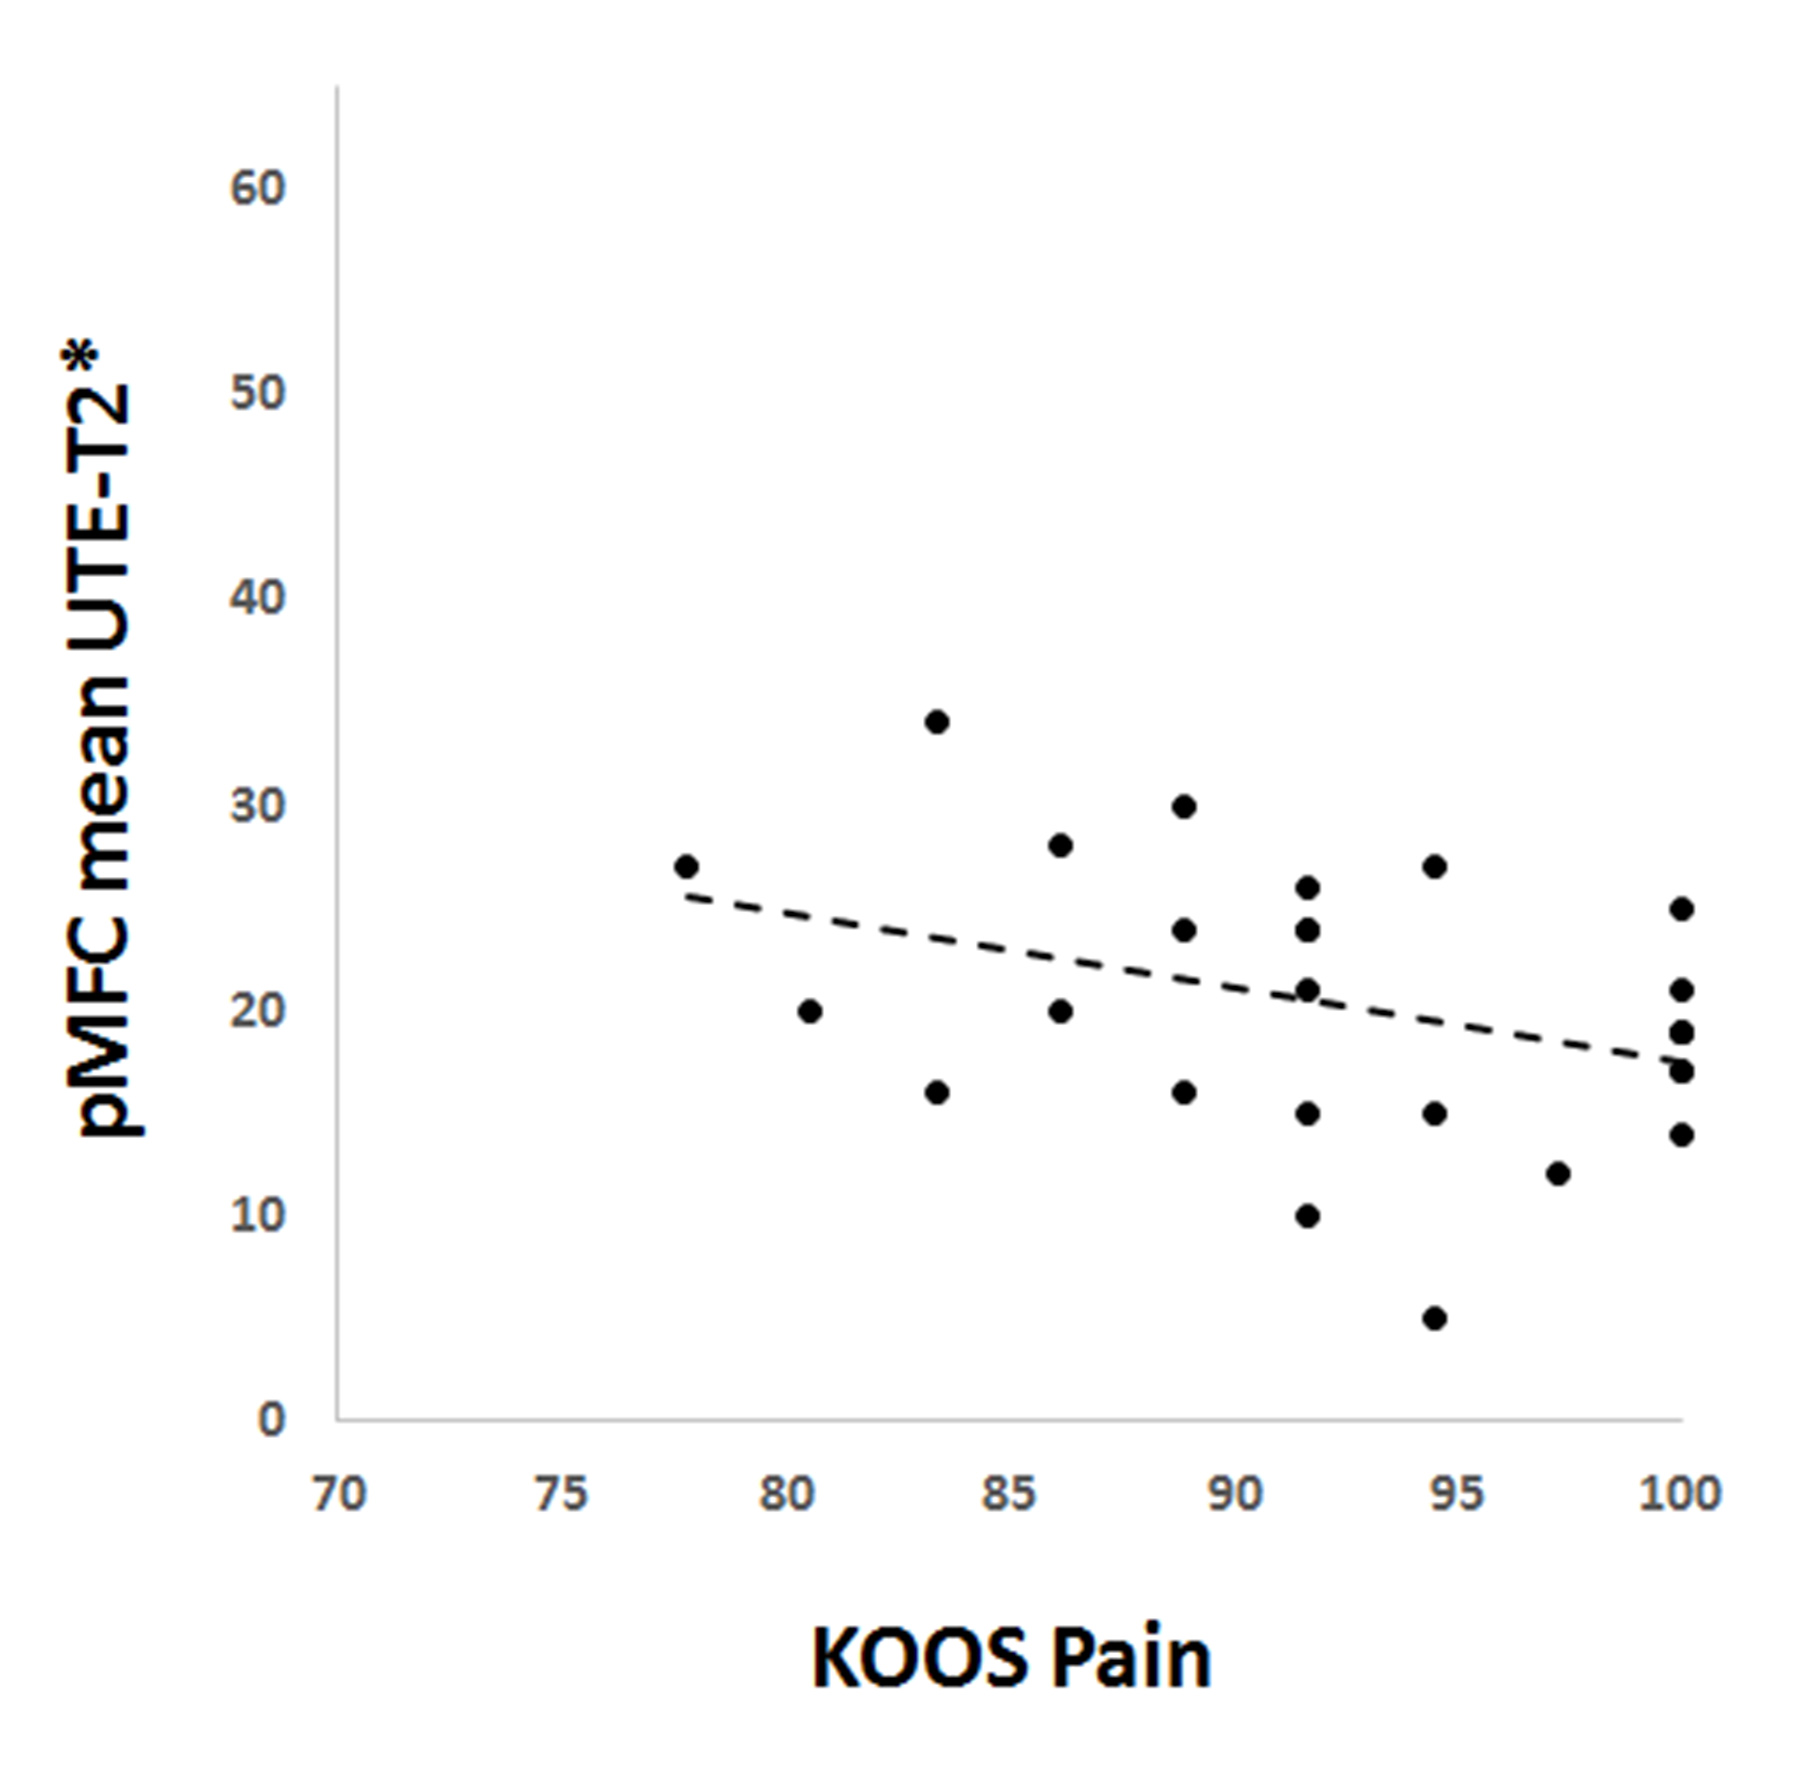
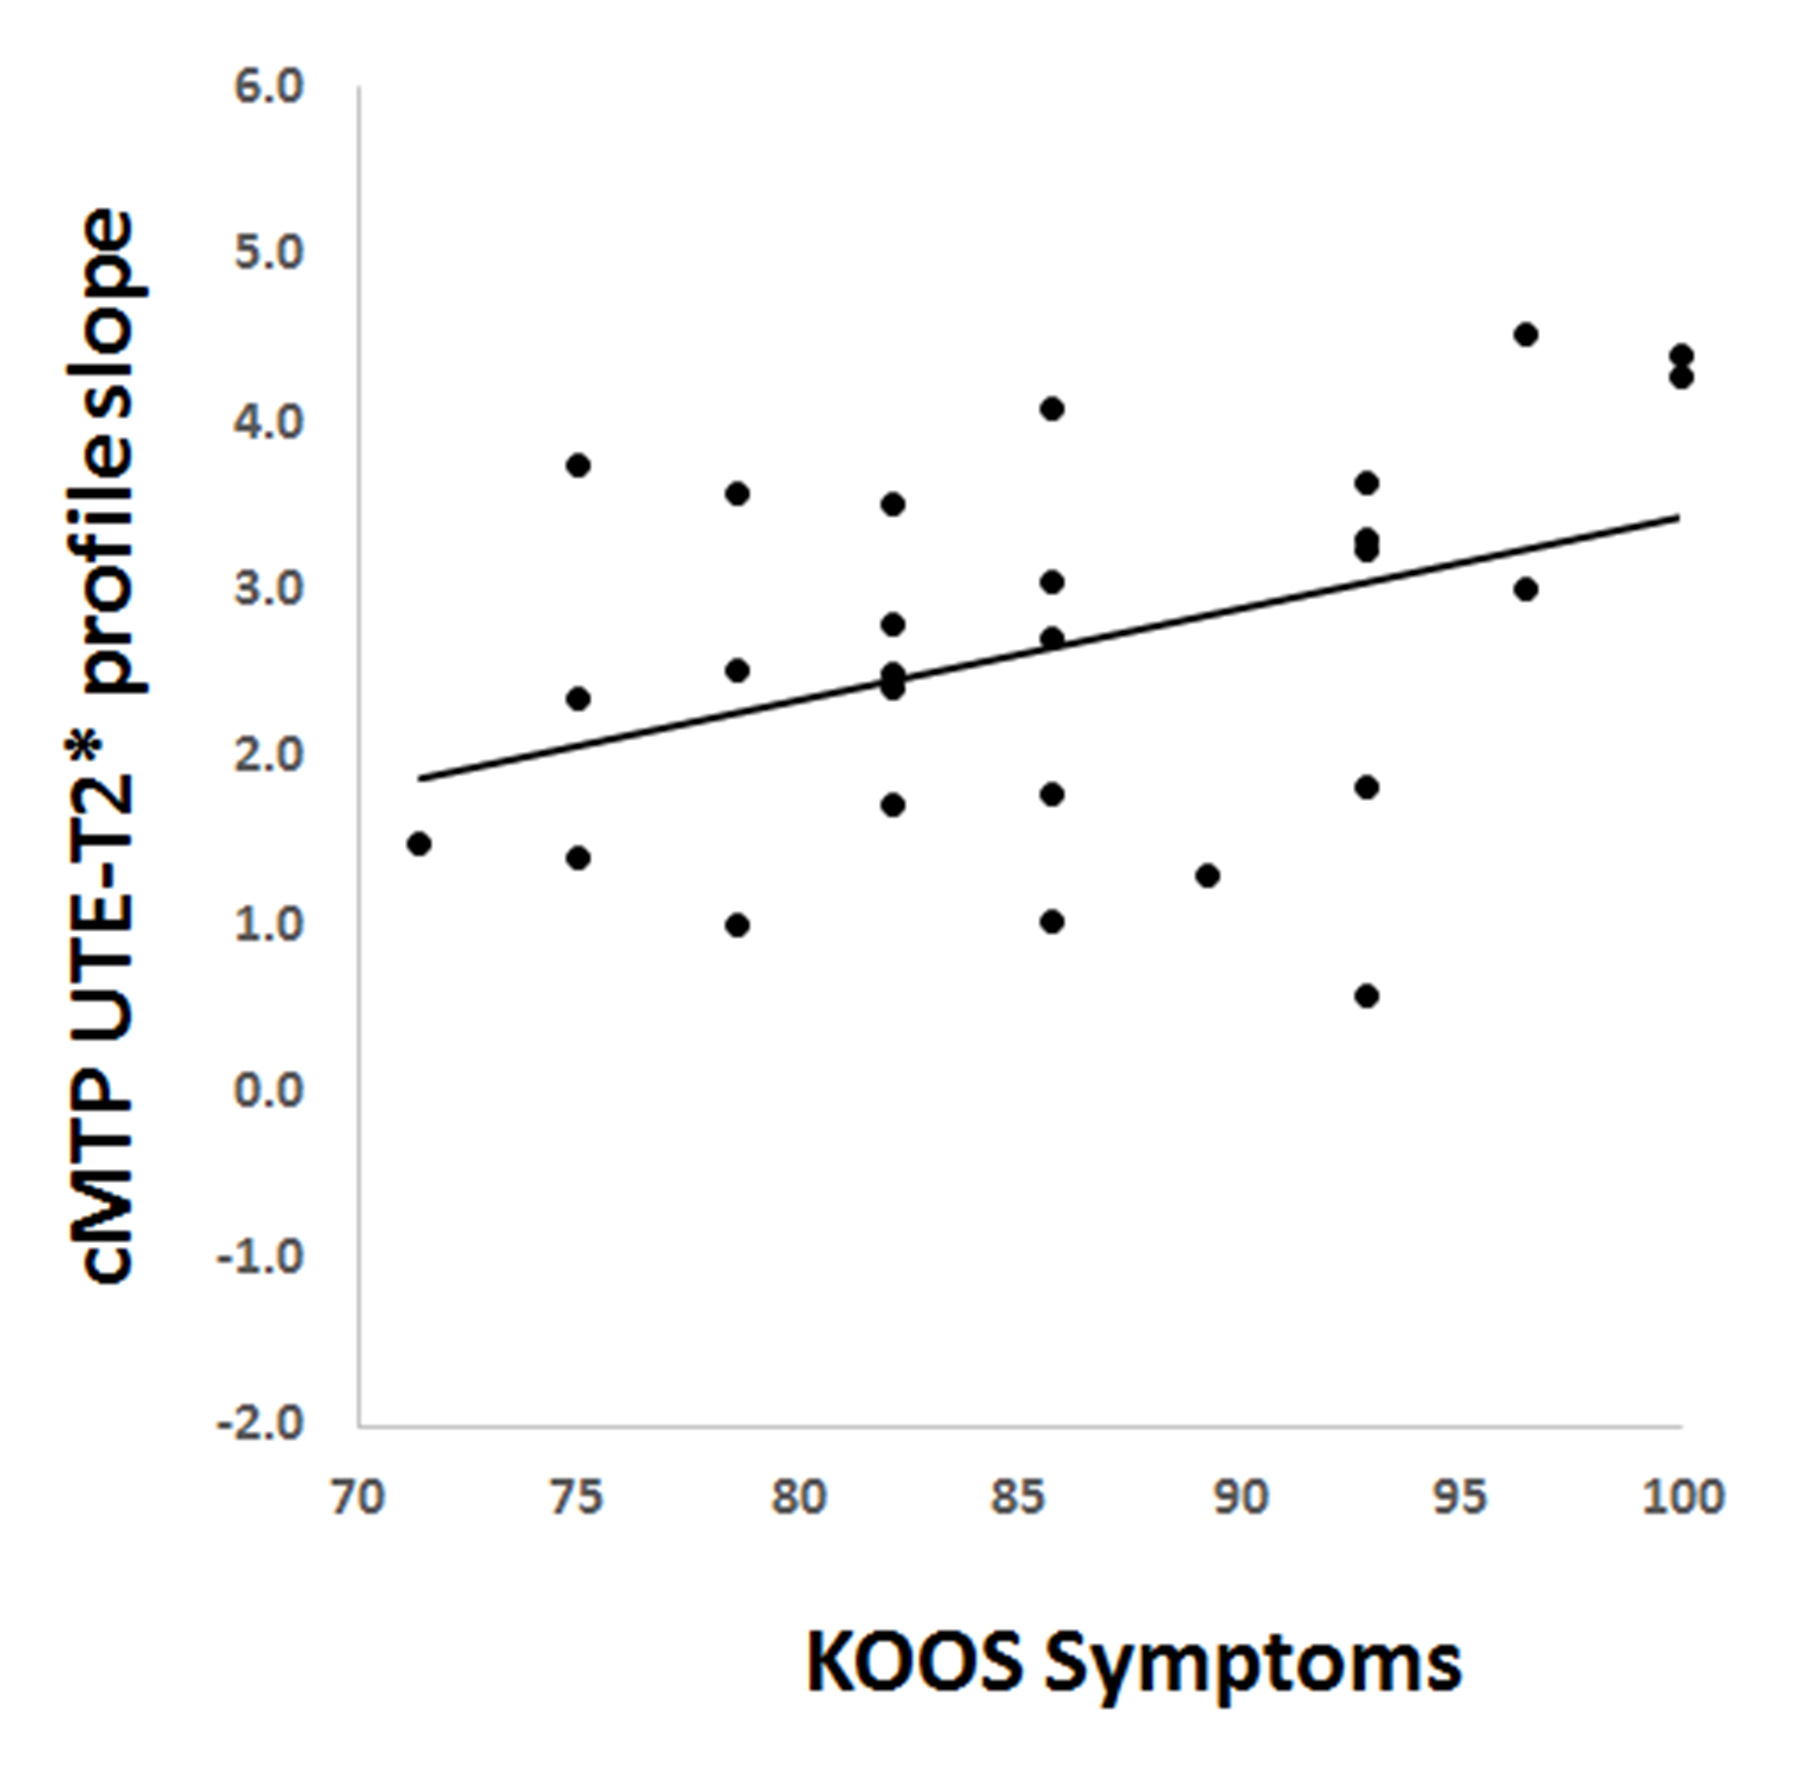
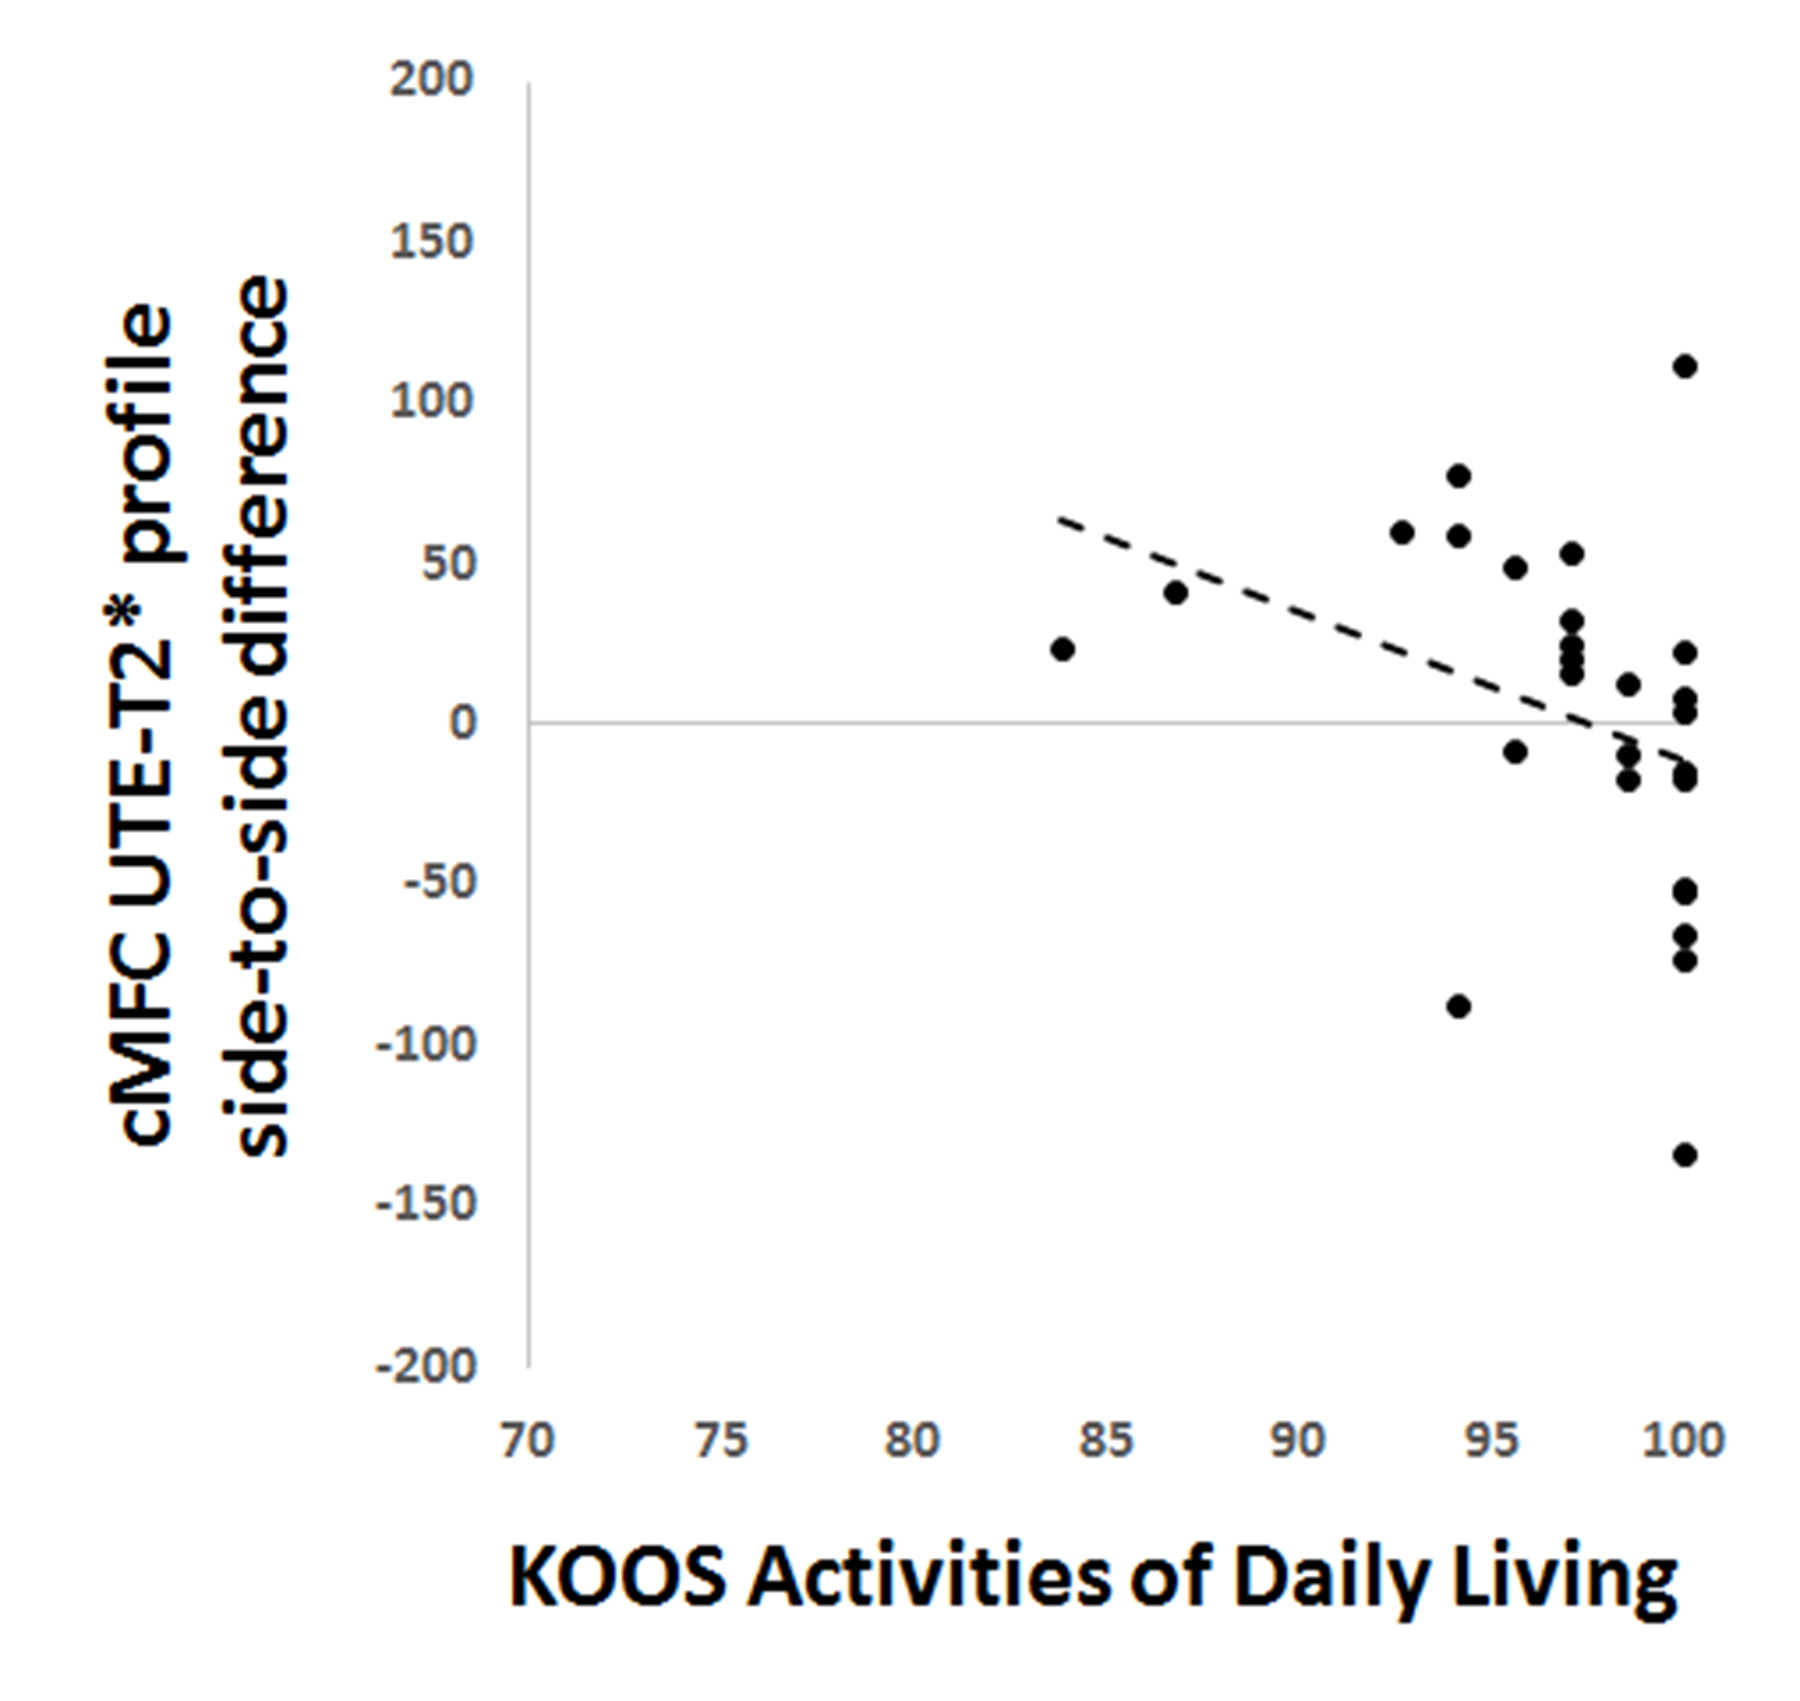
ACLR subject’s mean UTE-T2* values and profile characteristics correlated to patient reported outcomes. Mean pMFC UTE-T2* values measured in ACLR subjects’ reconstructed knees correlated to KOOS Pain scores (Spearman R=-.37, p=0.055), Figure 2. The slope in the middle 50% of the cMTP UTE-T2* profile measured in ACLR subjects’ reconstructed knees correlated to KOOS Symptoms (Pearson’s R=0.39, p=0.045, Figure 3). Side-to-side differences in cMFC UTE-T2* profiles correlated to ADL scores (Spearman’s Rho=-0.55, p=0.003), Figure 4.Discussion
In this work, UTE-T2* mean values and profile characteristics correlated to patient reported outcomes 2 years after ACLR. The finding that higher UTE-T2*, which has been shown in our previous work8 to be associated with subsurface cartilage injury, correlated to worsening patient reported pain and symptoms suggests that UTE-T2* may provide early warning of joint degeneration and deteriorating clinical outcomes9. The observed side-to-side differences found in UTE-T2* profiles of some high functioning individuals suggest that this novel UTE metric may provide earlier warning of cartilage at risk for progressive degeneration than PRO. Such findings suggest that profile assessment may be a more sensitive indicator of otherwise occult cartilage matrix changes than mean T2* values across an ROI at this early time period after ACLR.Significance
The ability to identify patients with early cartilage degeneration who are at greater risk for deteriorating clinical outcomes prior to development of irreversible changes is critical to development of new interventions to reduce osteoarthritis risk after ACL injury. This study shows that novel UTE-T2* mapping and profile assessments of cartilage UTE-T2* maps show cartilage matrix changes that correlate to patient reported outcomes just 2 years after ACLR. Continued longitudinal study is needed to see if UTE-T2* profiles provide early warning of cartilage at risk for progressive degeneration in this population.Acknowledgements
NIH RO1 AR052784 (CR Chu) and GE Healthcare.References
1. Koff MF, Amrami KK, Kaufman KR. 2007. Clinical evaluation of T2 values of patellar cartilage in patients with osteoarthritis. Osteoarthritis and cartilage / OARS, Osteoarthritis Research Society 15:198-204.
2. Mosher TJ, Dardzinski BJ, Smith MB. 2000. Human articular cartilage: influence of aging and early symptomatic degeneration on the spatial variation of T2--preliminary findings at 3 T. Radiology 214:259-266.
3. Nissi MJ, Salo EN, Tiitu V, et al. 2016. Multi-parametric MRI characterization of enzymatically degraded articular cartilage. Journal of orthopaedic research : official publication of the Orthopaedic Research Society 34:1111-1120.
4. Williams A, Qian Y, Bear D, et al. 2010. Assessing degeneration of human articular cartilage with ultra-short echo time (UTE) T2* mapping. Osteoarthritis and cartilage / OARS, Osteoarthritis Research Society 18:539-546.
5. Du J, Takahashi AM, Chung CB. 2009. Ultrashort TE spectroscopic imaging (UTESI): application to the imaging of short T2 relaxation tissues in the musculoskeletal system. Journal of magnetic resonance imaging : JMRI 29:412-421.
6. Gurney PT, Hargreaves BA, Nishimura DG. 2006. Design and analysis of a practical 3D cones trajectory. Magnetic resonance in medicine 55:575-582.
7. Roos EM, Lohmander LS. 2003. The Knee injury and Osteoarthritis Outcome Score (KOOS): from joint injury to osteoarthritis. Health and quality of life outcomes 1:64.
8. Chu CR, Williams AA, West RV, et al. 2014. Quantitative Magnetic Resonance Imaging UTE-T2* Mapping of Cartilage and Meniscus Healing After Anatomic Anterior Cruciate Ligament Reconstruction. The American journal of sports medicine 42:1847-1856.
9. Chu CR, Williams AA, Coyle CH, et al. 2012. Early diagnosis to enable early treatment of pre-osteoarthritis. Arthritis Res Ther 14:212.
Figures