5094
UTE-T2* Profile Analyses Correlate with Walking Mechanics 2 Years After ACL Reconstruction1Department of Orthopaedic Surgery, Stanford University, Stanford, CA, United States
Synopsis
This work examines the use of UTE-T2* profile analysis to assess sub-surface knee cartilage structural changes in 26 ACL-reconstructed subjects and compares UTE-T2* metrics to kinetic and kinematic measures of walking. UTE-T2* profile characteristics detect differences between ACL-reconstructed and uninjured knees. Side-to-side differences in an individual’s UTE-T2* profile metrics correlate with side-to-side differences in their gait metrics. The results suggest that UTE-T2* profile characteristics of cartilage are a useful metric for identifying cartilage subsurface changes early after ACLR and may reflect matrix changes resulting from altered loading.
Purpose
Cartilage T2 profiles (T2 as a function of distance from the subchondral bone) have demonstrated changes to the laminar structure of the cartilage matrix with age and disease1-3. Altered knee mechanics following anterior cruciate ligament (ACL) reconstruction are thought to increase the risk for osteoarthritis (OA)4 in part by disrupting the deep articular cartilage matrix5. Unlike conventional T2 mapping, ultrashort TE-enhanced T2* (UTE-T2*) mapping is sensitive to collagen fibril integrity and organization in deep cartilage6. The goals of this work are: 1) to examine cartilage of ACL-reconstructed (ACLR) subjects with UTE-T2* profiles, and 2) to compare UTE-T2* profile characteristics and mean to kinetic and kinematic measures of walking.Methods
Twenty-six ACLR subjects (15F, 35±10yrs, 2.20±0.23yrs post-unilateral ACL-reconstruction) and 15 uninjured controls (6F, 31±9yrs) consented to participate in these IRB-approved studies. ACLR subjects underwent 3T MRI examination of both their ACLR and contralateral knees (MR 750, GE Healthcare, Milwaukee, WI). UTE-T2* maps were calculated via mono-exponential fitting of a series of T2*-weighted MR images acquired at eight TEs (32μs -16ms, non-uniform echo spacing) using a radial out 3-D cones acquisition7. Mean UTE-T2* values were calculated in 2 regions of interest (ROIs) weight-bearing deep cartilage (extending from the bone-cartilage interface through half of the cartilage thickness) of the central medial femoral condyle and tibial plateau (cMFC, cMTP). UTE-T2* profiles were computed for each subject by averaging UTE-T2* values across the width of the ROI, along each line of pixels parallel to the subchondral plate, at increasing distances from the bone-cartilage interface. Profiles were normalized to cartilage thickness using cubic interpolation. Slopes of the profile curves were estimated across the deepest 0-25% of tissue depth and also the middle 31-63% of tissue depth. UTE-T2* processing was performed with Matlab (TheMathWorks, MA).
All ACLR subjects underwent gait analysis, walking at normal self-selected speed. A 10-camera optoelectronic system (Qualisys, SE) and a force plate (Bertec, OH) were used to measure subjects’ motion at 120Hz. Knee kinematics and kinetics were calculated using BioMove software (Stanford University) and the point cluster technique8. Five knee kinetics metrics: adduction moments during loading response, late stance, and impulse over stance (KAM1, KAM2, KAM-IS), maximum extension and flexion moments (KEM, KFM); and two kinematic metrics: flexion angle at heel strike (KFA-HS) and average external rotation during stance (aExtRot); were compared to UTE-T2* means and profiles slopes using Pearson correlations (or Spearmans when data was non-normally distributed). Correlations results were adjusted for multiple comparisons using a Benjamini-Hochberg procedure with a false discovery rate of 0.2. ANOVA adjusted for multiple comparison assessed differences in mean UTE-T2* values across groups. Statistical analyses were performed with SPSS (IBM) and Excel (Microsoft).
Results
Depthwise profiles in cMTP and cMFC cartilage demonstrated differences between both the ACL-reconstructed and contralateral knees of ACLR subjects and uninjured controls (Figure 1a, b). Individual ACLR subject’s mean UTE-T2* values correlated to measures of their knee kinetics (Table 1). ACLR subject’s UTE-T2* profile characteristics, specifically the slopes of the profile in the deep 30% or middle 35% of the tissue thickness, correlated to measures of both kinetics and kinematics (Table 1). Examination of side-to-side differences in both gait and UTE-T2*metrics revealed intriguing correlations between: UTE-T2* mean value and KAM1; the slope of the UTE-T2* profile in deep tissue and KFA-HS; and the slope of the UTE-T2* profile in the middle of tissue with KFM.Discussion
This study shows that cartilage UTE-T2* profile characteristics differ between uninjured controls and both knees of ACLR subjects 2 years after surgery. Such findings suggest that cartilage matrices in both the ACL-injured and contralateral-uninjured knees of ACLR subjects undergo structural changes in response to altered loading following ACL injury and reconstruction. The correlations observed with adduction moment and cartilage UTE-T2* values, suggest that UTE-T2* mapping is sensitive to disorganization or loosening of the collagen fibril matrix from increased loading. Moreover, the finding that side-to-side differences in UTE-T2* of ACLR subjects correlate with side-to-side differences in gait measures that are known to change following ACL reconstruction9,10 further support the hypothesis that UTE-T2* metrics are sensitive to subsurface cartilage matrix changes from altered loading.Conclusion
The results of this study suggest that UTE-T2* profile characteristics of cartilage are a useful metric for identifying cartilage subsurface changes early after ACLR and may reflect matrix changes resulting from altered loading. Continued longitudinal study of ACLR cohorts is needed to see if UTE-T2* profile changes provide early warning of cartilage at risk for progressive degeneration.Acknowledgements
NIH RO1 AR052784 (CR Chu) and GE HealthcareReferences
1. Koff MF, Amrami KK, Kaufman KR. 2007. Clinical evaluation of T2 values of patellar cartilage in patients with osteoarthritis. Osteoarthritis and cartilage / OARS, Osteoarthritis Research Society 15:198-204.
2. Mosher TJ, Dardzinski BJ, Smith MB. 2000. Human articular cartilage: influence of aging and early symptomatic degeneration on the spatial variation of T2--preliminary findings at 3 T. Radiology 214:259-266.
3. Nissi MJ, Salo EN, Tiitu V, et al. 2016. Multi-parametric MRI characterization of enzymatically degraded articular cartilage. Journal of orthopaedic research : official publication of the Orthopaedic Research Society 34:1111-1120.
4. Andriacchi TP, Mundermann A, Smith RL, et al. 2004. A framework for the in vivo pathomechanics of osteoarthritis at the knee. Annals of biomedical engineering 32:447-457.
5. Chu CR, Williams AA, West RV, et al. 2014. Quantitative Magnetic Resonance Imaging UTE-T2* Mapping of Cartilage and Meniscus Healing After Anatomic Anterior Cruciate Ligament Reconstruction. The American journal of sports medicine 42:1847-1856.
6. Williams A, Qian Y, Bear D, et al. 2010. Assessing degeneration of human articular cartilage with ultra-short echo time (UTE) T2* mapping. Osteoarthritis and cartilage / OARS, Osteoarthritis Research Society 18:539-546.
7. Gurney PT, Hargreaves BA, Nishimura DG. 2006. Design and analysis of a practical 3D cones trajectory. Magnetic resonance in medicine 55:575-582.
8. Dyrby CO, Andriacchi TP. 2004. Secondary motions of the knee during weight bearing and non-weight bearing activities. Journal of orthopaedic research : official publication of the Orthopaedic Research Society 22:794-800.
9. Scanlan SF, Favre J, Andriacchi TP. 2013. The relationship between peak knee extension at heel-strike of walking and the location of thickest femoral cartilage in ACL reconstructed and healthy contralateral knees. J Biomech 46:849-854.
10. Zabala ME, Favre J, Scanlan SF, et al. 2013. Three-dimensional knee moments of ACL reconstructed and control subjects during gait, stair ascent, and stair descent. J Biomech 46:515-520.
Figures
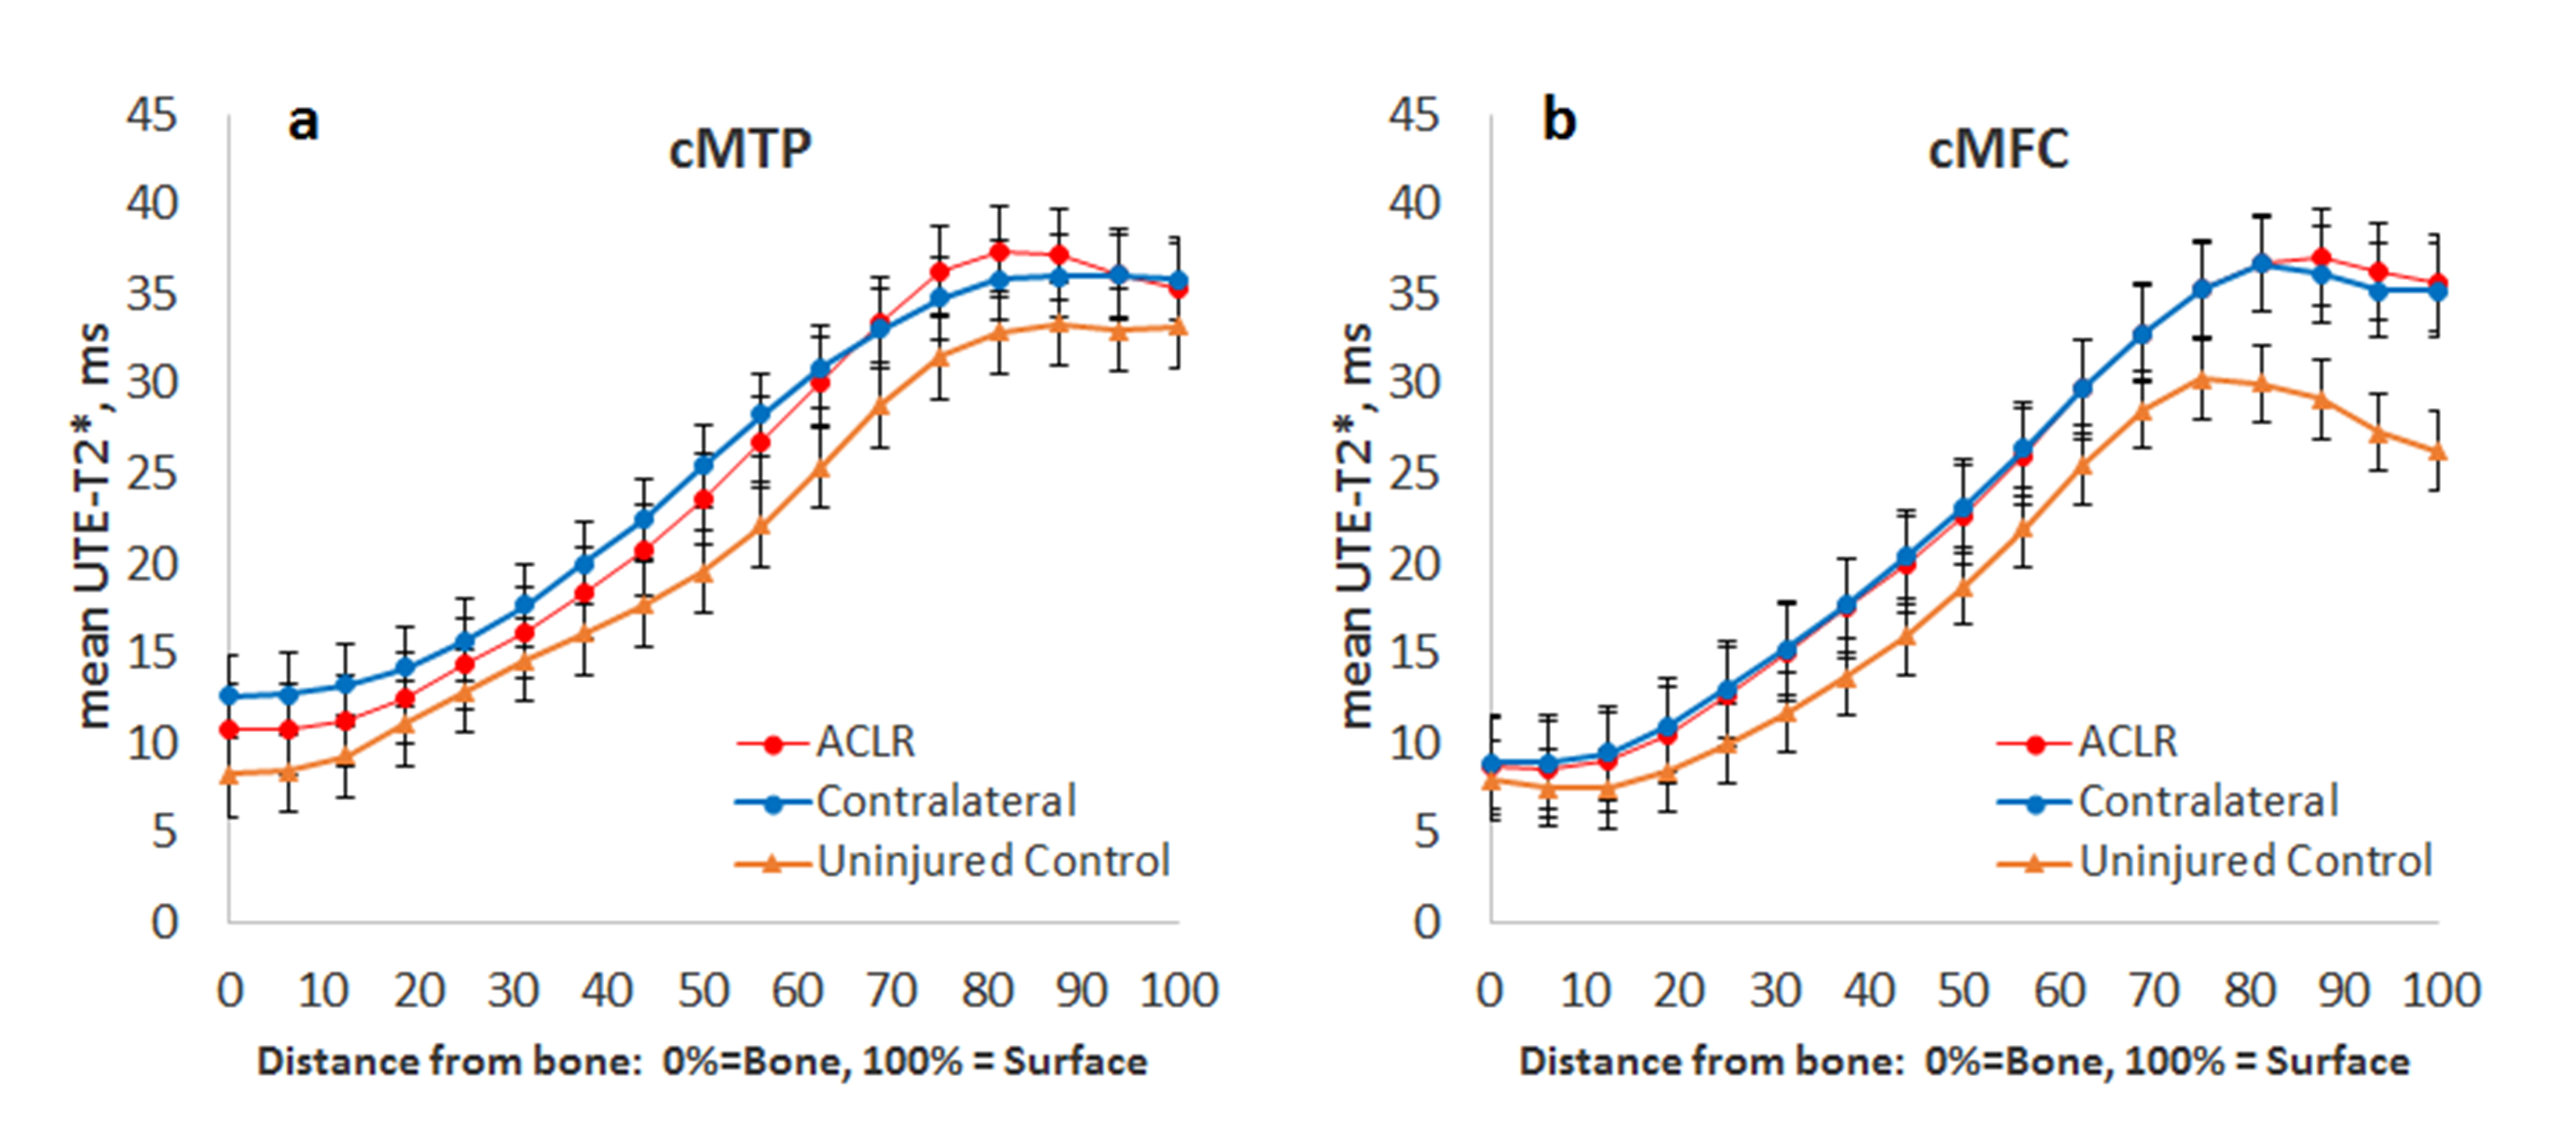
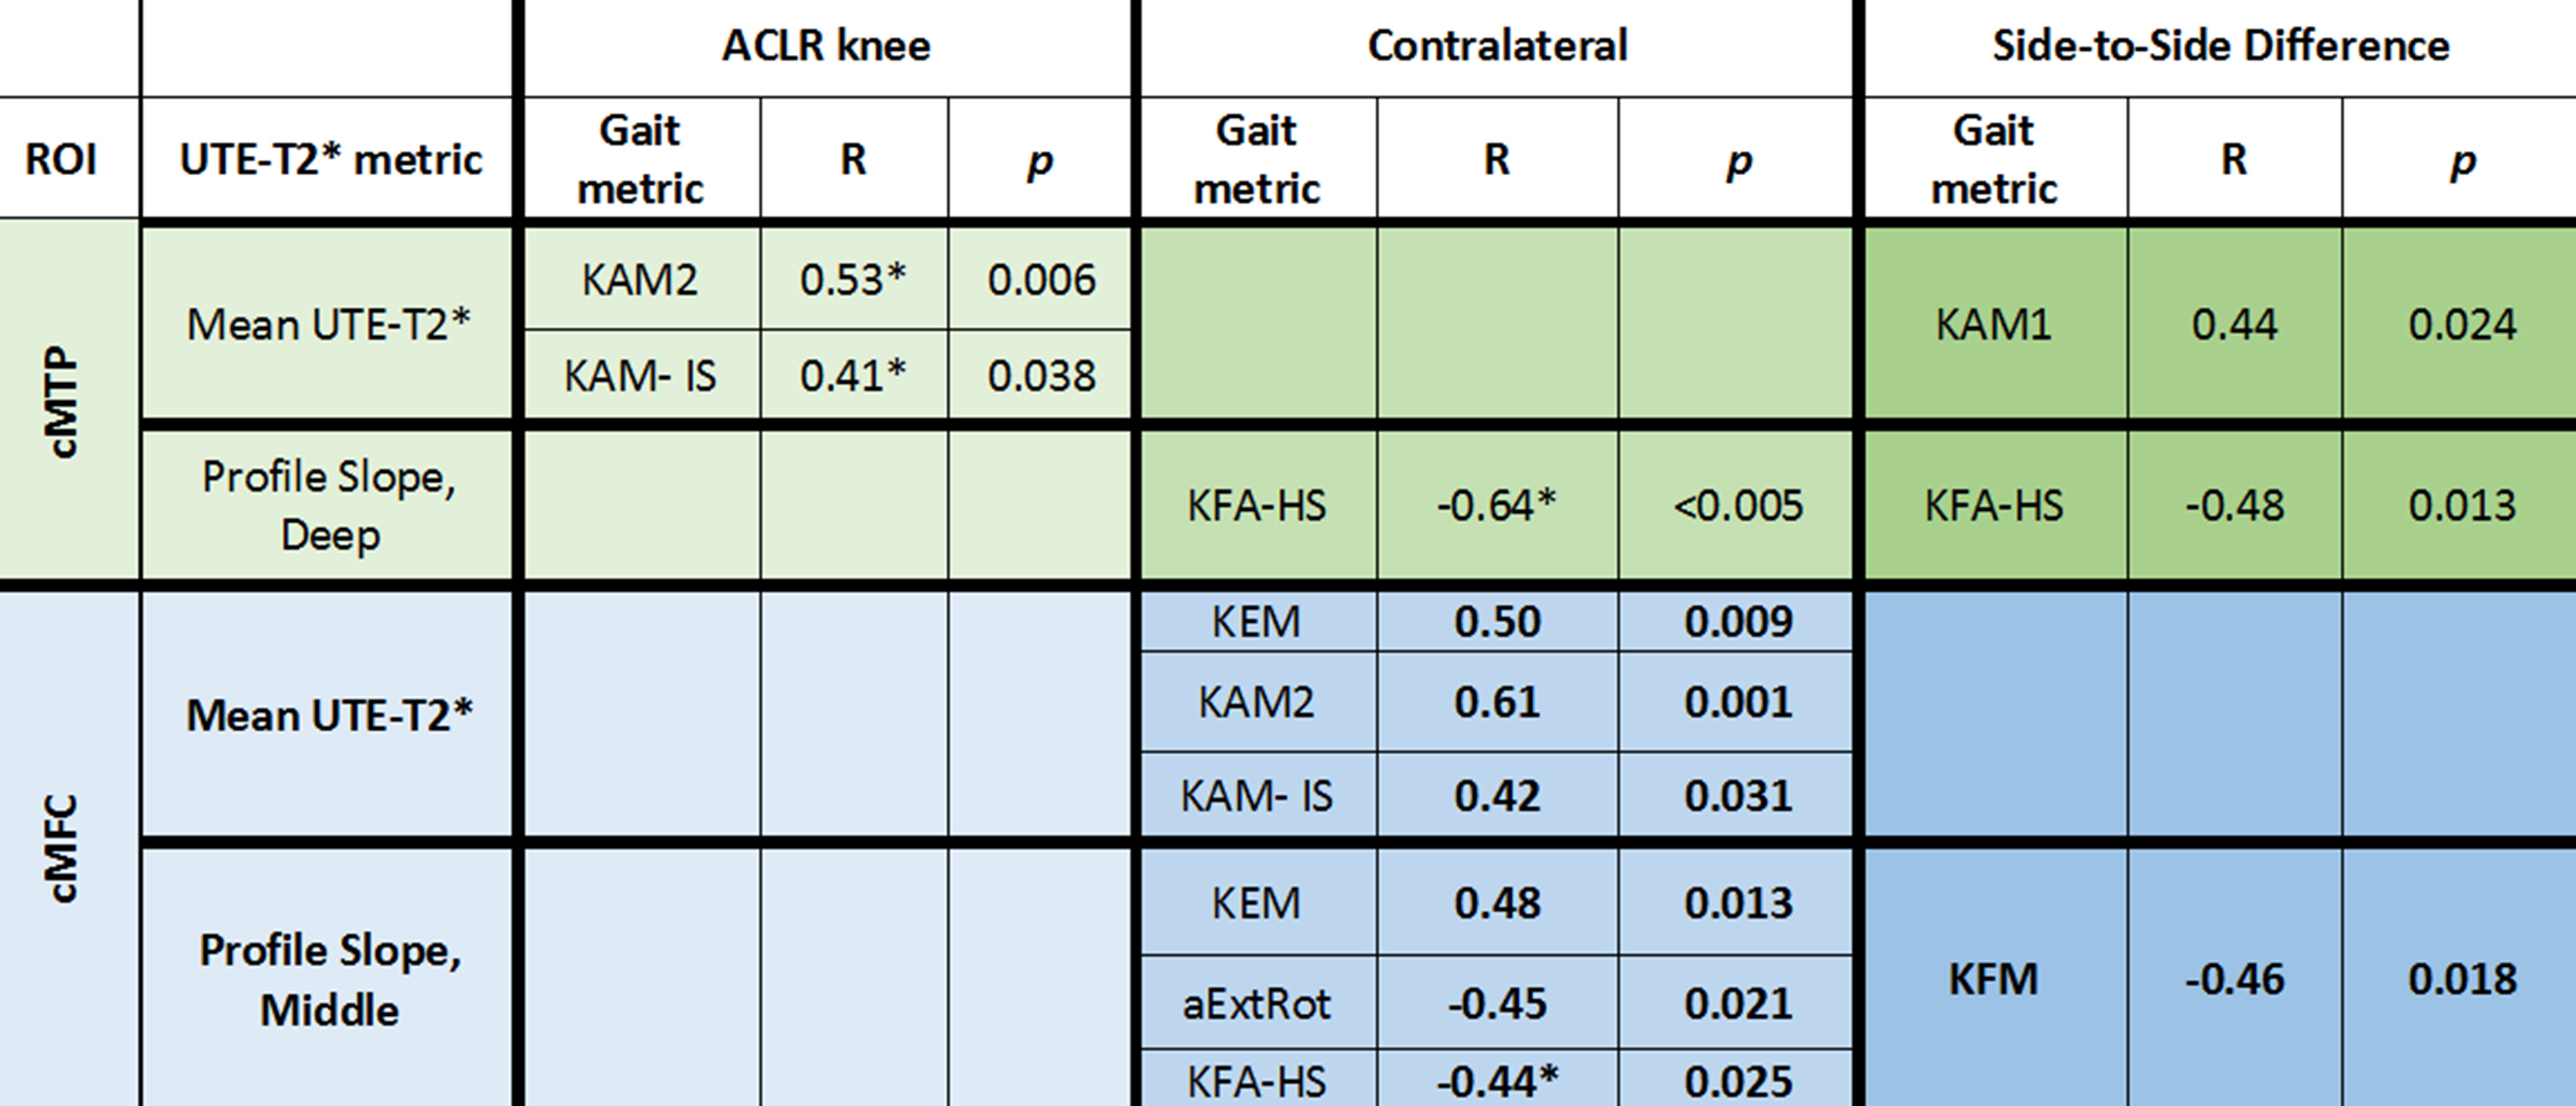
Table 1. Correlations between Gait and UTE-T2* metrics
*Indicates Spearman correlation. Side-to-side differences represent contralateral knee minus ACLR knee.Only significant correlations are included in the table.