5093
UTE-MT Imaging Can Reliably Evaluate Macromolecules in MSK Tissues: A Sequential Collagenase Enzymatic Treatment Study1Department of Radiology, University of California San Diego, San Diego, CA, United States, 2Department of Histology & Embryology, Jinan University, Guangzhou, People's Republic of China, 3Radiology Service, VA San Diego Healthcare System, CA, United States
Synopsis
In this study, we aimed to evaluate UTE-MT derived macromolecule fractions in articular cartilage subject to sequential collagenase enzymatic treatment. The preliminary result suggests that UTE-MT imaging and signal modeling allows for quantitative evaluation of macromolecular fractions in articular cartilage. Furthermore, results from UTE-MT imaging and signal modeling are insensitive to the magic angle effect, which is a huge advantage over the conventional T2 and T1rho measures. The water and macromolecular changes in both short and long T2 tissues in the knee joint using UTE-MT provides a “whole-organ” approach, and may be useful in the diagnosis and treatment of OA.
PURPOSE
Osteoarthritis (OA) is a multisystemic disease with its etiology and progression attributable to many tissues including articular cartilage, menisci, tendons, ligaments and bone, all of which are important to the health of the joint. (1-3) The very early stage of OA involves changes in macromolecules, such as collagen and proteoglycans. However, macromolecules cannot be directly imaged using conventional clinical sequences due to extremely short transverse relaxation times (T2s). Conventional magnetization transfer (MT) imaging can indirectly probe macromolecules in long T2 tissues such as the superficial layers of articular cartilage, but little or no signal can be obtained from the short T2 tissues such as the deep radial and calcified cartilage, menisci, ligaments, tendons and bone. (4) Ultrashort echo time MT (UTE-MT) sequences have recently been developed, (5, 6) aiming to evaluate macromolecules in both short and long T2 tissues in the knee and ankle joints. However, quantitative validation studies have not yet been performed to support the findings. In this study, we aimed to evaluate UTE-MT derived macromolecule fractions in articular cartilage subject to sequential collagenase enzymatic treatment.METHODS
Cadaveric human patellar cartilage samples were dissected into 4×2×1.5 mm3 sections, and imaged using a home-made solenoid transmit/receive coil and a GE 3T Signa TwinSpeed MR scanner (GE Healthcare Technologies, Milwaukee, MI). A 2D UTE-MT sequence employing a rectangular pulse excitation (32 µs) followed by 2D radial ramp sampling was used for non-slice selective projection imaging with a nominal TE of 10 µs. Signals across the whole section thickness were summed to circumvent eddy currents which may be associated with regular half-pulse excitation. 2D UTE-MT images were acquired with four MT powers (300º, 700º, 1100º, 1500º) and five frequency offsets (2, 5, 10, 20, 50 kHz). Other imaging parameters included a TR of 100 ms, a flip angle of 10o, a bandwidth of 62.5 kHz, a FOV of 4 cm, a readout of 128, 211 projections and a scan time of 21 seconds per acquisition. Clinical CPMG and IR-FSE sequences were acquired with similar spatial resolution for T2 and T1 quantification. A two-pool MT model was employed for quantification of macromolecule fraction. The imaging protocol was applied to the cartilage samples at four time points: pre-, 1, 6 and 13 hours post treatment with collagenase type VII (15IU, C0773, Sigma), and macromolecular fractions together with T1 and T2 were analyzed.RESULTS
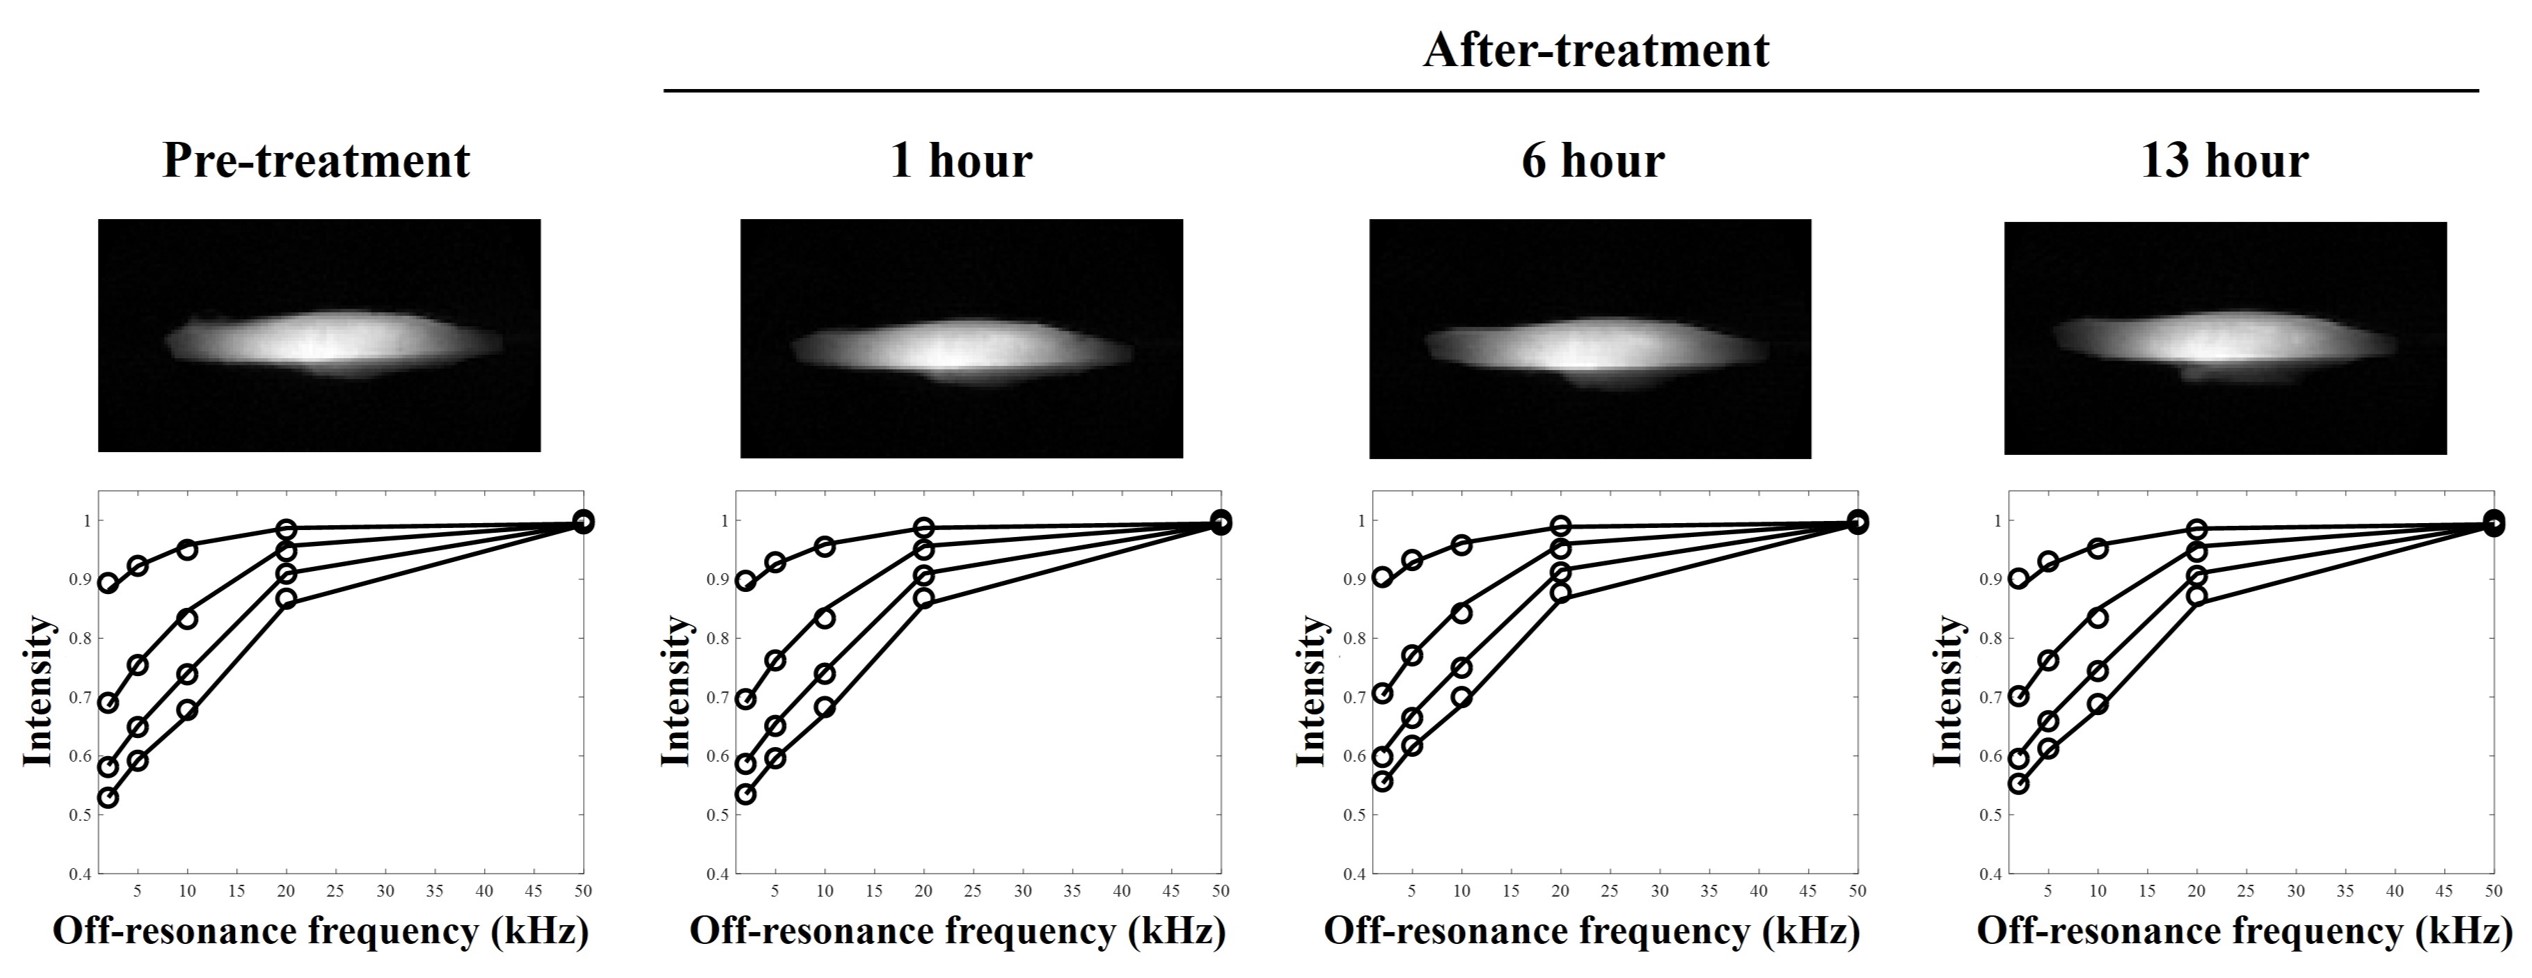
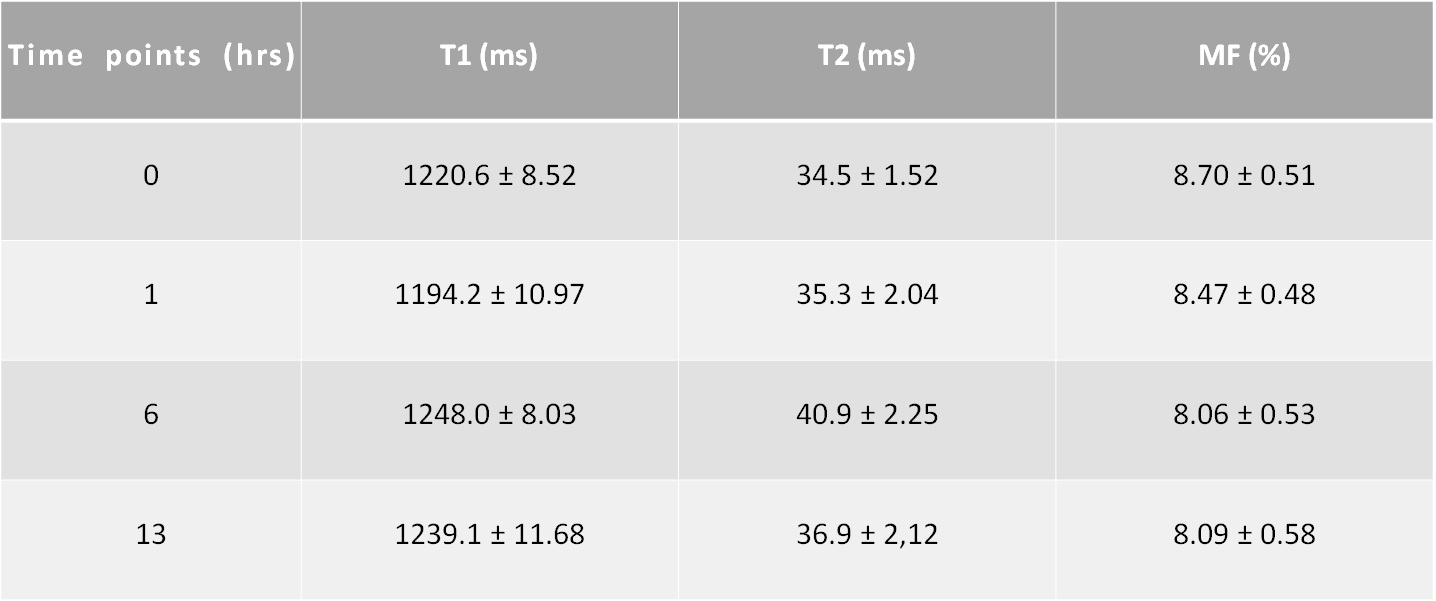
Figure 1 shows representative UTE-MT images and two-pool MT modeling of a cadaveric human patellar cartilage sample. The two-pool model provides excellent fitting of UTE-MT images acquired with different MT powers and frequency offsets. A Super-Lorentzian lineshape was used for MT modeling. The high-quality UTE-MT images allow reliable estimation of water and macromolecular fractions, their relaxation times and exchange rates, as indicated in the figure. Table 1 summarizes the estimated T1s, T2s, and macromolecular fractions of articular cartilage subject to sequential collagenase enzymatic treatment. T1 remained relatively constant (1220.6 ms pre-treatment to 1239.1 ms 13 hours after treatment) during the sequential treatment. T2 showed similar trend (34.5 ms pre-treatment to 36.9 ms 13 hours post treatment). Meanwhile, macromolecular fraction decreased from 8.70% pre-treatment, to 8.47% 1 hour after treatment, and 8.06% six hours after collagenase treatment. Further treatment (i.e., 13 hours) has little effect on macromolecular fraction.
DISCUSSION
UTE-MT imaging and signal modeling provides monotonically decreased macromolecular fractions in cadaveric human patellar articular cartilage subject to sequential collagenase enzymatic treatment. This preliminary result suggests that UTE-MT imaging and signal modeling allows for quantitative evaluation of macromolecular fractions in articular cartilage. UTE-MT can also provide quantitative macromolecular information in short T2 tissues such as menisci, ligaments, tendons and bone because of the ultrashort TE of 10 µs. Furthermore, results from UTE-MT imaging and signal modeling are insensitive to the magic angle effect, which is a huge advantage over the conventional T2 and T1rho measures. (5) The water and macromolecular changes in both short and long T2 tissues in the knee joint using UTE-MT provides a truly “whole-organ” approach, and may be very useful in the diagnosis and treatment monitoring of OA.Acknowledgements
The authors acknowledge grant support from the NIH (1 R01 AR062581-01A1, 1 R01 AR068987-01) and the VA Clinical Science R&D Service (Merit Award I01CX001388).References
1. Brandt KD, Radin EL, Dieppe PA, et al. Yet more evidence that osteoarthritis is not a cartilage disease. Ann Rheum Dis. 2006;65(10):1261-1264.
2. Hunter DJ, Zhang YQ, Niu JB, et al. The association of meniscal pathologic changes with cartilage loss in symptomatic knee osteoarthritis. Arthritis Rheum. 2006;54(3):795-801.
3. Tan AL, Toumi H, Benjamin M, et al. Combined high-resolution magnetic resonance imaging and histological examination to explore the role of ligaments and tendons in the phenotypic expression of early hand osteoarthritis. Ann Rheum Dis. 2006;65(10):1267-1272.
4. Henkelman RM, Huang X, Xiang QS, et al. Quantitative interpretation of magnetization transfer. Magn Reson Med. 1993;29(6):759-766.
5. Ma YJ, Shao H, Du J, et al. Ultrashort echo time magnetization transfer (UTE-MT) imaging and modeling: magic angle independent biomarkers of tissue properties. NMR Biomed. 2016;29(11):1546-1552.
6. Hodgson RJ, Evans R, Wright P, et al. Quantitative magnetization transfer ultrashort echo time imaging of the Achilles tendon. Magn Reson Med. 2011;65(5):1372-1376.
Figures