5092
Effects of Fat Saturation on T2* QuantificationMichael Carl1, Amin Nazaran2, Jiang Du2, and Graeme M Bydder2
1GE Healthcare, San Diego, CA, United States, 2UCSD, CA, United States
Synopsis
The T2 relaxation of MRI signals is an important parameter in assessment of pathology. Here we analyze the effects that Fat Saturation pulses of various bandwidths have on the values of T2 quantification. We found that Fat Saturation can have a notable effect on the measured T2 values of multi-component tissues. Since the dispersion is less for smaller FS bandwidths, longer FS pulses can help to minimize the effects.
Introduction
The T2 relaxation properties of MRI signals are important parameters in assessment of pathology. Many musculoskeletal (MSK) tissues (cortical bone, tendon, ligaments, etc.) have very short transverse relaxation times and require specialized pulse sequences such as ultrashort echo time (UTE) for optimal signal acquisition and quantification. These scans can be performed either with or without Fat Saturation (FS). Here we analyze the effects that FS pulses of various bandwidths (BW) have on the values of T2 quantification.Theory
For a given single T2 component, application of FS results in a reduction of the available SNR of that tissue, but has little effect on the subsequent decay curves. Often however, the MSK tissues of interest contain structures with multiple short T2 components [1,2], which simultaneously contribute to signals in the region of interest (ROI). Since components with different T2 values get attenuated by varying amounts (e.g. shorter T2 tissues that have a broad linewidth get attenuated more), the overall signal decay is altered and simple single component T2 fitting will yield corresponding altered results. Fig.1A shows theoretical signals (at TE = 0) of two different T2s (10ms and 0.3ms) after application of FS pulses with various BWs using Bloch simulations (non-FS corresponding to FS pulse BW=0). As shown, the short T2 signals get attenuated more than the longer T2 signals as expected. The corresponding effects on single component T2 fitting is shown in Fig.1B which results in overall T2 values lying between the two components. For higher FS pulse BWs, the shorter T2 components are attenuated more and the overall measured T2 therefore increases.Methods
The experimental phantom setup shown in Fig.1D (insert) was used to study the effects of Fat Saturation on T2 quantification. Test tubes containing water doped with different amounts of MnCl2 (resulting in T2s of ~10ms and ~0.3ms) were imaged using coronal multi-echo UTE with TE=[0:0.8:8.8ms]. ROI measurements were obtained in the individual tubes and combined to emulate multi-component signals. In vivo scans were performed on a healthy male volunteer (age 72). Sagittal multi-echo images (see Fig.2) were obtained without FS, as well as with two separate FS pulse BWs. T2 values were obtained using a single component fit in the patella tendon, meniscus, PCL, and cartilage.Results
Shown Fig.1C are signal decay curves for the two individual phantoms. The measured values of T2 of the combined signals are shown in Fig.1D as a function of the FS pulse BW and show good agreement with the theoretical simulations. Fig.3 shows the measured T2 values of the in-vivo slices (from Fig.2). For all anatomies a similar systematic increase of the measured T2 can be observed for larger FS pulse BW’s.Discussion
Fat Saturation can have a notable effect on the measured single component T2 values of multi-component tissues. Since the dispersion is less pronounced for smaller FS bandwidths, longer FS pulses can help to minimize the effects. Alternatively, multi-component fitting is another possible solution. The effect of the FS pulse BW on bi-component signal decay fitting will be investigated in future studies.Acknowledgements
No acknowledgement found.References
[1] Chang EY et al, Muscles Ligaments Tendons J. 2015 Jul 3;5(2):58-62
[2] Juras V et al, Eur Radiol. 2013 Oct;23(10):2814-22
Figures
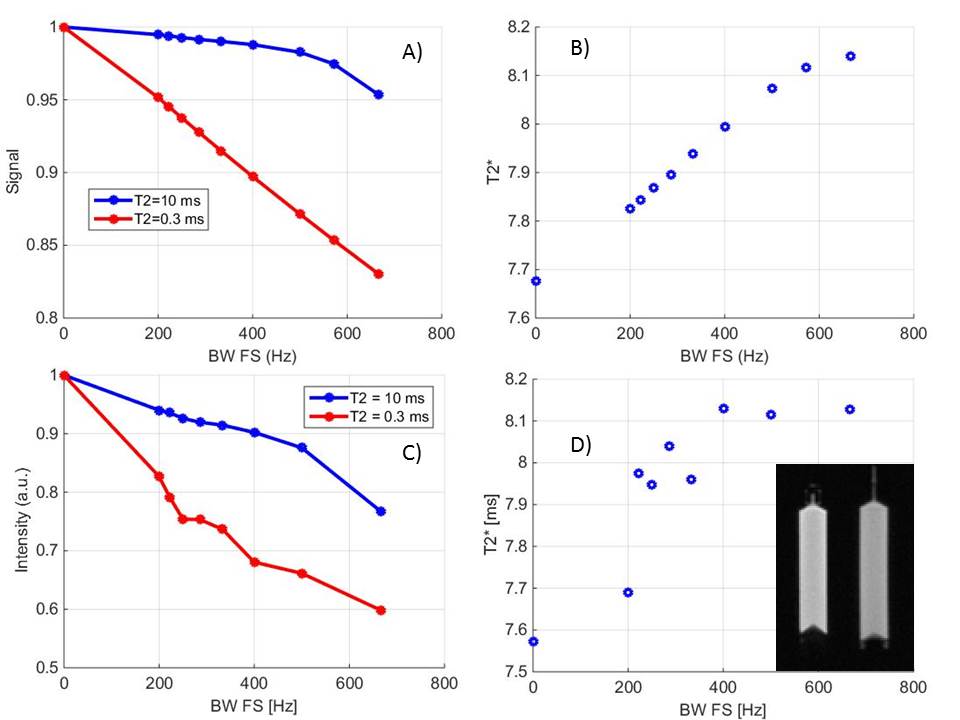
A)
Simulated signals as a function of FS BW for two different T2
tissues. B) Corresponding T2 fit values of combined (e.g.
two-component) signals. C-D) Experimental verification of simulations in
Fig.A&B using the phantom setup shown in the insert of Fig.1D.
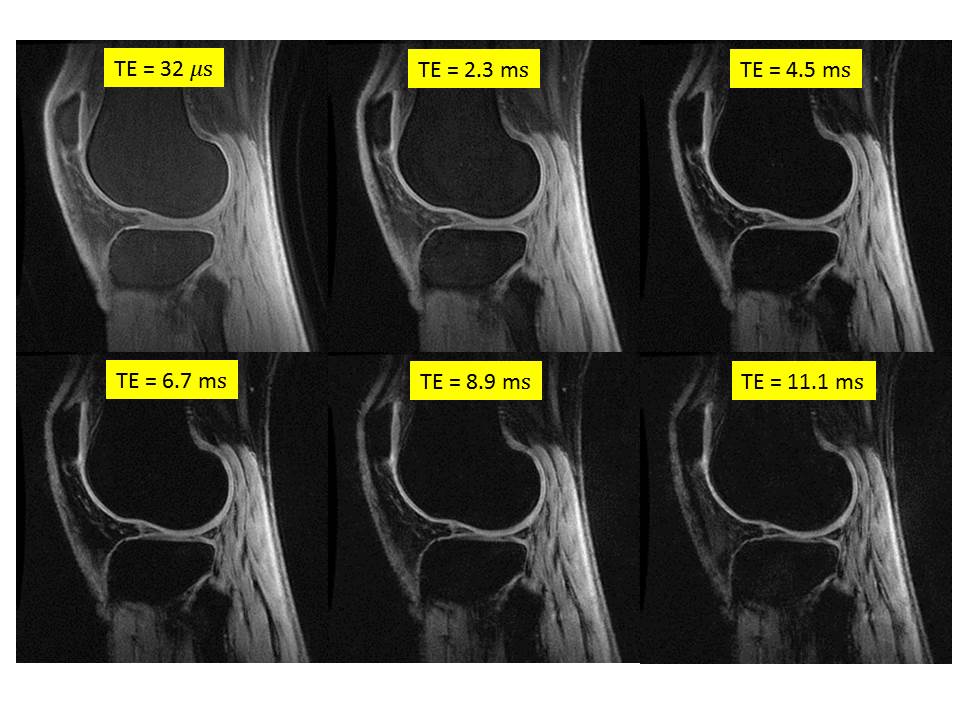
Sagittal
in-vivo knee slices at various TE’s.
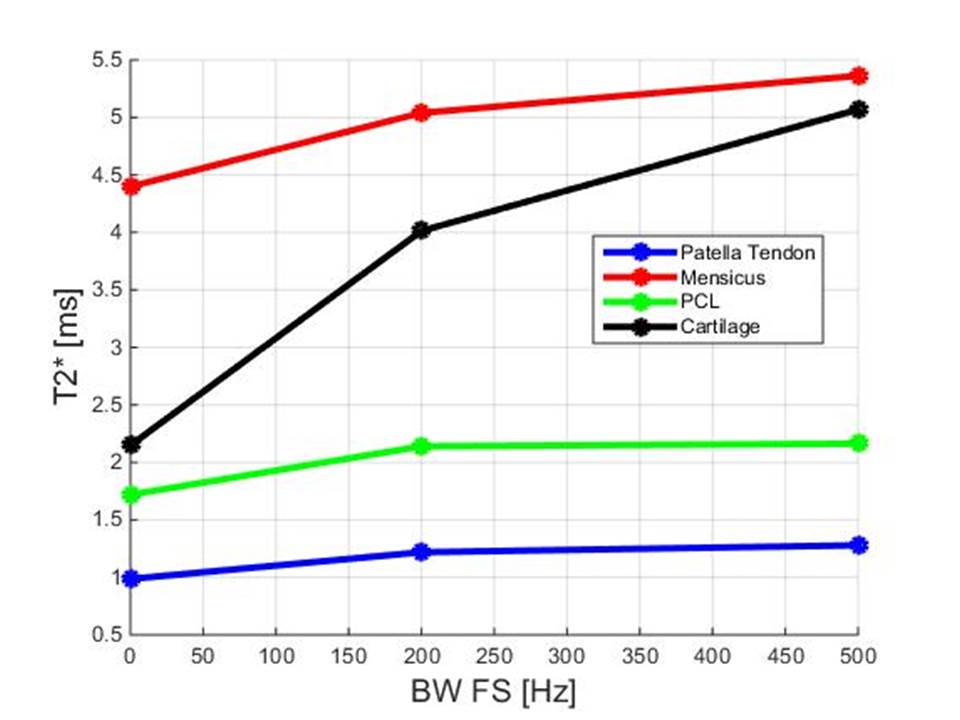
Experimentally
fitted T2 values measured in various ROI of the in-vivo knee shown
in Fig.2.