5091
High-resolution In-vivo Mapping of the Proteoglycan-bound Water Fraction in Articular Cartilage of the Human Knee Joint1National Institute on Aging (NIA), National Institutes of Health (NIH), Baltimore, MD, United States
Synopsis
We demonstrate the clinical feasibility of high-resolution (HR) in-vivo mapping of proteoglycan water fraction (PgWF) in human knee cartilage by combining the mcDESPOT protocol for data acquisition and Bayesian Monte Carlo (BMC) analysis for data analysis. For all subjects, PgWF maps derived from low resolution datasets exhibited partial volume and magnetic susceptibility effects leading, respectively, to an overestimation and an underestimation of PgWF values in several cartilage regions. These issues were absent in HR PgWF maps. Further, BMC-mcDESPOT demonstrates high reproducibility and stability in the estimation of PgWF as compared to the conventional stochastic region contraction (SRC) algorithm.
PURPOSE:
Several studies have sought to define proteoglycan water fraction (PgWF) as an indicator of cartilage degeneration.1-5 It has been shown, using the multicomponent driven equilibrium single-pulse observation of T1 and T2 (mcDESPOT) protocol,4-5 that PgWF is a potential clinical marker for distinguishing between normal and degenerative cartilage.5 In those studies, the image resolution was suboptimal, given the curvature and thinness of knee cartilage. At this modest resolution, images are prone to partial volume effects that may bias PgWF estimates. A direct solution is to decrease voxel size. However, this comes at the expense of decreased signal-to-noise ratio, which reduces the reliability of parameter determination from mcDESPOT.6-10 In recent studies,6,9 it has been shown that parameter estimation from mcDESPOT was greatly enhanced using a new Bayesian Monte Carlo (BMC) analysis. Here, we demonstrate the clinical feasibility of stable, high-resolution (HR) in-vivo mapping of PgWF in human knee cartilage using BMC-mcDESPOT, and compare our results with the conventional stochastic region contraction (SRC) analysis.4-5MATERIALS & METHODS:
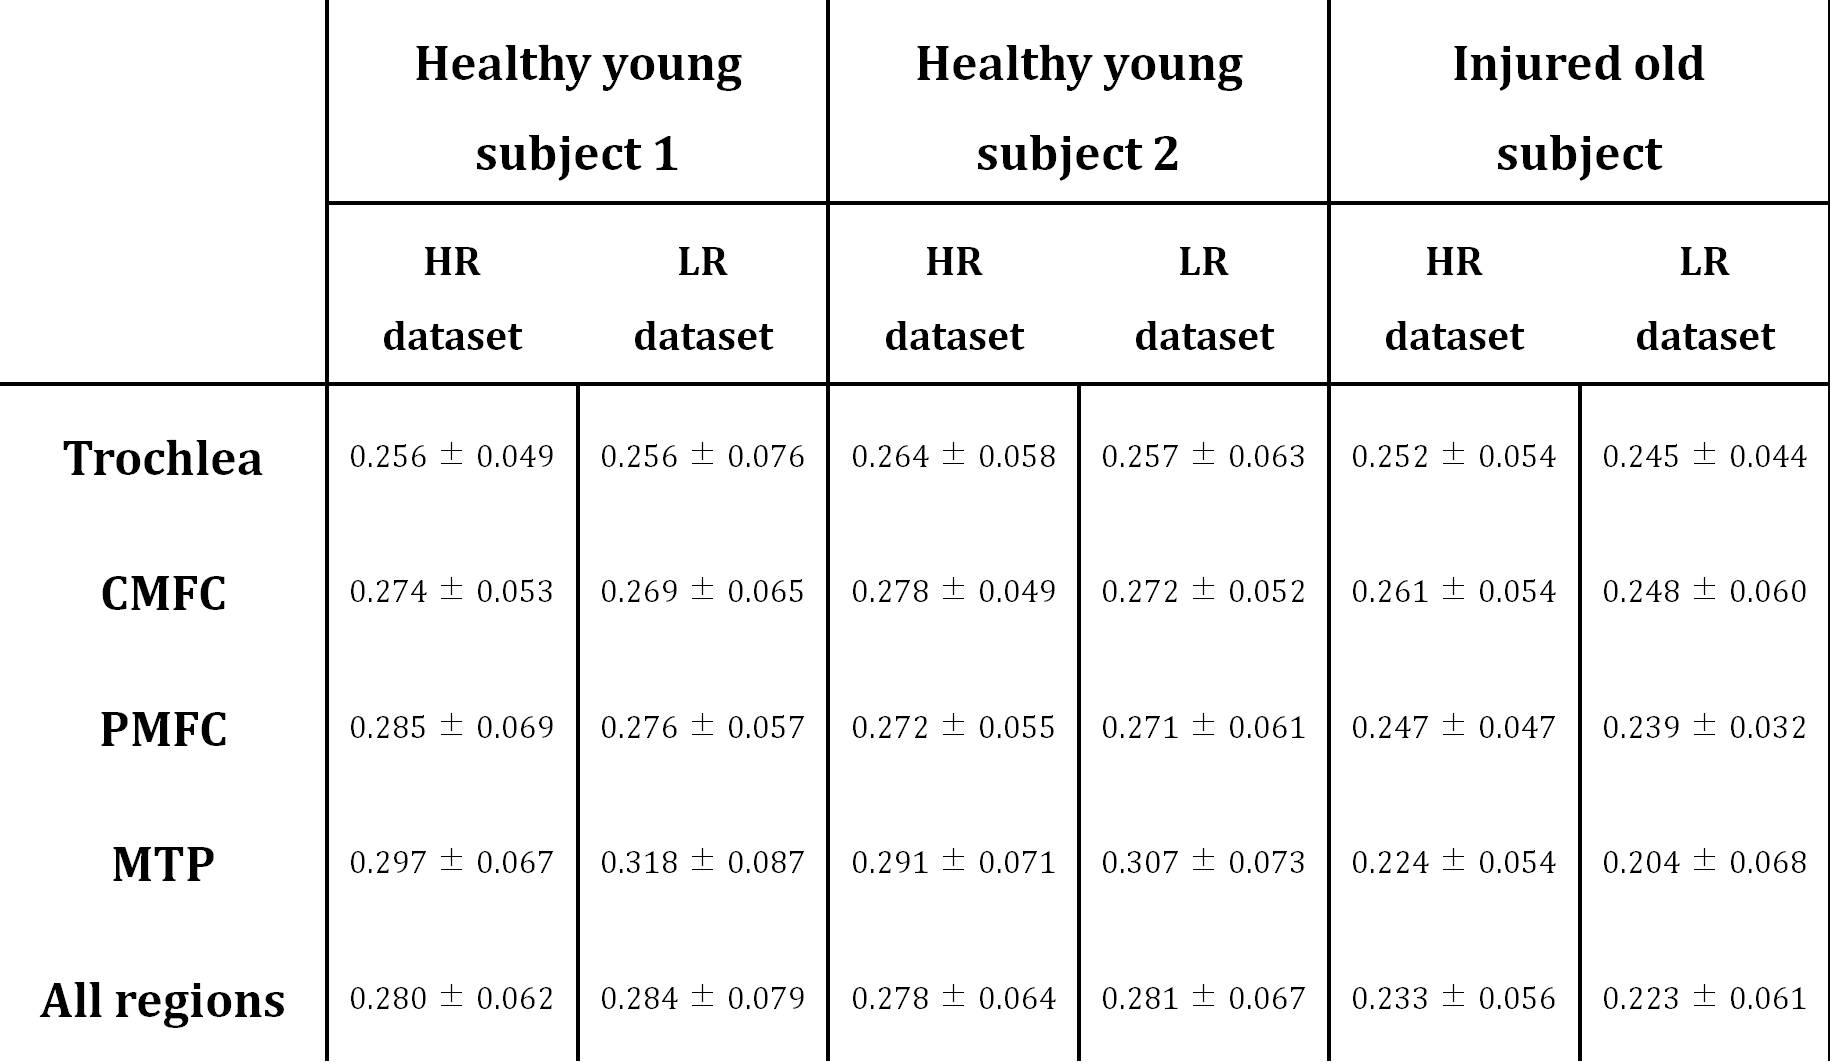
Data acquisition: mcDESPOT imaging data were collected from the knees of 22- and 23-year-old healthy males and from the knee of an 86-year-old man with chronic knee pain dating from a distant skiing injury followed by arthroscopic surgery. For each subject, low-resolution (LR) (voxel size=0.625mm x0.625mm x3mm, total acquisition time (TAT)=~11min), and HR (voxel size=0.4mm x0.4mm x1.5mm, TAT=~28min) datasets were acquired. Two independent HR datasets were obtained from the knees of the young subjects to evaluate the reproducibility of BMC and SCR in PgWF determination. Data analysis: All datasets were analyzed using a two-component echo-time-corrected mcDESPOT model for estimation of PgWF.11 The reproducibility of BMC and SRC for HR mapping of PgWF was assessed by analyzing the two independent HR datasets acquired in immediate succession from the knees of the young subjects. The mean and standard deviation (SD) of PgWF values were calculated over all cartilage regions of several slices. Further, HR and LR PgWF maps derived using BMC were compared for all scanned subjects. The mean and SD of PgWF values were calculated in five different regions of interest (ROIs).RESULTS & DISCUSSION:
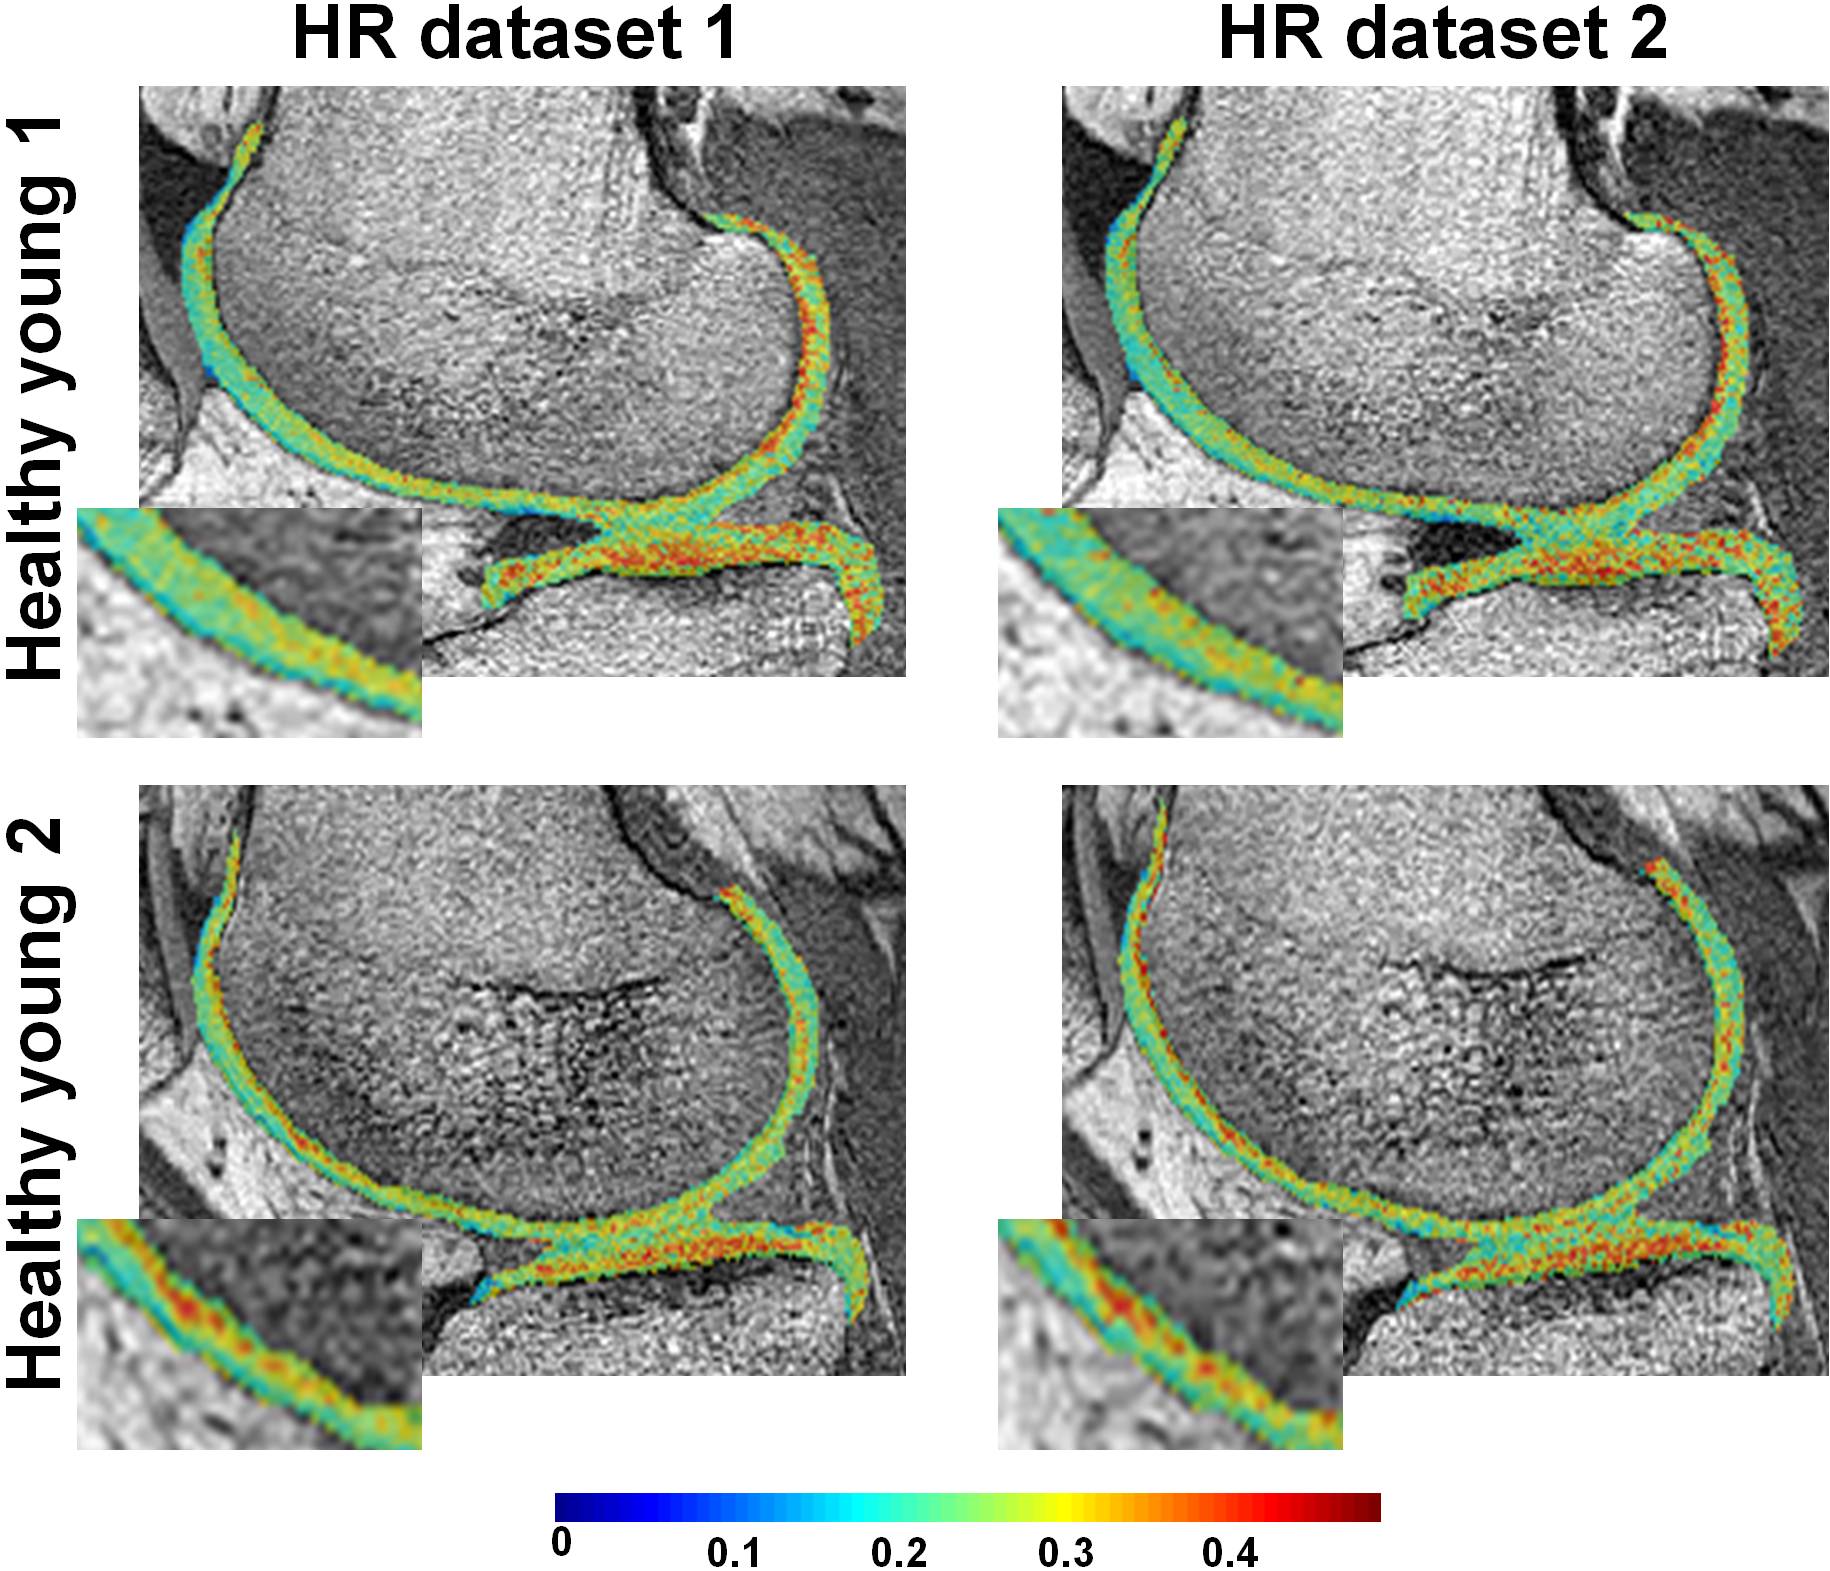
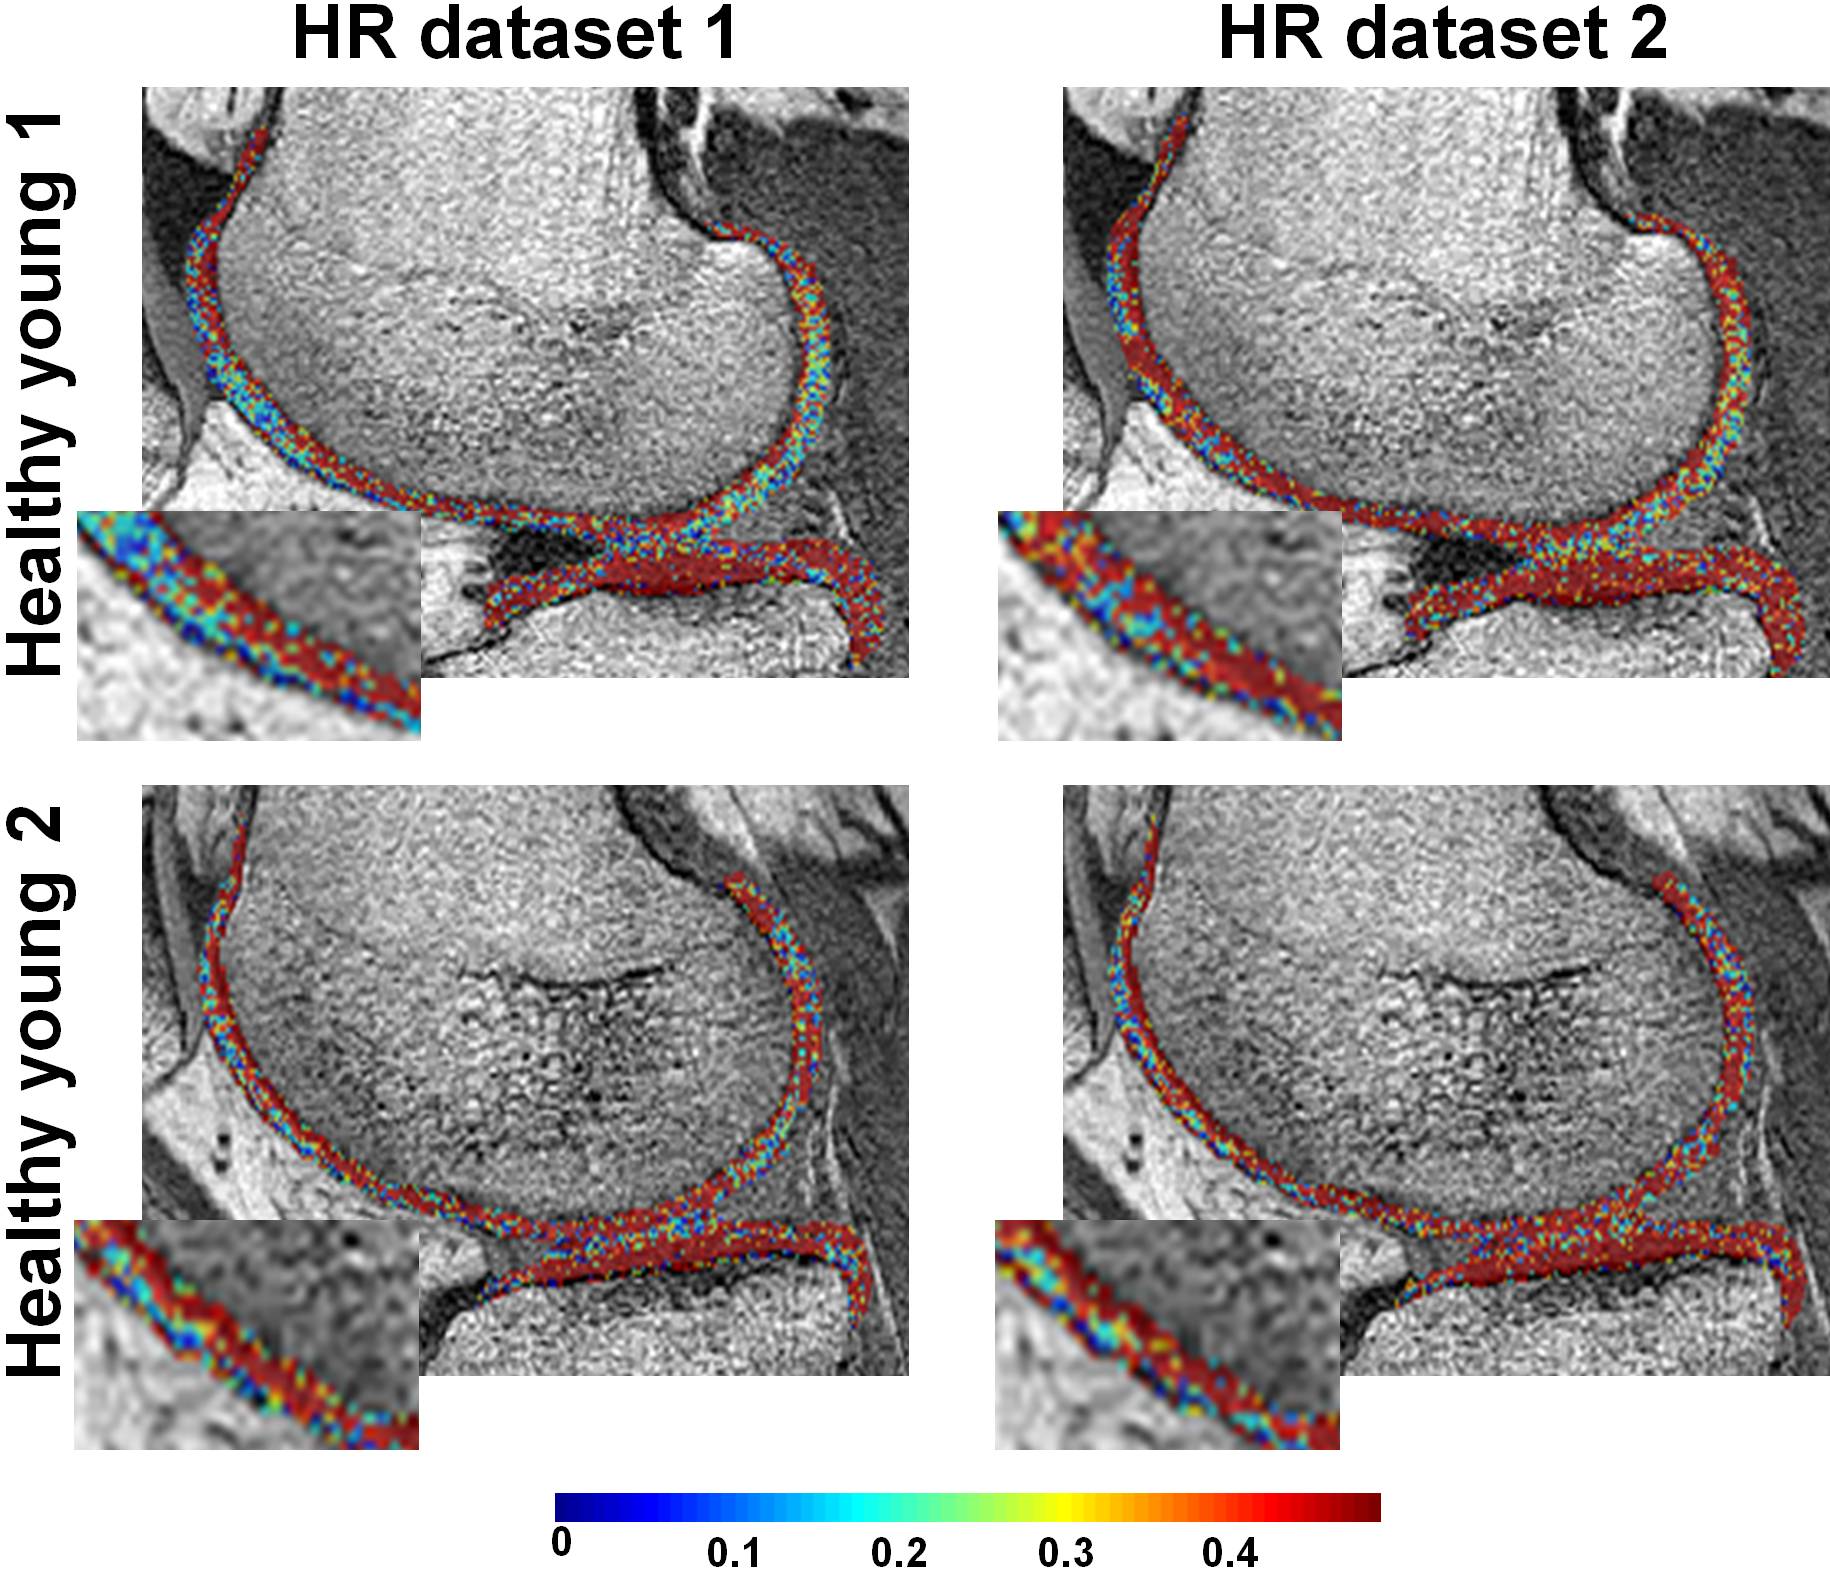
Fig.1 shows examples of HR PgWF maps from the knee cartilage of the two young healthy subjects derived using BMC- (Fig.1a) or SRC- (Fig.1b) mcDESPOT. Visual inspection of the BMC results shows that the details of the voxel-by-voxel variation in PgWF is consistent between the two datasets, indicating the relative lack of sensitivity of BMC to experimental noise (Fig.1a). In addition, the mean and SD of the estimates of PgWF were essentially identical between the two datasets (Table1). In contrast, detailed comparison of the two successive images analyzed using SRC shows PgWF estimates clustered preferentially towards the upper search space limit, and substantial variation between these two independent acquisitions. Consistent with this, the mean and SD values of the estimates of PgWF (Table1) were both substantially higher than those calculated using BMC.
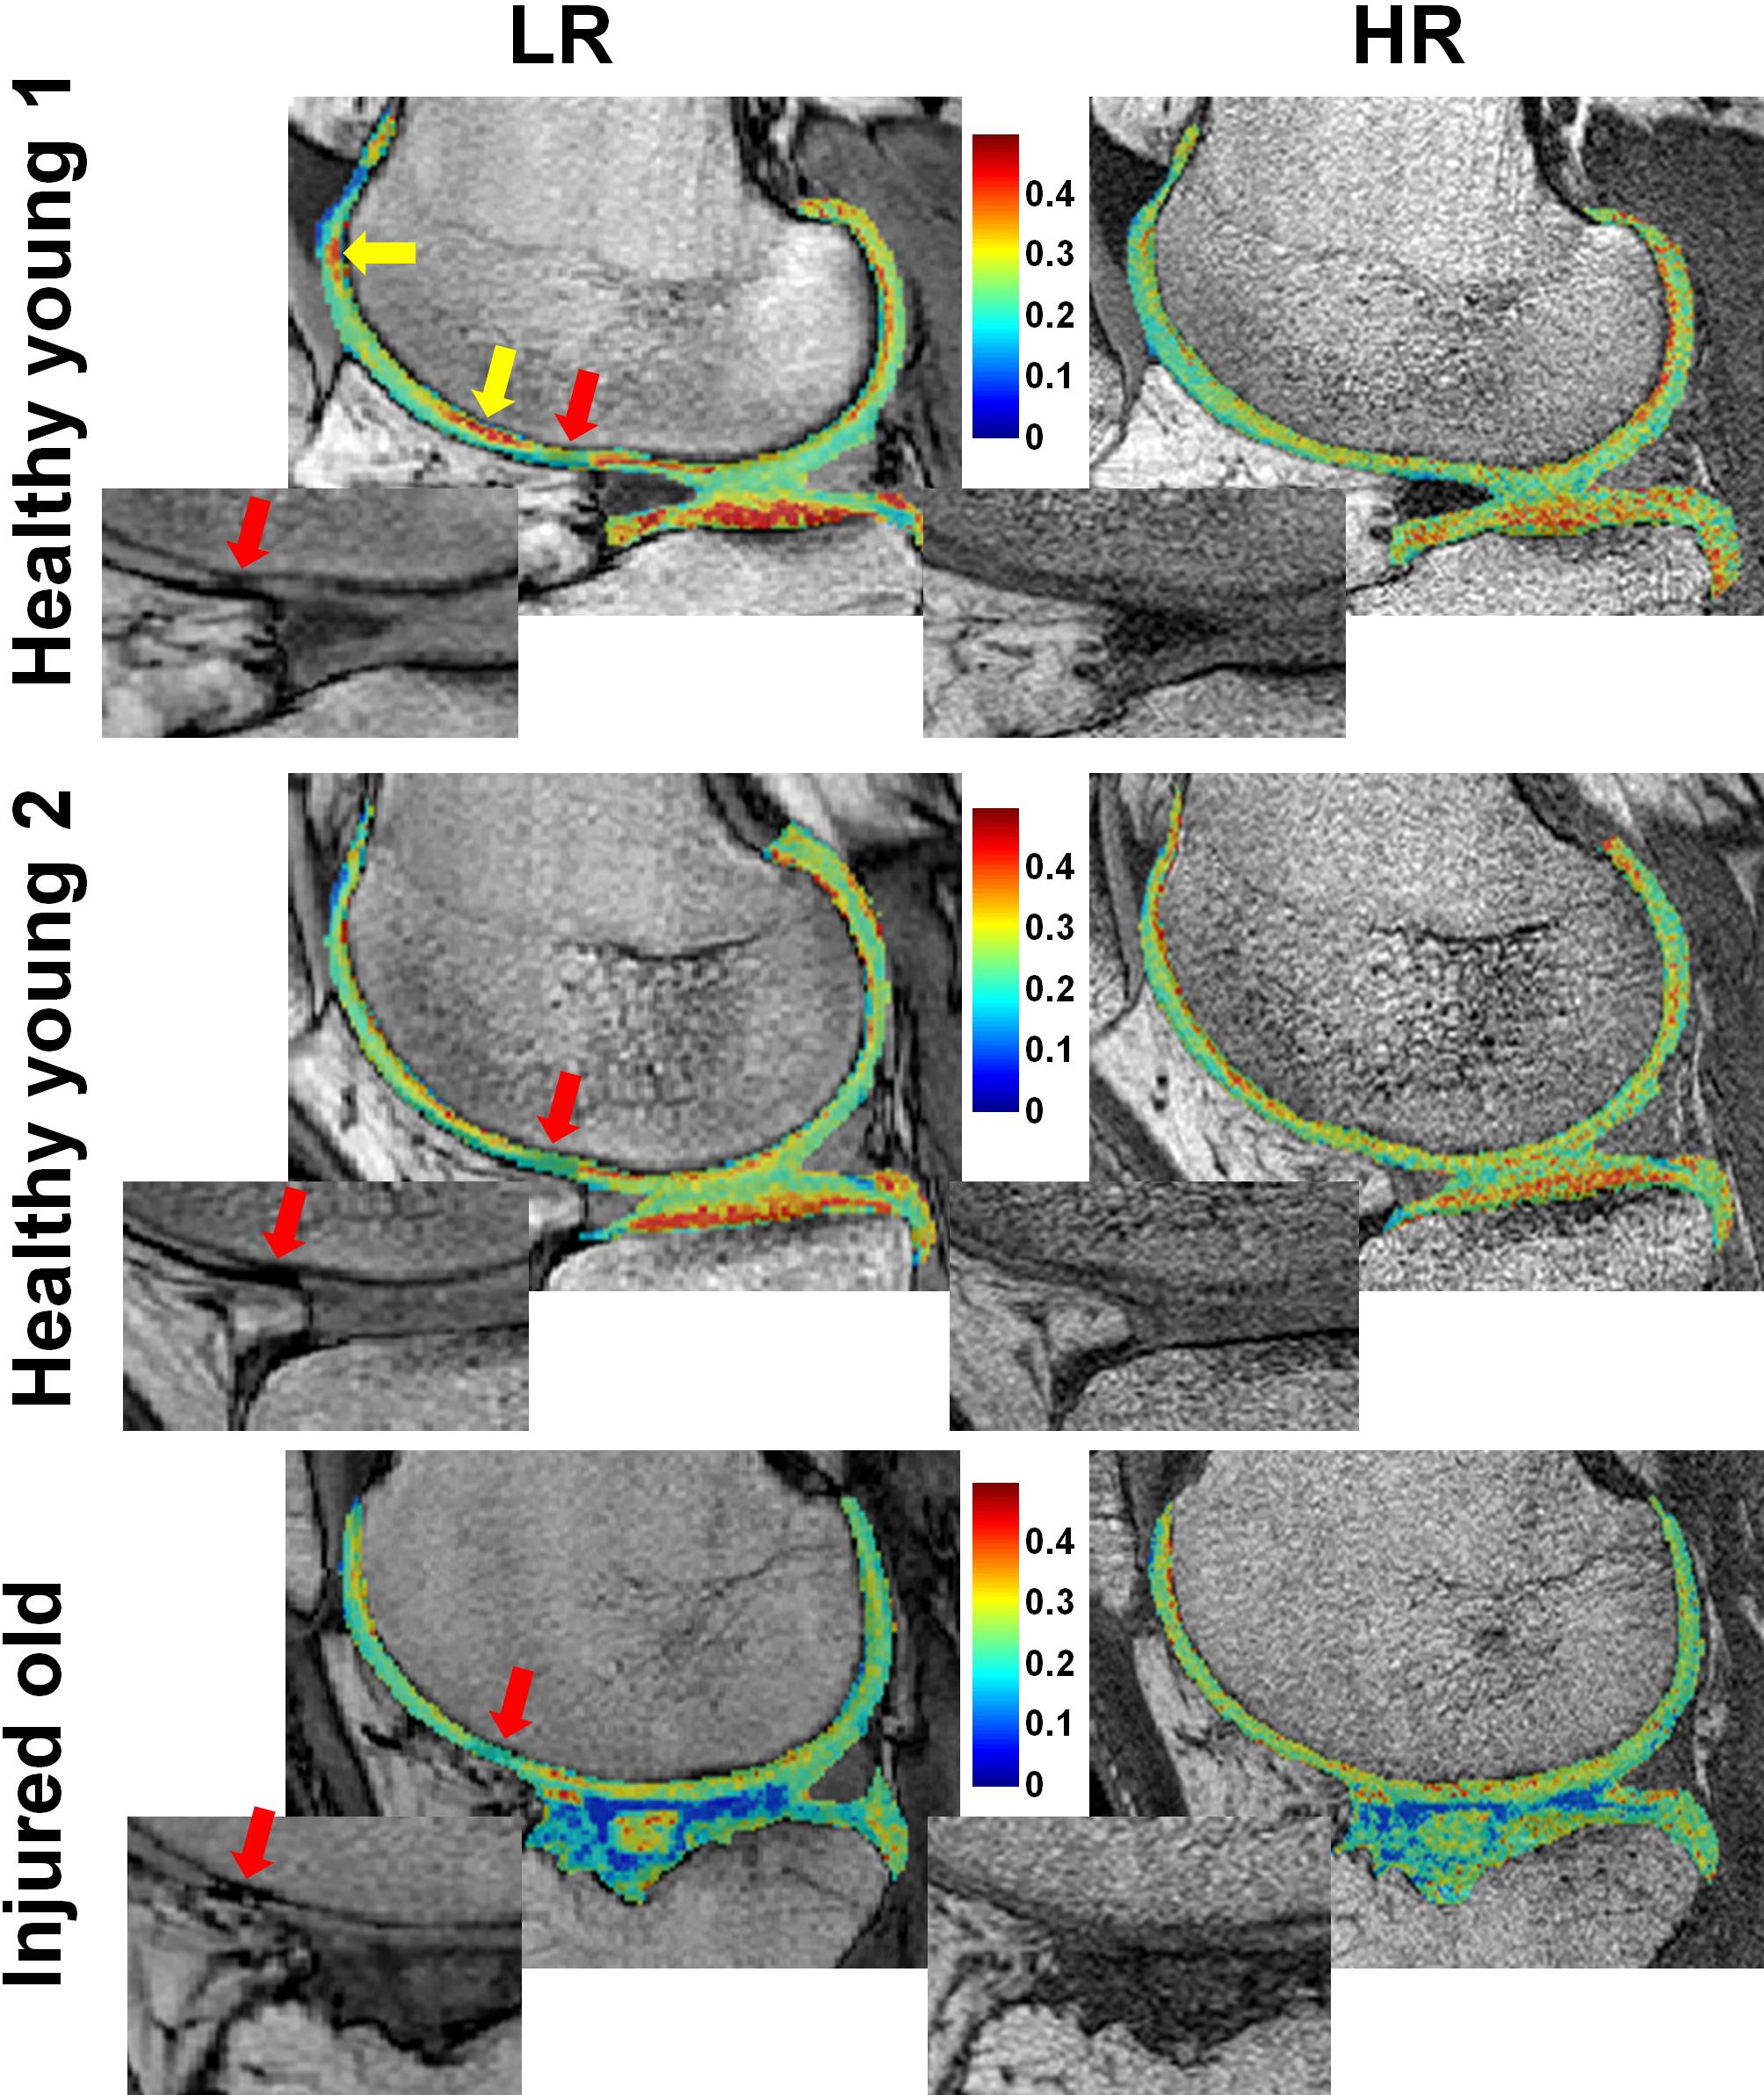
Fig. 2 shows examples of LR and HR BMC-mcDESPOT PgWF maps. As noted above, the HR images were acquired with a voxel volume that is ~5 times lower than in LR images. For each participant, LR and HR PgWF maps (Fig.2) and mean and SD values (Table2) were similar over all cartilage regions. Moreover, the older subject, with chronic knee pain exhibited lowed PgWF values compared to the young subjects (Fig.2 and Table2), consistent with the known effects of aging and injury on cartilage. The red arrows show regions with low PgWF values derived from the LR images. Corresponding zoomed regions from the LR SPGR images show that signal intensity in these regions was very low, indicating the presence of magnetic susceptibility effects. Indeed, this artifact was not visible in either the HR SPGR images, due to the relatively low magnetic field variation within a voxel, or LR and HR bSSFP images, in which T2* refocusing occurs at the time of signal acquisition. The yellow arrows indicate regions with PgWF very different between the LR and HR maps. Such differences are particularly prominent at the interfaces between bone and cartilage and are attributable to partial volume effects.
CONCLUSION:
BMC-mcDESPOT permits reproducible HR in-vivo mapping of PgWF in human knee-cartilage in a clinically-feasible acquisition time. HR mapping reduces partial volume and magnetic susceptibility artifacts compared to LR mapping.Acknowledgements
This work was supported by the Intramural Research Program of the NIH, National Institute on Aging.References
1. Reiter DA, Lin PC, Fishbein KW, et al. Multicomponent T2 relaxation analysis in cartilage. Magn Reson Med. 2009;61(4):803-809.
2. Reiter DA, Roque RA, Lin PC, et al. Improved specificity of cartilage matrix evaluation using multiexponential transverse relaxation analysis applied to pathomimetically degraded cartilage. NMR Biomed. 2011;24(10):1286-1294.
3. Reiter DA, Roque RA, Lin PC, et al. Mapping proteoglycan-bound water in cartilage: Improved specificity of matrix assessment using multiexponential transverse relaxation analysis. Magn Reson Med. 2011;65(2):377-384.
4. Liu F, Chaudhary R, Hurley SA, et al. Rapid multicomponent T2 analysis of the articular cartilage of the human knee joint at 3.0T. J Magn Reson Imaging. 2014;39(5):1191-1197.
5. Liu F, Choi KW, Samsonov A, et al. Articular cartilage of the human knee joint: In vivo multicomponent T2 analysis at 3.0 T. Radiology. 2015;277(2):477-488.
6. Bouhrara M, Spencer RG. Improved determination of the myelin water fraction in human brain using magnetic resonance imaging through Bayesian analysis of mcDESPOT. NeuroImage 2016;127:456-471.
7. Zhang J, olind SH, Laule C, et al. Comparison of myelin water fraction from multiecho T2 decay curve and steady-state methods. Magn Reson Med 2015;73(1):223-232.
8. Lankford CL, Does MD. On the Inherent Precision of mcDESPOT. Magn Reson Med. 2013; 69(1):127-136.
9. Bouhrara M, Spencer RG. Rapid Simultaneous High-resolution Mapping of Myelin Water Fraction and Relaxation Times in Human Brain using BMC-mcDESPOT. NeuroImage. 2016;dx.doi.org/10.1016/j.neuroimage.2016.09.064.
10. Bouhrara M, Reiter DA, Celik H, et al. Analysis of mcDESPOT- and CPMG-derived parameter estimates for two-component nonexchanging systems. Magn Reson Med. 2016;75(6):2406-2420.
11. Bouhrara M, Spencer RG. Incorporation of nonzero echo times in the SPGR and bSSFP signal models used in mcDESPOT. Magn Reson Med. 2015;74(5):1227-1235.
Figures