5089
Knee cartilage T2 mapping with T2-prepared isotropic 3D GRE has equivalent precision and higher accuracy compared to multi-slice TSE in volunteers and patients at 3T1Department of Radiology, University Hospital (CHUV) and University of Lausanne (UNIL), Lausanne, Switzerland, 2Division of Cardiology, Department of Medicine, Johns Hopkins University, Baltimore, United States, 3Division of MR Research, Department of Radiology, Johns Hopkins University, Baltimore, United States
Synopsis
The goal of this study was to compare the precision and accuracy of a novel isotropic 3D T2-prepared gradient-echo T2 mapping technique (Iso3DGRE) with the clinical standard 2D multi-slice turbo spin-echo (MS-TSE) for T2 mapping of knee cartilage at 3T. A phantom study was performed to determine the accuracy of both techniques against the reference standard spin echo (SE). T2 mapping of knee cartilage was then performed in 13 healthy volunteers and 5 patients with late-stage osteoarthritis. Compared to MS-TSE, Iso3DGRE T2 mapping resulted in T2 values with equivalent precision and slightly higher accuracy at a higher spatial resolution.
Purpose
To evaluate the precision and accuracy of T2
quantification in knee cartilage at 3T with a novel isotropic three-dimensional
T2-prepared
gradient-echo (Iso3DGRE)1 technique and with the clinical
standard multi-slice turbo spin-echo (MS-TSE) technique.
Methods
All experiments were performed on a 3T clinical system (Magnetom Prisma/Skyra, Siemens) with a 15-channel Tx/Rx knee coil. Phantom studies were performed to test the T2 mapping accuracy of the Iso3DGRE and MS-TSE techniques. Five phantoms with different T2 values that consisted of 0.73µM NiCl2 and 3-5%w/v of agar2 were constructed, and T2 maps were acquired with both pulse sequences. Spin-echo (SE) T1 and T2 mapping was used to obtain reference values for the phantoms. The correlation and accuracy of both T2 mapping techniques and the reference standard SE were assessed with a linear regression and Bland-Altman analysis. Next, T2 maps of the knee were acquired with Iso3DGRE and MS-TSE in 13 healthy volunteers (9 right, 8 males, weight 74.0±17.7kg, age 31.2±4.6years) and 5 patients (4 right, 1 male, weight 74.4±7.7kg, age 70.8±7.5years) with late stage osteoarthritis (OA). Iso3DGRE T2 maps were acquired with the following parameters: 4 adiabatic T2 preparations (TET2Prep=0-23-38-53ms), repetition time TR=4.9ms, echo time TE=2.1ms, 100 k-space lines per T2prep, voxel volume=0.63×0.63×0.63mm3, matrix size=272×280×144, RF excitation angle 15°, 2×GRAPPA acceleration, and total scan time=10min08s. The 4 input images were coregistered using 3D rigid registration to account for subject motion during the acquisition (Matlab). Fourteen continuous Iso3DGRE slices, which corresponded to three MS-TSE slices and covered the central region of the lateral and medial femorotibial compartments, were analyzed. MS-TSE parameters included: TR=1630ms, incremental TE=13-26-39-52-65-78ms, acquired voxel volume=0.52×0.73x3mm3, interpolated voxel volume=0.3×0.3×3mm3, matrix size=320×224, 36 slices, 2×GRAPPA acceleration, phase partial Fourier acquisition=5/8, and total scan time=7min09s. The MS-TSE T2 maps were reconstructed without the first echo in order to minimize T2 overestimation3. T2 values were compared between healthy subjects and patients in four different regions of interest (ROI) in the lateral and medial femorotibial cartilage with a two-tailed Student’s t-test. The precision was calculated as the ratio of the standard deviation and the average T2 value within the regions of interest (i.e. relative standard deviation).Results and Discussion
SE-based mapping resulted in T1=1340±15ms for all phantoms and in T2=26.0±1.0ms to T2=49.4±1.6ms, and a high degree of agreement was found between the SE T2 maps and those of both techniques (Figure 1). Iso3DGRE T2 mapping slightly underestimated the SE T2 values (linear fit slope 0.9±0.05), while the MS-TSE technique slightly overestimated them (linear fit slope 1.05±0.07), as established in several prior studies4,5. Given the negligible linear fit offset (0.2±1.7ms), the relationship between the T2 values obtained with the SE and the Iso3DGRE technique was directly proportional, as opposed to that between the SE and MS-TSE T2 values (offset 3.5±2.6ms).
The Bland-Altman analysis resulted in a smaller bias for the Iso3DGRE (-3.7ms) than for the MS-TSE technique (5.4ms), indicating that the Iso3DGRE technique had slightly higher accuracy in T2 determination. The 95% confidence interval was the same for both techniques (±2.3ms, Figure 2).
Similar to what was observed in the phantom study, the Iso3DGRE T2 values were significantly lower than those determined with the MS-TSE technique (p<0.001) in both in vivo studies (Table 1). For the volunteer studies, the differences in T2 values between the two techniques were similar to those in the phantom studies. However, this was not the case for the patient studies, which might be caused by increased partial volume effects due to subject motion (MS-TSE input images were not coregistered). The relative standard deviations were 29.4±5.4% (Iso3DGRE) and 27.7±3.8% (MS-TSE) for the healthy volunteers (p=0.06), and 28.3±8.1% (Iso3DGRE) and 31.5±5.4% (MS-TSE) for the patients (p=0.15), indicating equivalent precision of the two techniques, even if the acquired voxel volume for Iso3DGRE was 4.5 times smaller. Moreover, in in vivo studies, the isotropic data allowed the evaluation of distribution of cartilage T2 values in any reformatted plane (Figure 3).
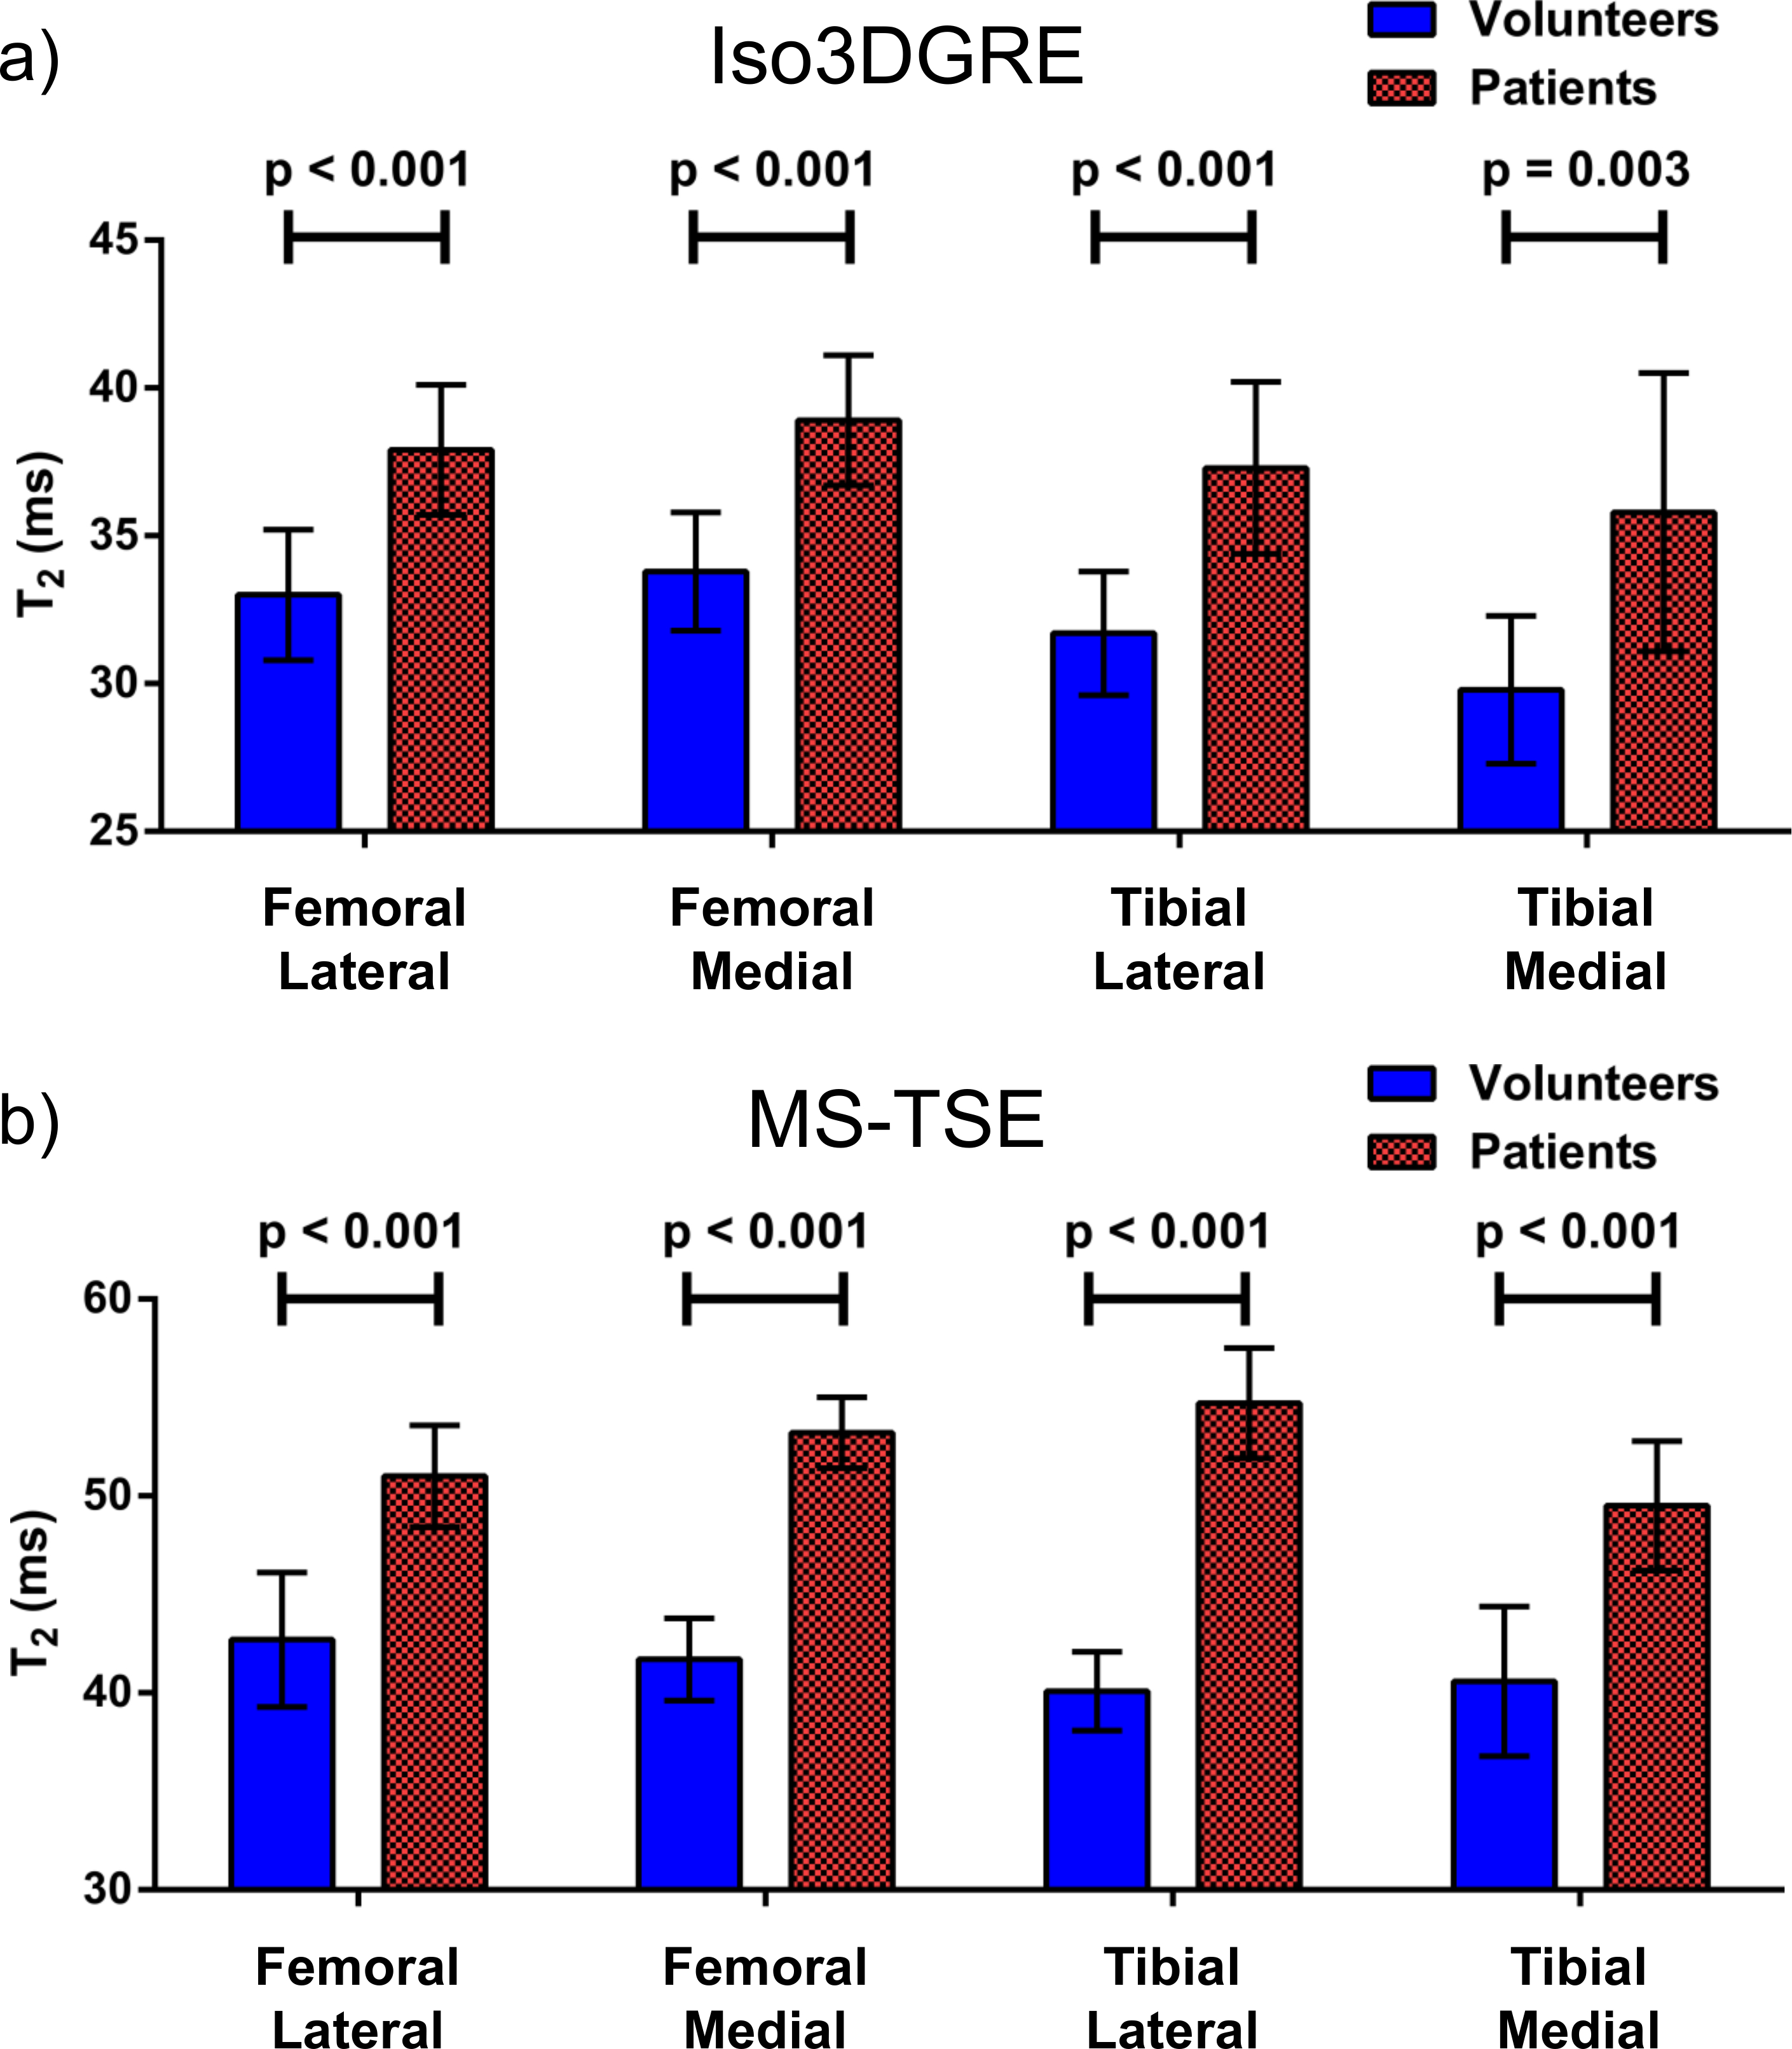
Finally, in each compartment, the patients’ average T2 value obtained with both techniques was statistically significantly higher than those from healthy volunteers (Figure 4).
Conclusions
This study demonstrated that the Iso3DGRE T2 mapping technique provided T2 values in knee cartilage that were as precise as those obtained with the MS-TSE technique. Although the Iso3DGRE technique slightly underestimated and the MS-TSE technique overestimated T2 values, the accuracy relative to reference standard SE T2 mapping was slightly better. Moreover, the Iso3DGRE technique allowed for multiplanar reformatting and thus T2 quantification in any plane of interest.Acknowledgements
The authors would like to thank Prof. Matthias Stuber for helpful discussions. This work was supported by grants from the Pierre Mercier Foundation, the Swiss Multiple Sclerosis Society and the Swiss National Science Foundation (PZ00P3-154719) to RBvH, as well as by the Centre d’Imagerie BioMédicale (CIBM) of the UNIL, UNIGE, HUG, CHUV, EPFL, and the Leenaards and Jeantet Foundations.References
[1] Colotti et al., Proc. Intl. Soc. Mag. Reson. Med. 24. 4489 (2016) [2] Kraft et al., Magn Reson Med 5:555-562 (1987) [3] Smith et al., J Magn Reson Imaging 14:50-55 (2001) [4] Maier et al., J Magn Reson Imaging 17:358-364 (2003) [5] Juras et al., Eur Radiol 26(6):1905-12 (2016) [6] Du et al., Proc. Intl. Soc. Mag. Reson. Med. 18. 3199 (2010).Figures