5088
Magnetic resonance imaging of the zone of calcified cartilage (ZCC) in the knee joint using 3D UTE Cones sequences1University of California, San Diego, San Diego, CA, United States, 2Radiology, Third Affiliated Hospital of Southern Medical University (Academy of Orthopedics · Guangdong Province), Guangzhou, People's Republic of China, 3GE Healthcare, San Diego, CA, United States, 4Radiology Service, VA San Diego Healthcare System, San Diego, CA, United States
Synopsis
The zone of calcified cartilage (ZCC) is a thin layer between articular cartilage and bone. The ZCC plays an important role in the pathogenesis of osteoarthritis (OA) but has never been imaged in vivo with magnetic resonance (MR) imaging techniques. In this study we aimed to investigate the feasibility of direct imaging of the ZCC in healthy volunteers using a three dimensional (3D) ultrashort echo time (UTE) Cones sequence on a clinical whole body 3T scanner.
Introduction
Articular cartilage has a layered structure which can be divided into four zones: the superficial zone, the transitional zone, the radial zone and the zone of calcified cartilage (ZCC) [1]. The ZCC is a highly modified mineralized region of articular cartilage that forms an important interface between cartilage and bone for both solute transportation and force transmission. The ZCC plays a key role in the pathological changes of osteoarthritis (OA) and may change dramatically over the course of the disease [2, 3]. Direct imaging of the ZCC in vivo may be important for diagnosis and monitoring treatment of OA. In the past, the feasibility of direct imaging of the ZCC based on two dimensional (2D) ultrashort echo time (UTE) magnetic resonance (MR) techniques has been demonstrated ex vivo [4]. However, in vivo imaging of the ZCC has many challenges, including long scan times to fulfill the requirements for high spatial resolution in order to resolve the very thin layer (on the order of 0.1 mm) and 3D imaging to completely sample the structure with curved morphology. In this study, we aimed to develop an interleaved 3D UTE Cones multi-echo imaging protocol for volumetric mapping of the ZCC using human cadaveric knee joint specimens and knees of healthy volunteers on a clinical 3T scanner.
Methods
An interleaved dual-echo 3D fat saturated UTE Cones acquisition protocol was implemented to image the ZCC using a 3T whole-body GE scanner. The Cones sequence employs a short pulse excitation followed by 3D spiral sampling with conical view ordering, which together with anisotropic imaging (high in-plane resolution and thicker slices) allows for fast volumetric imaging of the knee joint. Typical imaging parameters included: FOV = 8×8×3 cm3, matrix = 256×256×30, acquired voxel size = 0.3×0.3×0.1 mm3, flip angle = 10°, bandwidth = 125 kHz, TR = 90 ms, dual-echo scan with three acquisitions (i.e. 0.032/4.3, 0.3/6.6, 0.8/8.8 ms), scan time of 10.6 min. For the human cadaveric knee joint specimens, a series of TEs (TEs = 0.1, 0.2, 0.4, 0.6, 0.9, 2.2, 6.6 ms) were acquired for more accurate T2* measurements. Echo subtraction was used for high contrast depiction of the ZCC and other soft tissue calcification. T2* was fitted using a truncated single-component model as shown below:
S = α × e -TE/T2* [1]
Where S is the signal intensity and T2* is the fitting parameter.
Results
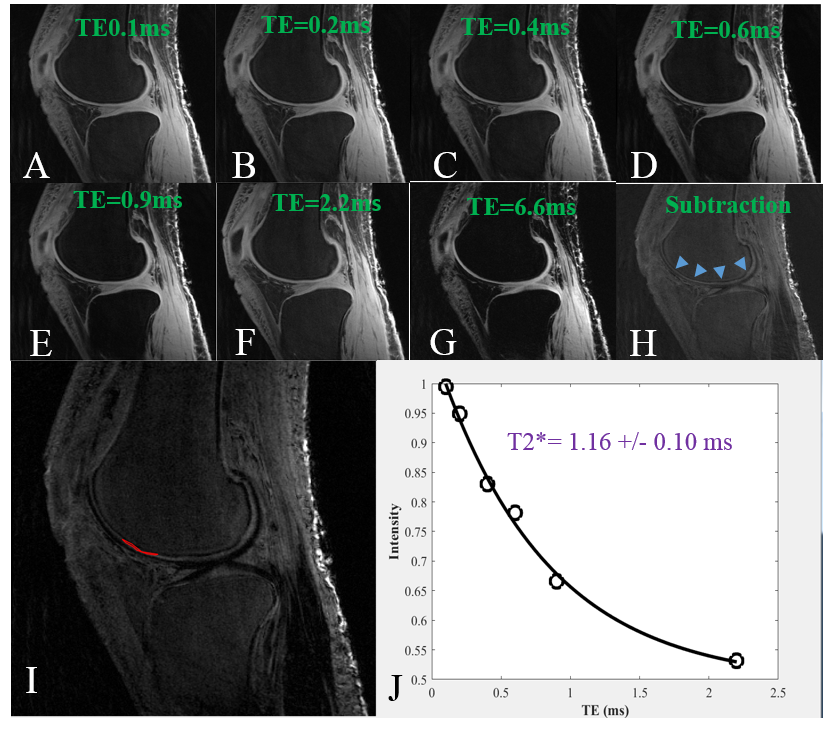
Figure 1 shows selected 3D UTE Cones imaging of a cadaveric knee joint acquired with different TEs. The ZCC can be better depicted in the subtraction image (Figure H) where a later echo image (Figure G) was subtracted from the first one (Figure A). The UTE images were assessed using single-component analysis at ROIs drawn in the ZCC (Figure I). Figure J shows a representative T2* fitting curve demonstrating a short T2* of 1.16 ± 0.10 ms for this ROI. The ZCC of the cadaver has a short T2* ranging from 0.74 to 3.20 ms (mean ± standard deviation = 1.45 ± 0.66 ms). These values are largely consistent with T2* values derived from high resolution dual echo adiabatic inversion recovery UTE (DIR-UTE) imaging of patellar specimens[4], suggesting that the ZCC can be directly imaged with the 3D UTE Cones sequence.
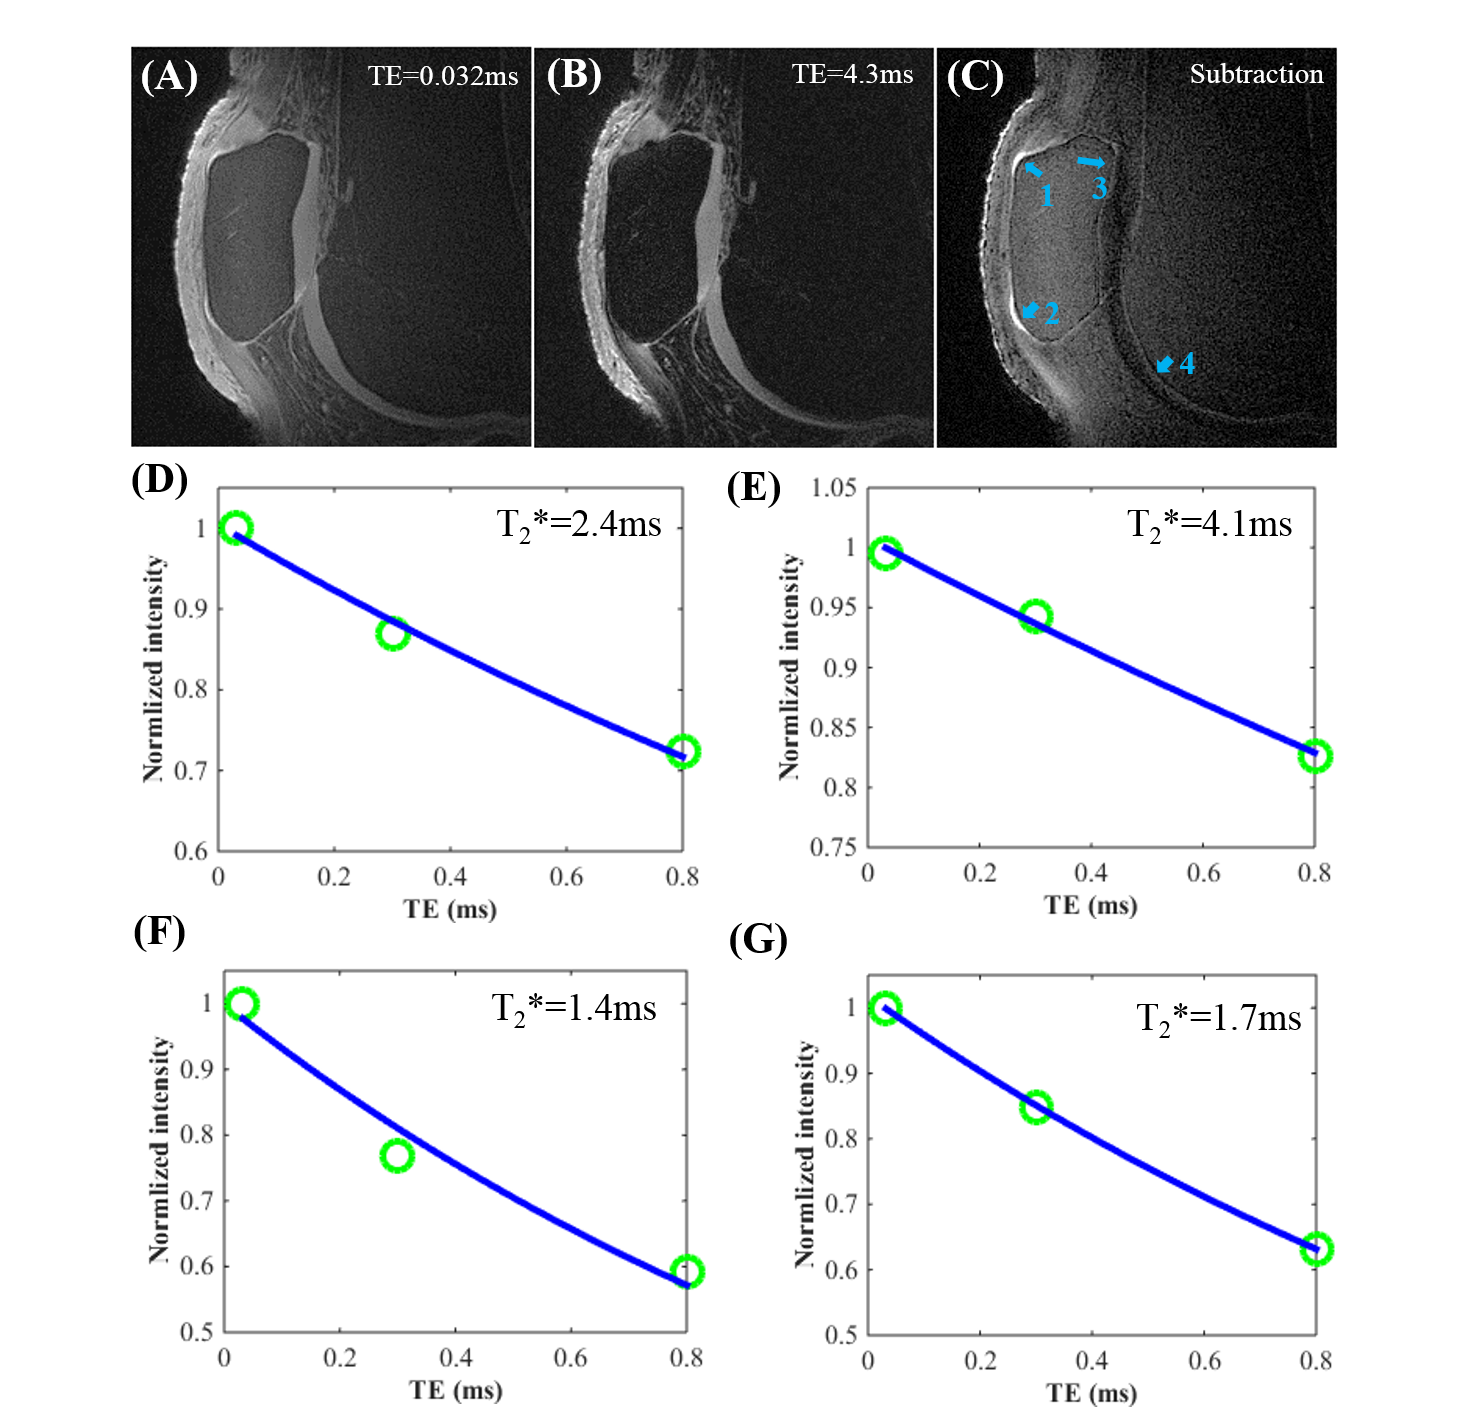
Figure 2 shows 3D UTE Cones images with TEs = 0.032/4.3ms and the corresponding subtraction image (Figure C), which shows high signal intensity for soft tissue calcification (arrows 1 and 2) and the ZCC (arrows 3 and 4). Single-component fitting of the multi-TE data suggested a short T2* of 2.2-4.1 ms for soft tissue calcification and 1-2 ms for the ZCC.
Discussion and Conclusion
These preliminary results show that the high-resolution 3D UTE Cones sequence can be used to directly image the ZCC ex vivo and in vivo using a clinical 3T scanner. The interleaved multi-echo 3D UTE Cones acquisitions can be further used to quantitatively evaluate the T2* relaxation time of the ZCC and soft tissue calcification. Further optimization of the imaging protocol, including thinner slices to minimize partial volume effects, is required and this is an area for future study. Parallel imaging and compressed sensing reconstruction may be used to further reduce the total scan time. Direct imaging of ZCC in vivo may be particularly useful for diagnosis of articular cartilage degeneration and osteoarthritis, as well as for monitoring treatment.Acknowledgements
This work is supported in part by grants from 1R01 AR062581-01A1, 1 R01 AR068987-01, NIH (R01AR062581), VA Clinical Science R&D Service (Merit Award I01CX001388), Guangdong Innovative Research Team Program of China (Grant No. 2011S013), the National Scientific Foundation of China (No. 81471810), the Medical Scientific Foundation of Guangdong Province of China (No. 2014A020211018) and Natural Science Foundation of Guangdong Province (NSFG: 2014A030310360)References
1. Buckwalter JA, Mankin HJ. Articular cartilage: degeneration and osteoarthritis, repair, regeneration, and transplantation. Instr Course Lect 1998; 47:487-504.
2. Revell PA, Pirie C, Amir G, et al. Metabolic activity in the calcified zone of cartilage: observations on tetracycline labelled articular cartilage in human osteoarthritic hips. Rheumatol Int 1990; 10:143-147.
3. Ferguson VL, Bushby AJ, Boyde A. Nanomechanical properties and mineral concentration in articular calcified cartilage and subchondral bone. J Anat 2003; 203:191-202.
4. Du J, Carl M, Bae WC, et al. Dual inversion recovery ultrashort echo time (DIR-UTE) imaging and quantification of the zone of calcified cartilage (ZCC). Osteoarthritis Cartilage 2013; 21:77-85.
Figures