5087
Changes in collagen and proteoglycan in cartilage with OA severity1Department of Radiology, New York University School of Medicine, New York, NY, United States, 2Department of Medicine, New York University School of Medicine, New York, NY, United States
Synopsis
The objective of this work was to investigate differences in cartilage matrix composition and structure across subjects with different stages of OA severity and test if the changes in the collagen network are concomitant or subsequent to the changes in proteoglycan.
INTRODUCTION
Osteoarthritis (OA) is a debilitating disease that affects all tissues in the joint. Changes in articular cartilage, a hallmark of early OA, include increased hydration, proteoglycan (PG) loss, and remodeling of the collagen network.[1-3] While cartilage can to some extent compensate for PG loss, changes in the collagen network are irreversible.[4,5] Diffusion tensor imaging (DTI) of articular cartilage is a novel application that has potential to assess collagen architecture and PG content.[6,7]
The objective of this work was to investigate differences in cartilage matrix composition and structure across subjects with different stages of OA severity and investigate if the changes in the collagen network are concomitant or subsequent to the changes in PG.
METHODS
Subjects
MRI was performed on 6 healthy volunteers (41±7 y) and on the symptomatic knees of 21 patients with tibiofemoral knee OA. OA patients fulfilled the clinical criteria of the American College of Rheumatology. Standardized X-rays within one week of the MRI were scored with Kellgren-Lawrence (KL) grade.[8] 15 OA subjects were KL grade 1 (54±7 y), 6 KL 2 (55±3 y). The study was approved by the Institutional Review Board and all subjects provided written informed consent.
MRI protocol
MRI was performed on a 3 T MRI scanner (Magnetom Prisma, Siemens) using a 15 channel receive knee coil. The protocol included clinical MRI protocol at NYU, and the RAISED sequence (TE/TR=1500/49 ms, 110 spokes, resolution=0.6x0.6x3 mm3, 6 diffusion directions, b-values=0, 300 s/mm2, diffusion time=19 ms, diffusion duration=14.5 ms, acquisition time=17:00 min).
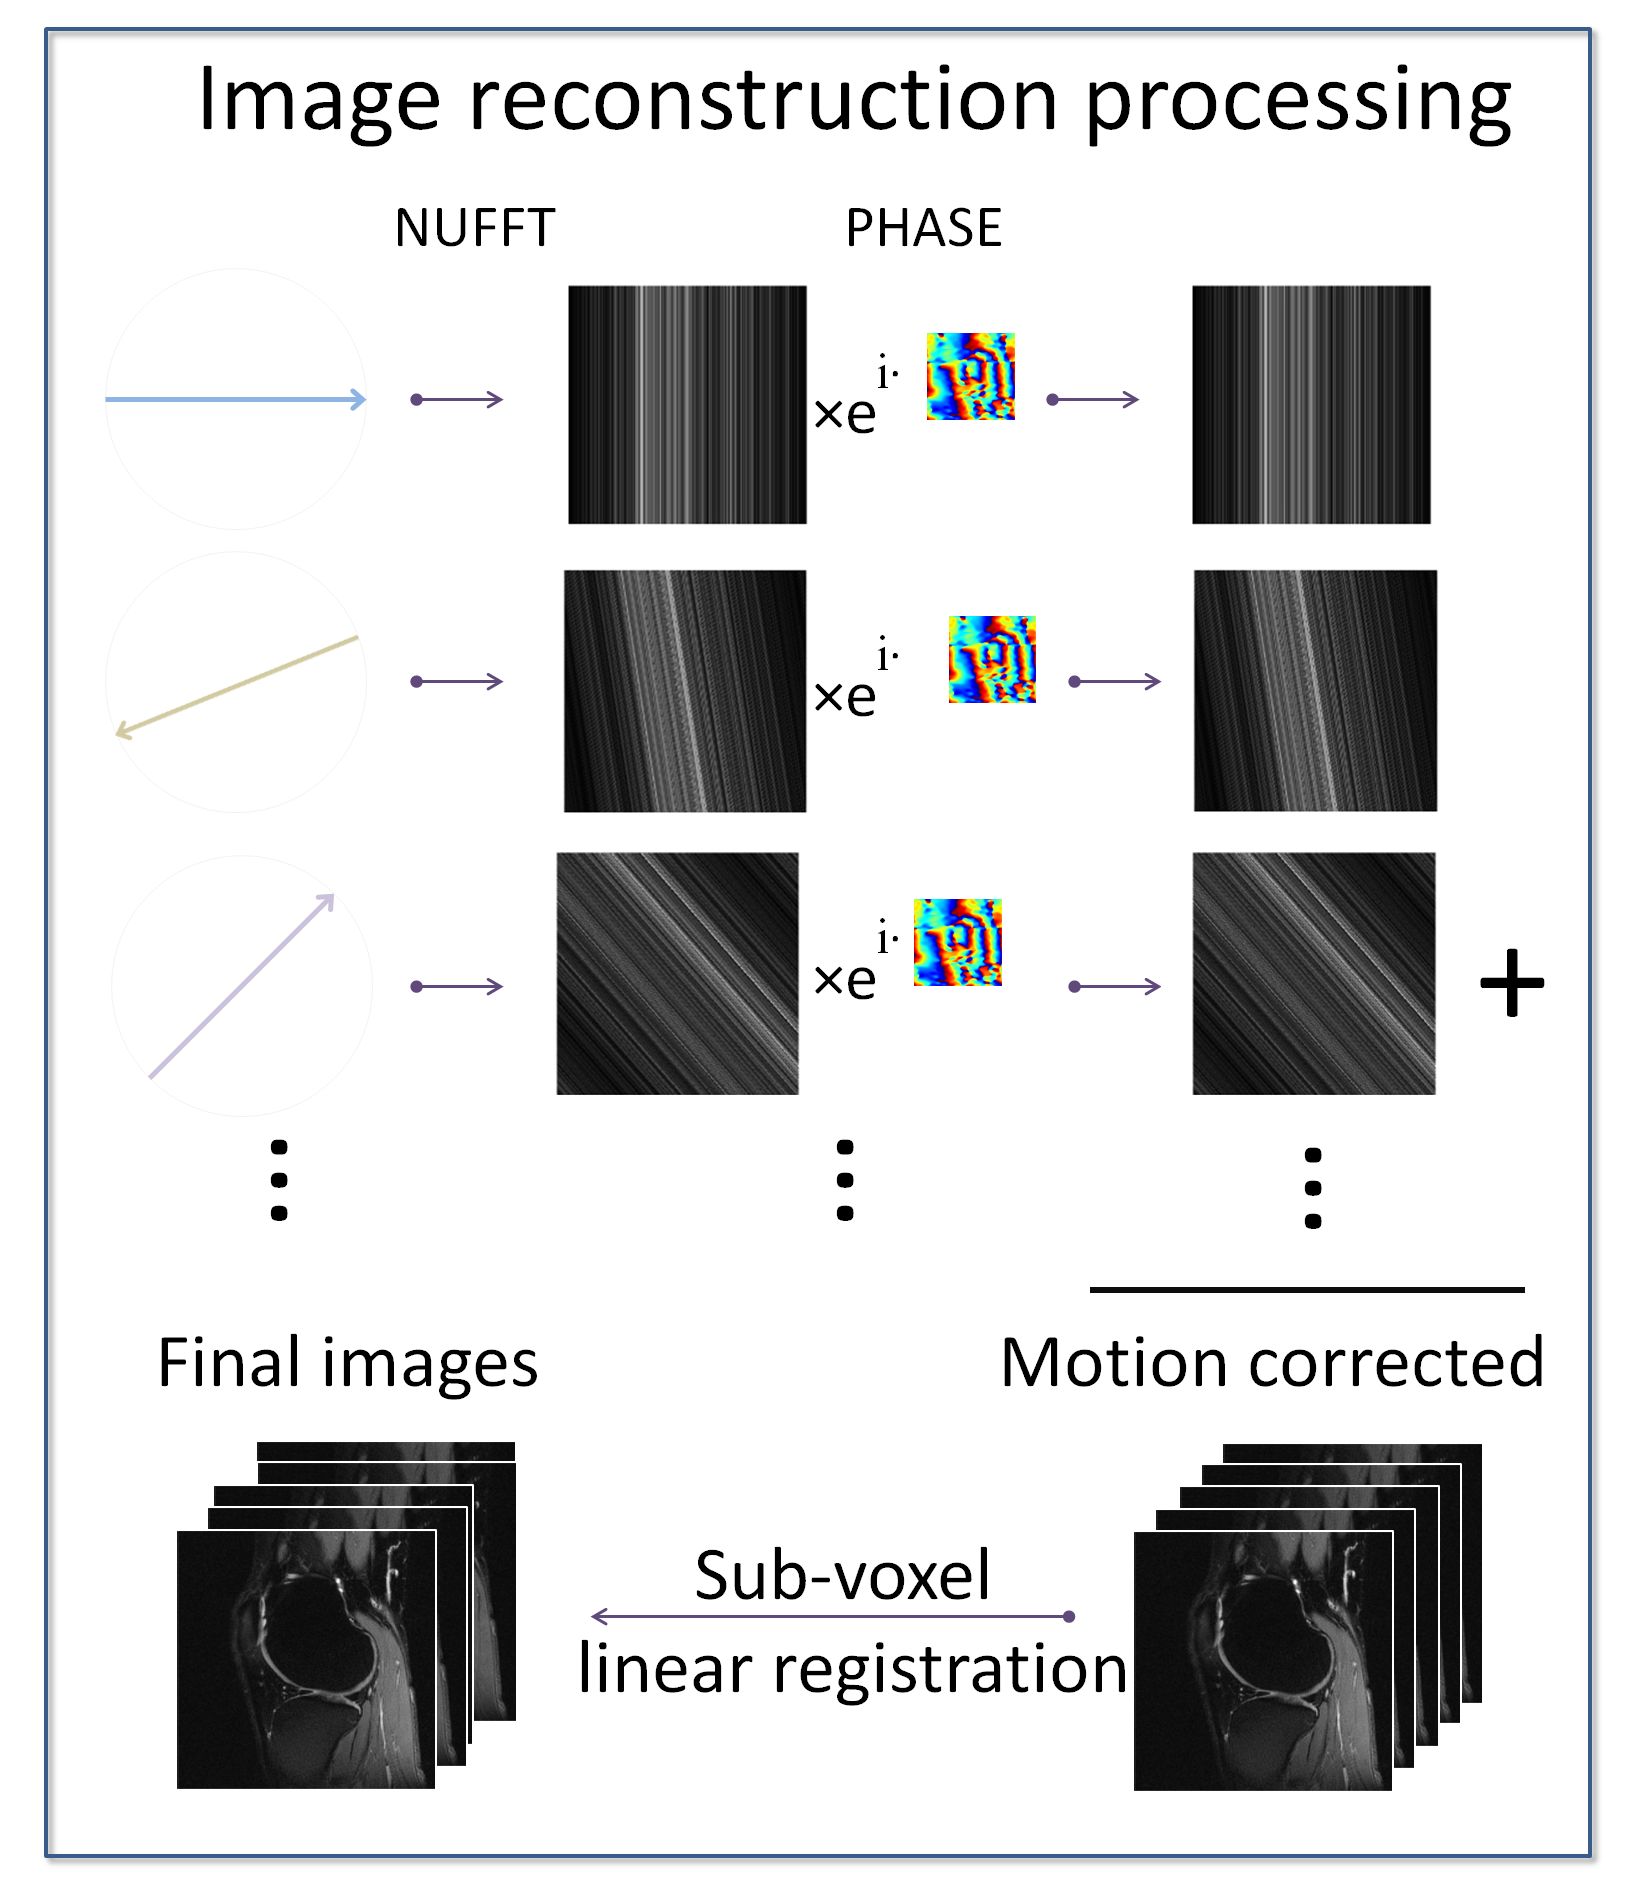
RAISED images were reconstructed using the method of Miller et al.9 (Figure 1). For each spoke we performed a 2D back projection of the k-space radial view and subtracted the phase measured with the 2D navigator. The final image was obtained as the sum of all motion-corrected back projections. Diffusion-weighted images were registered using a sub-voxel image registration.[10]
Image processing
Form the diffusion-weighted images we calculated the eigenvalues of the diffusion tensor. The eigenvalues were summarized as the axial (largest) diffusivity (λl), the radial diffusivity (λ┴), the mean diffusivity (MD) and the fractional anisotropy (FA).
Articular cartilage was segmented in the B0 images using in-house software.[11] Femoral cartilage was subdivided in the trochlea and the lateral and medial condyles . We calculated mean and standard deviation of diffusion parameters in five cartilage plates for our analysis: femoral trochlea (FT), lateral femoral condyle (LFC), medial femoral condyle (MFC), medial tibia (MT), lateral tibia (LT).
Statistical methods
For comparison between two groups (e.g. OA vs healthy) we used unpaired t-test after confirmation of the normal distribution of the data using the Kolmogorov-Smirnov test. One-way ANOVA was used for multiple group comparisons. Spearman’s correlation was used to study associations between KL score and diffusion parameters. An overall p-value of 0.05 was chosen to indicate significant differences.
RESULTS
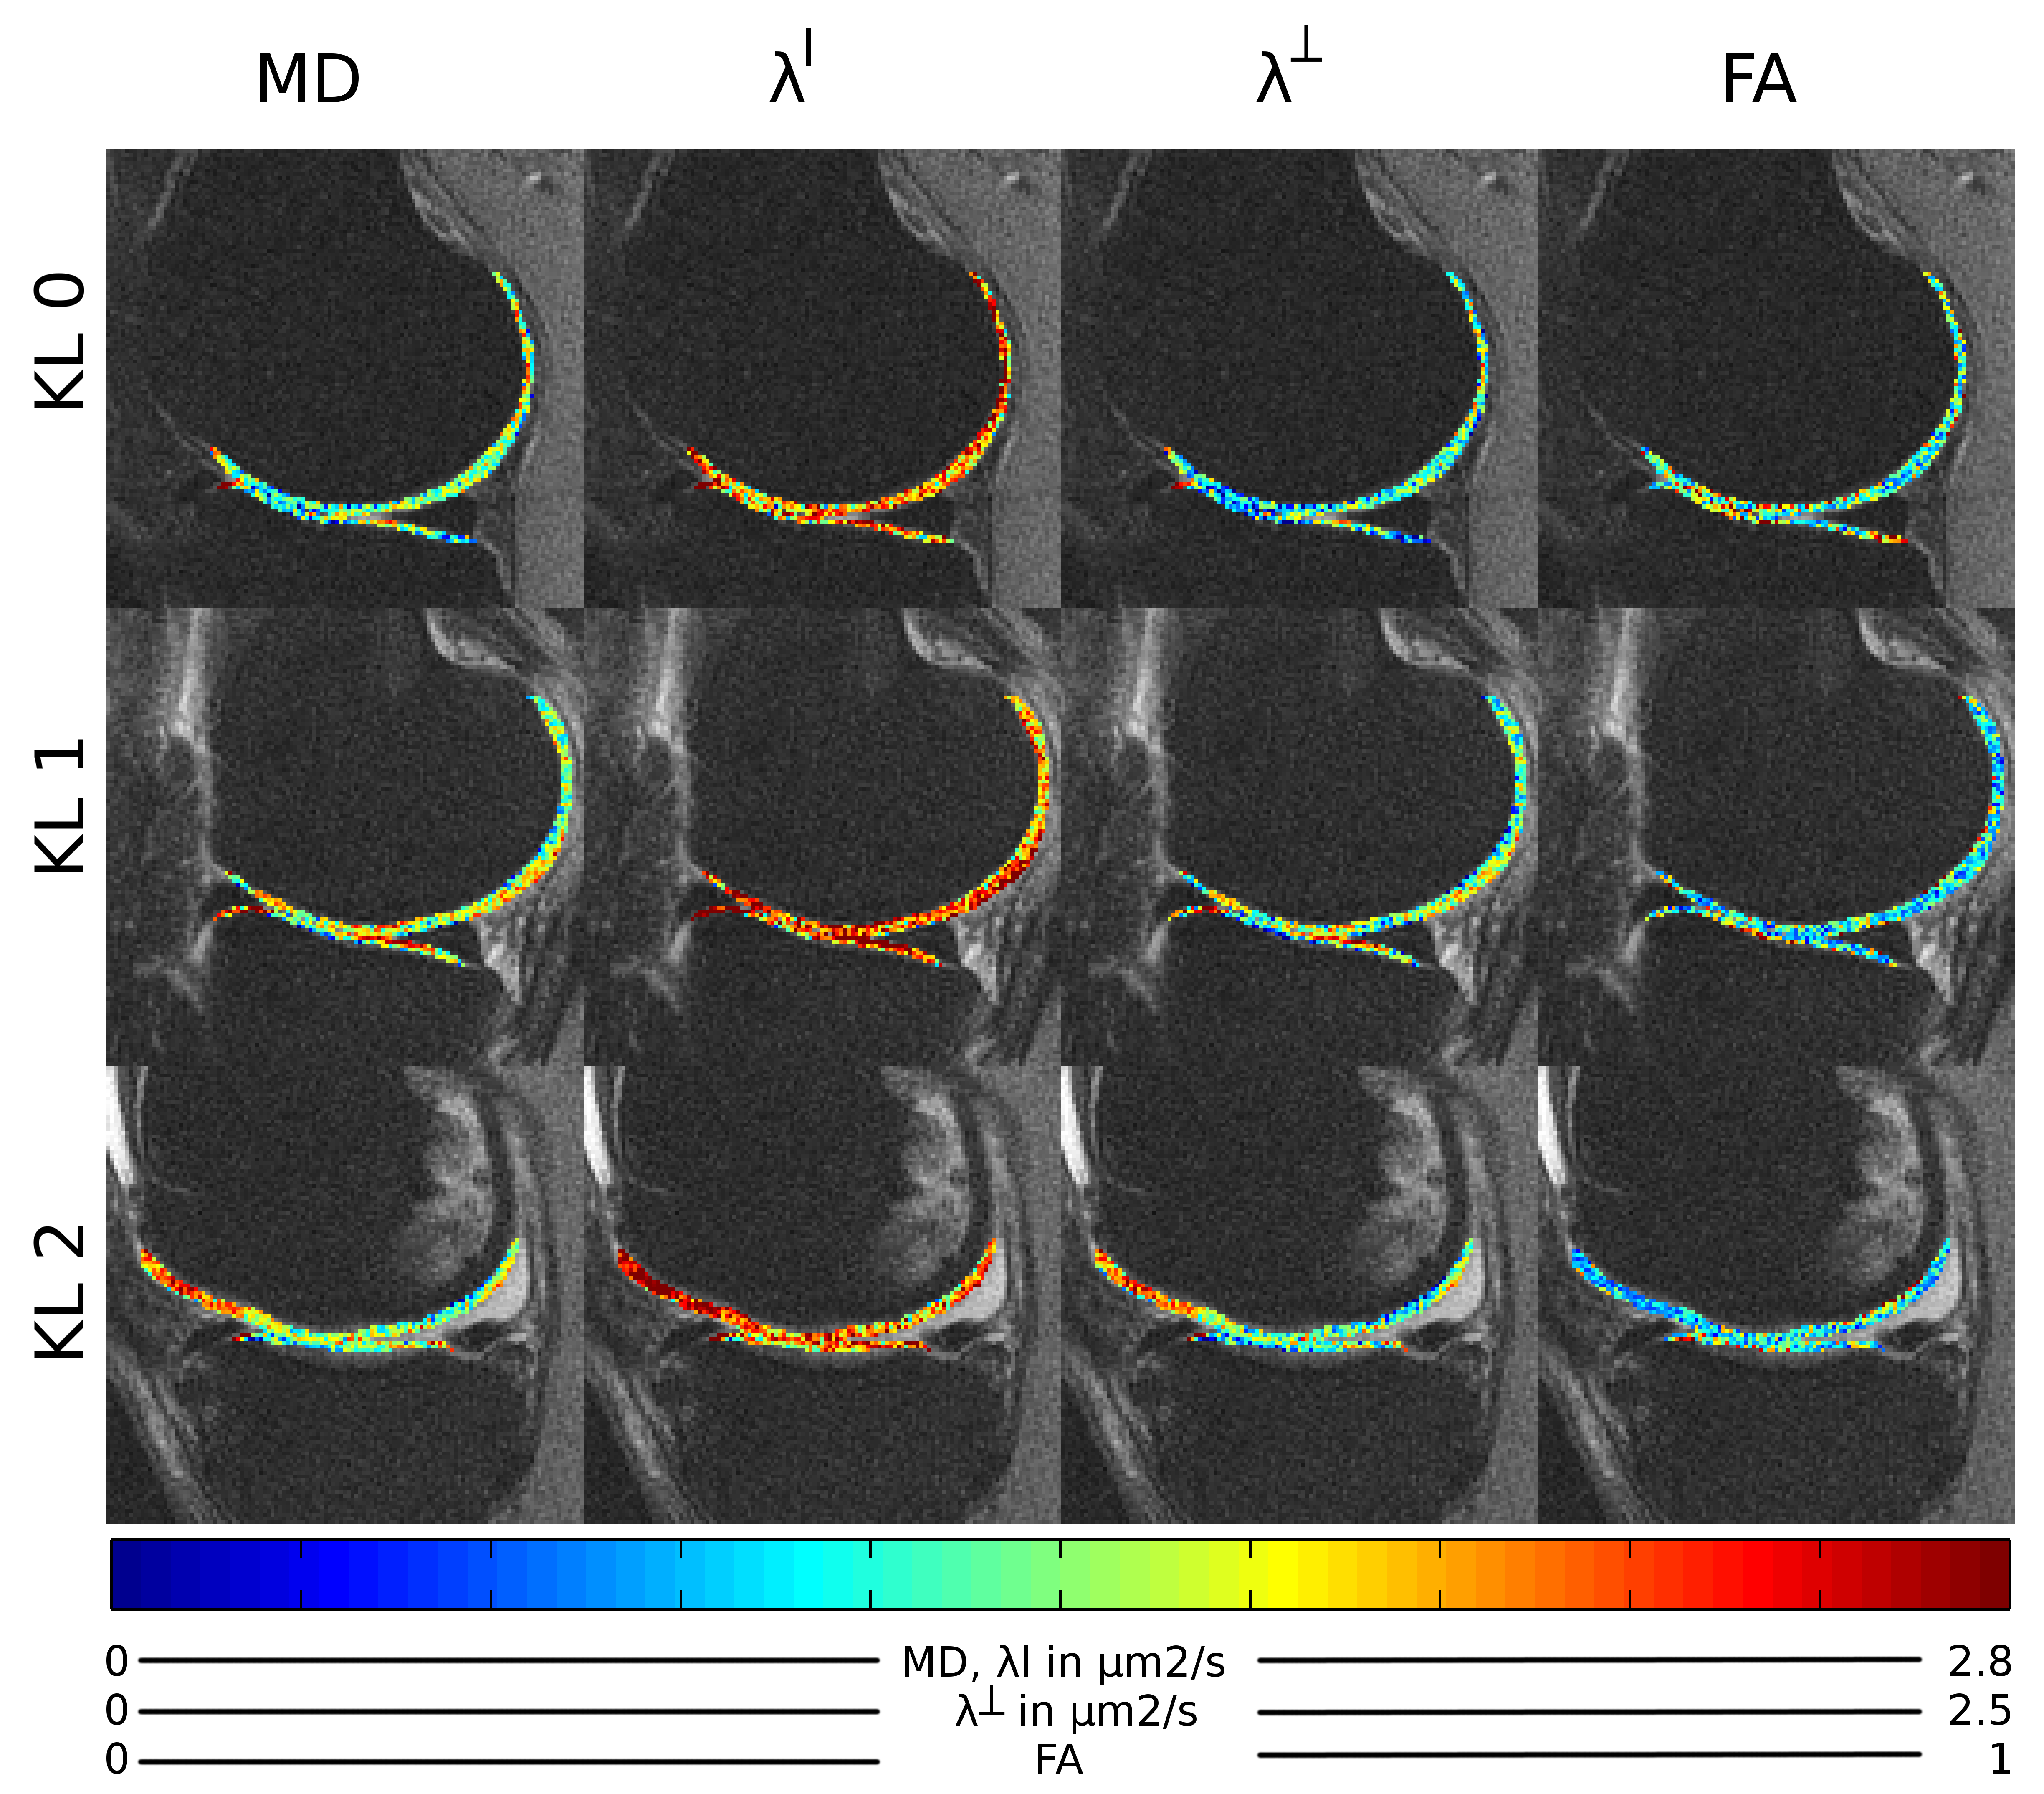
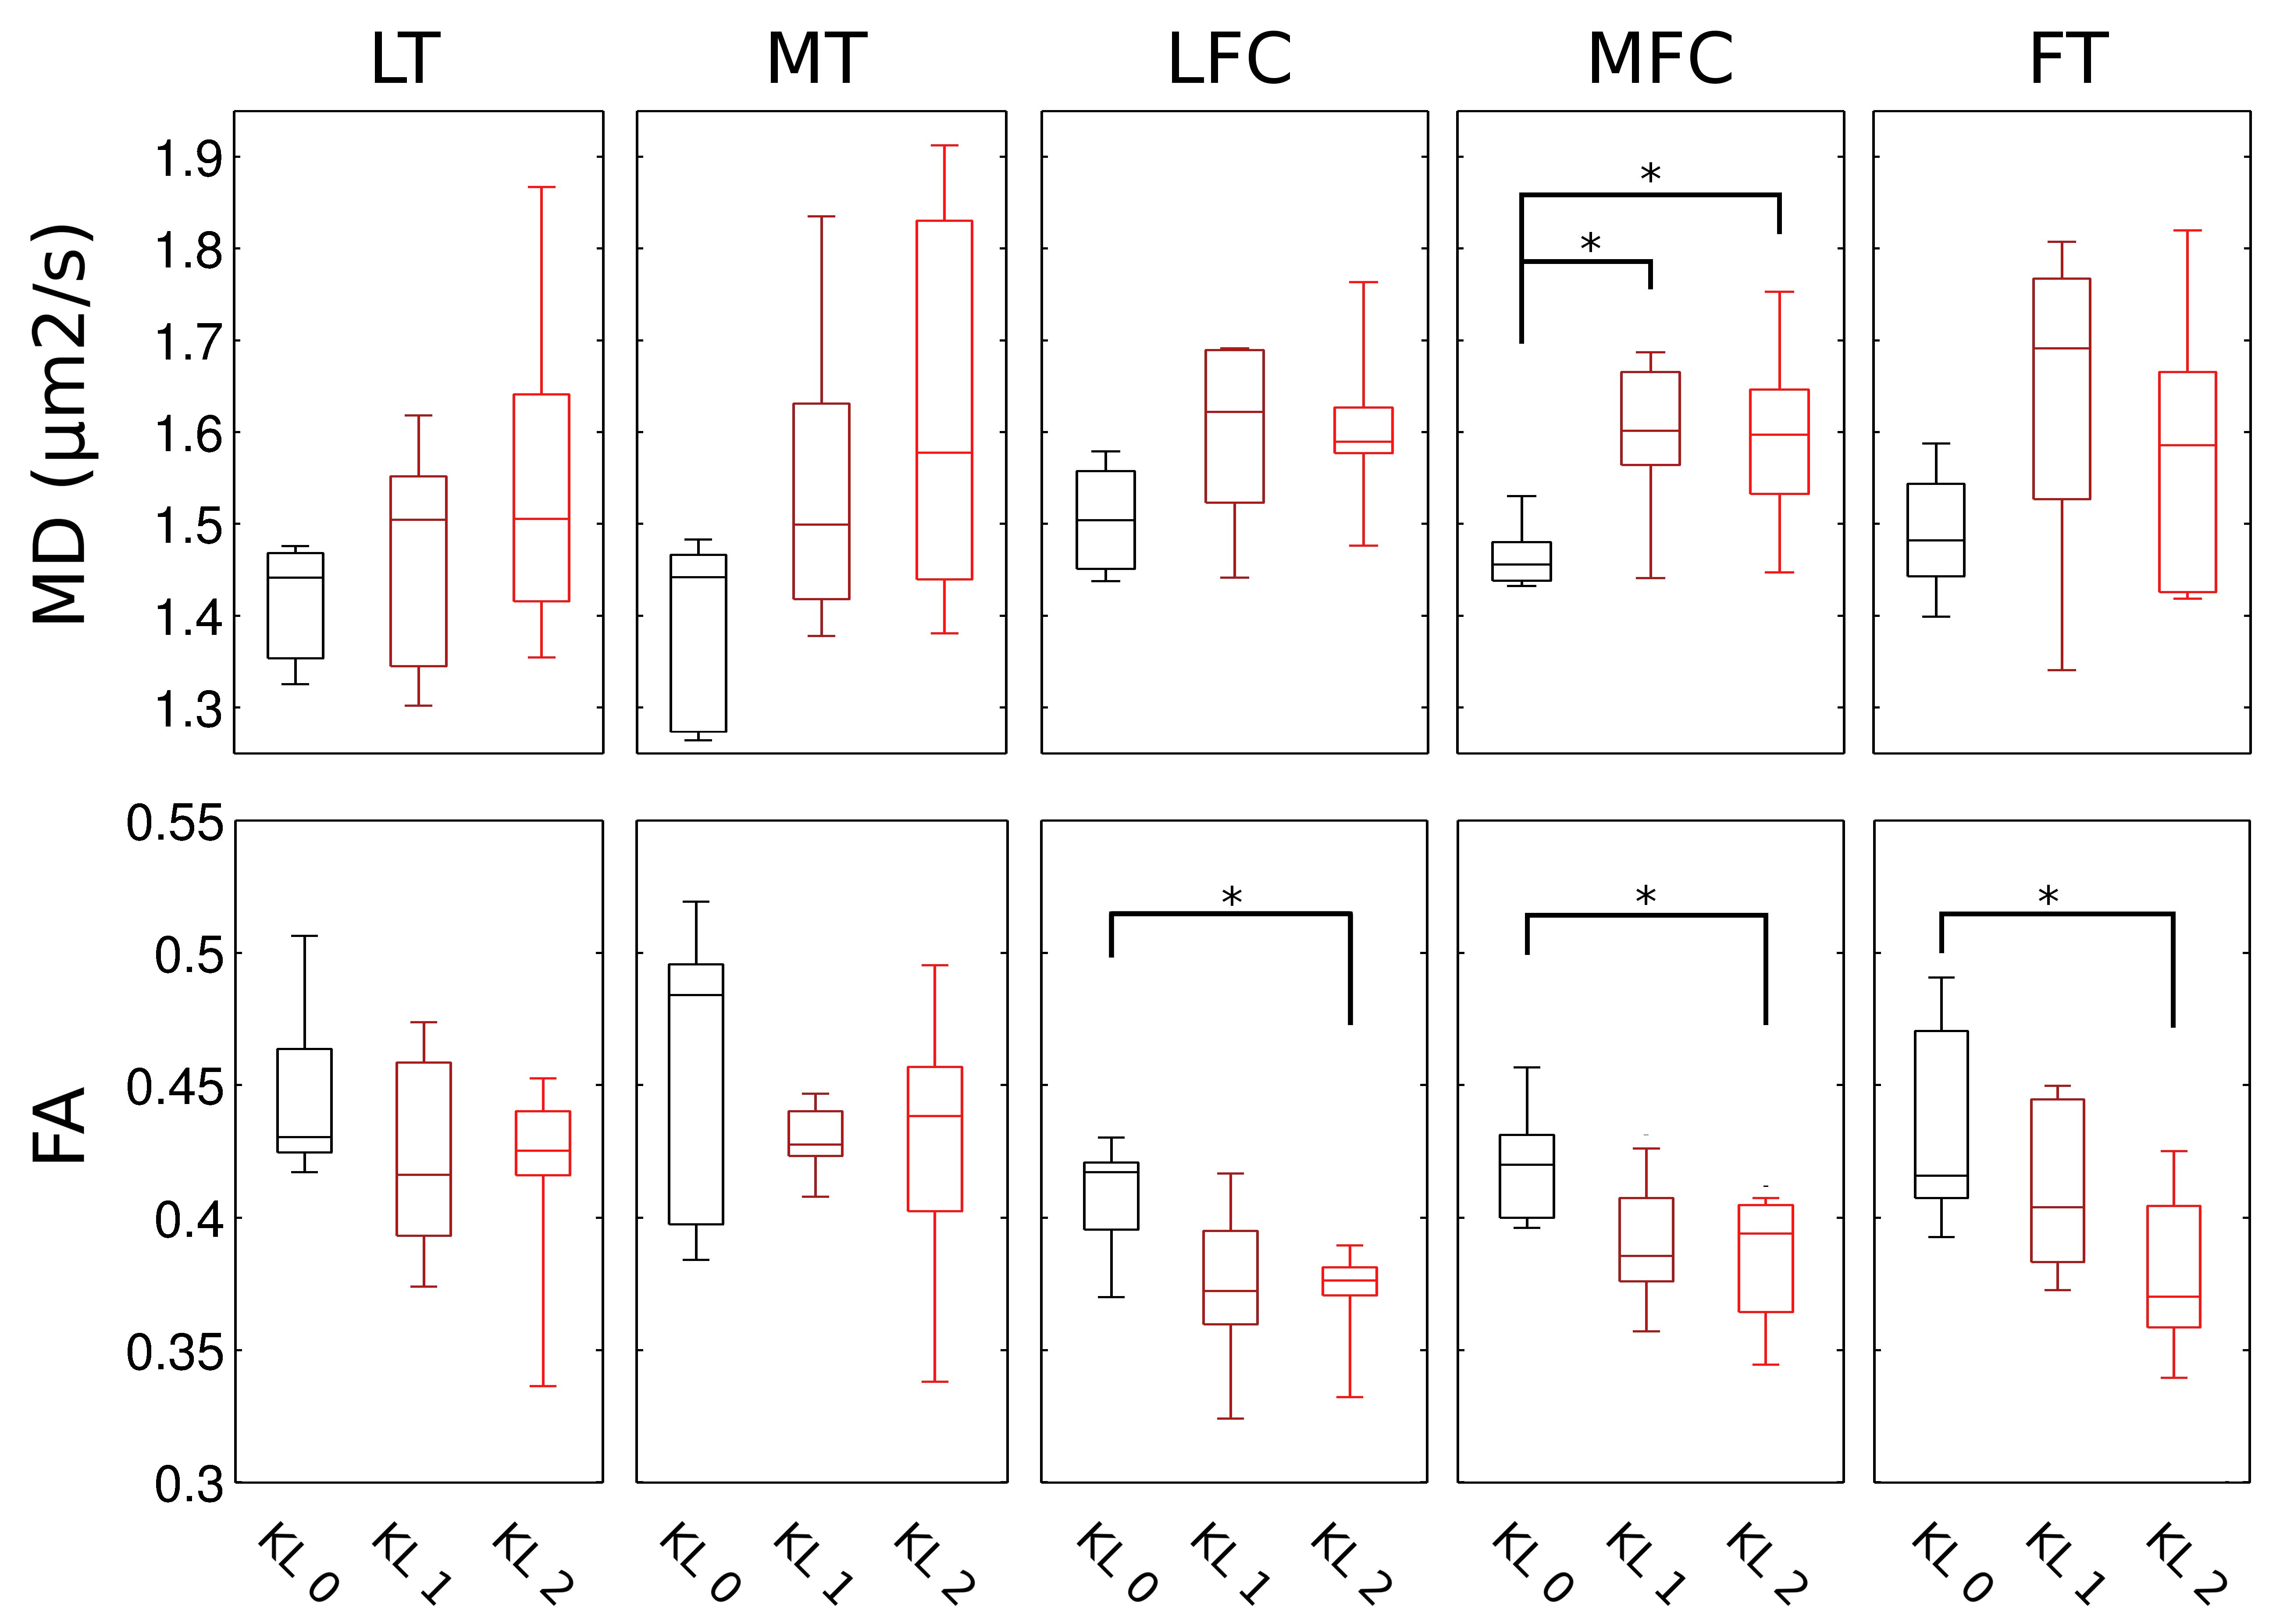
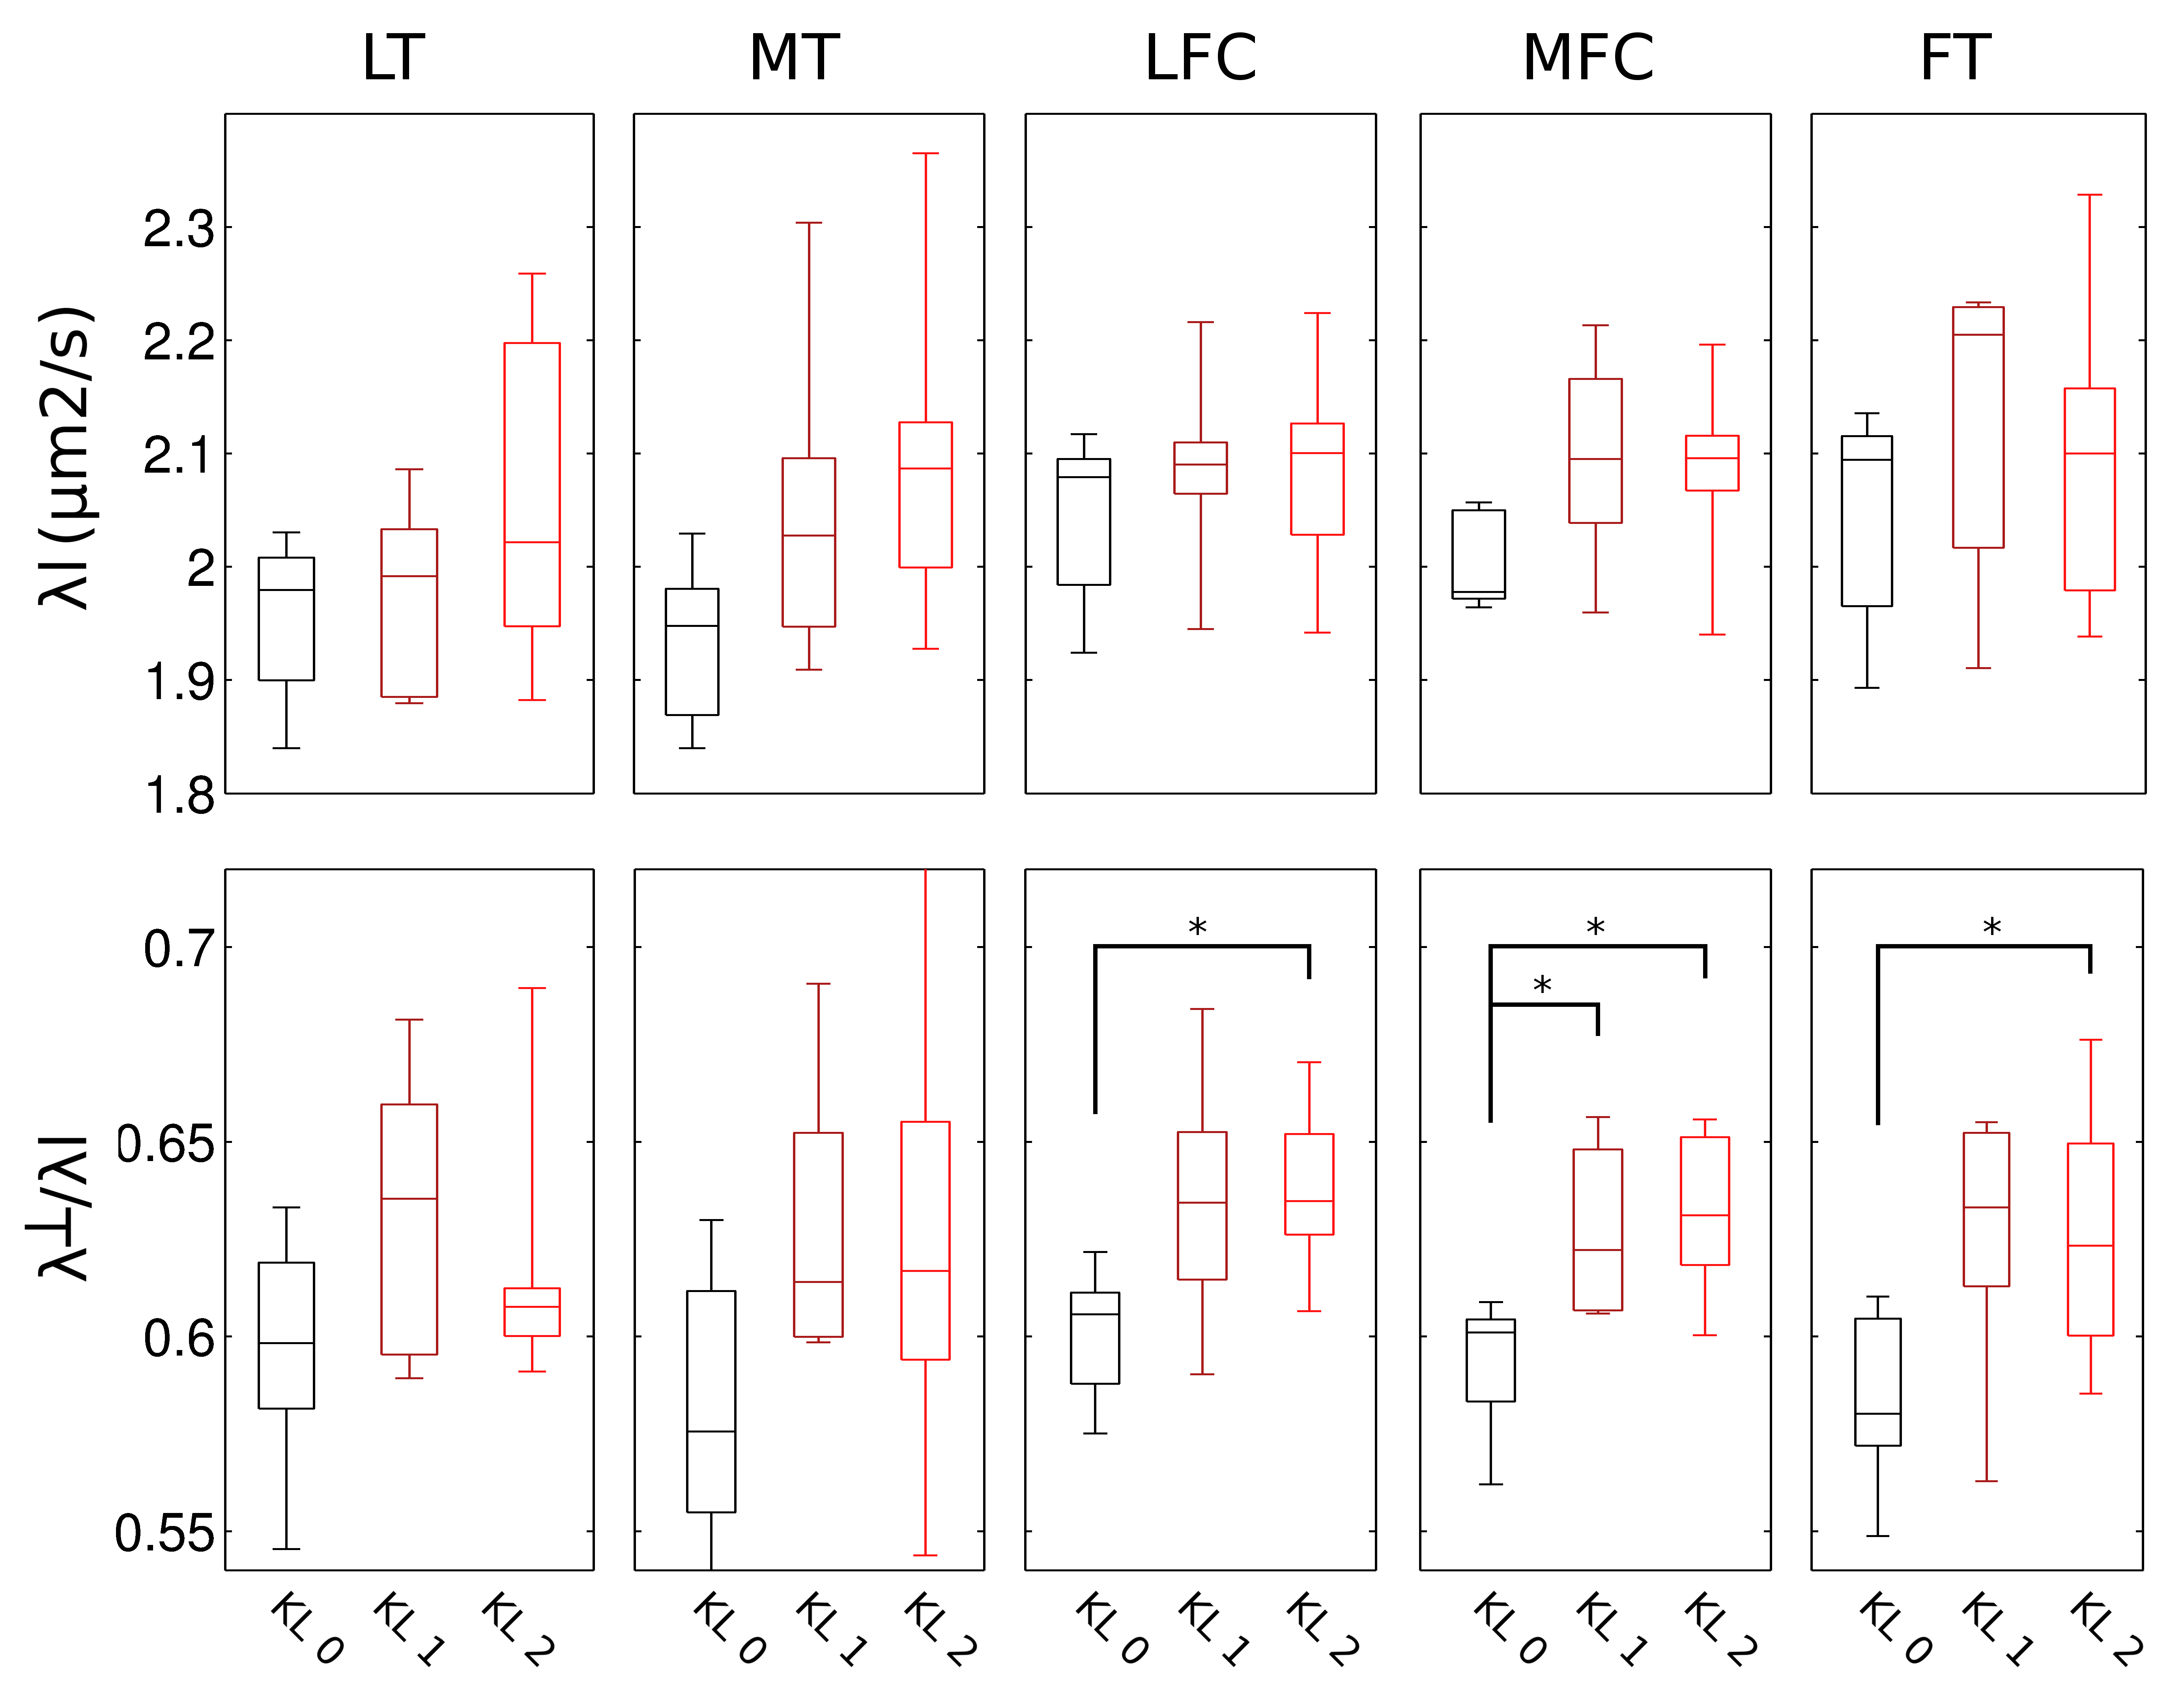
Figure 2 shows an example of MD, FA of healthy (KL 0), and OA (KL 1, KL 2) subjects. Without motion correction diffusion-weighted images presented attenuated signal on the images and thus in an overestimation of average MD (+25% range 2–48%) and FA (+13%, range -2–70%) compared to the motion-corrected images. The average MD and FA for all different cartilage plates and KL grades is summarized in Figure 3. KL 1 subjects showed significantly higher MD in the MFC (+9%), while KL 2 subjects had significantly higher MD in the MFC (+10%) and MT (+16%) and lower FA values in both femoral condyles and trochlea (-9%, -13% and -17% respectively). Changes in FA were caused by a larger increase in λ┴ compared to λl (Figure 4). There was a significant trend of increased λl with KL score, but neither ANOVA nor t-test showed significant group differences (KL0 vs KL1 or KL2). λ┴ showed a significant correlation with KL score in the MT (ρ=0.48), MFC (ρ=0.49), and LFC (ρ=0.59). λ┴ and λ┴/λl was significantly higher (+11%) in the MFC of KL1 subjects compared to KL0 and on the MFC and LFC for KL 2 subjects (+9% and +13% respectively).CONCLUSION
Our results show the importance of motion correction even in cases of very low b-values to provide accurate diffusion estimation. Our data shows a higher involvement of the medial compartment that can be detected in early stages of disease (KL 1) both in average MD and in increased λ┴/λl ratios. The increase of λ┴/λl is compatible with a remodeling of the pore size likely due rupture of collagen fibers. Changes in the collagen matrix seems to occur simultaneously with PG loss, so that any effective chondroprotective intervention need to address both collagen and PG.Acknowledgements
The research has been supported by the National Institute of Arthritis and Musculoskeletal and Skin Diseases (NIAMS) of the National Institute of Health (NIH); Grant numbers: R21AR066897, RO1AR067789References
1. Bayliss MT, Venn M, Maroudas A, Ali SY. Structure of proteoglycans from different layers of human articular cartilage. The Biochemical journal. 1983;February 1; 209(2): 387–400.
2. Grushko G, Schneiderman R, Maroudas A. Some biochemical and biophysical parameters for the study of the pathogenesis of osteoarthritis: a comparison between the processes of ageing and degeneration in human hip cartilage. Connective tissue research. 1989;19(2-4):149-176.
3. Venn M, Maroudas A. Chemical composition and swelling of normal and osteoarthrotic femoral head cartilage. I. Chemical composition. Annals of the rheumatic diseases. Apr 1977;36(2):121-129.
4. Maroudas A, Baylissb MT, Uchitel-Kaushanskya N, Schneidermana R, Gilav E. Aggrecan turnover in human articular cartilage: Use of aspartic acid racemization as a marker of molecular age. Archives of biochemistry and biophysics. 1998;350:61-71.
5. Lohmander LS, Ionescu M, Jugessur H, Poole AR. Changes in joint cartilage aggrecan after knee injury and in osteoarthritis. Arthritis and rheumatism. 1999;42(3):534-544.
6. Raya JG, Horng A, Dietrich O, Krasnokutsky S, Beltran LS, Storey P, Reiser MF, Recht MP, D.K. S, Glaser C. Articular cartilage: in vivo diffusion-tensor imaging. Radiology. 2012;262(2):550-559.
7. Raya JG, Melkus G, Adam-Neumair S, Dietrich O, Mützel E, Reiser MF, Putz R, Kirsch T, Jakob PM, Glaser C. Diffusion-tensor imaging of human articular cartilage specimens with early signs of cartilage damage. Radiology. 2013;266(3):831-841.
8. Kellgren JK, Lawrence JS. Radiological assessment of osteoarthritis. Annals of the rheumatic diseases. 1957;16(4):494-501.
9. Miller KL, Pauly JM. Nonlinear phase correction for navigated diffusion imaging. Magnetic resonance in medicine. 2003;50(2):343-353.
10. Guizar-Sicairos M, Thurman ST, Fienup JR. Efficient subpixel image registration algorithms. Optics letters. Jan 15 2008;33(2):156-158.
11. König L, Groher M, Keil A. Semi-automatic Segmentation of the Patellar Cartilage in MRI. Bildverarbeitung für die Medizin. 2007;17:404-408.
Figures