5086
Revisiting the experimental base of compositional biomarkers: A meta-analysis study1Department of Radiology, New York University School of Medicine, New York, NY, United States
Synopsis
We aim to perform a meta-analysis of the corpus of experimental results accumulated for compositional MRI biomarkers of articular cartilage used in clinical studies. We summarized the data according to the statistical evidence that is reported. We report the correlation of MRI parameters with composition, the ability of MRI parameters to detect group differences between healthy and degraded cartilage, and the ability of MRI to detect cartilage damage.
INTRODUCTION
Changes in articular cartilage, a hallmark of early osteoarthritis, include increased hydration, proteoglycan (PG) loss, and remodeling of the collagen network.[1-3] MRI has shown high promise to assess the biochemical composition of articular cartilage: water, PG and collagen. Almost all cartilage compositional imaging biomarkers used today in clinical studies were proposed within few years in the early 90’s: T1,[4] sodium MR,[5] magnetization transfer (MT),[6] T2,[7] diffusion MRI,[8] gadolinium enhanced MRI of articular cartilage (dGEMRIC),[9] and T1ρ.[10] Since then many studies have validated these imaging biomarkers in well-controlled ex vivo experiments.
We aim to perform a meta-analysis of the corpus of experimental results accumulated for those MRI biomarkers used in clinical studies. We summarized the data according to the statistical evidence that is reported. We report the correlation of MRI parameters with composition, the ability of MRI parameters to detect group differences between healthy and degraded cartilage, and the ability of MRI to detect cartilage damage.
METHODS
Data compilation
We considered only studies that used a non-MRI based standard of reference to assess either composition or damage. We performed the search in Pubmed that resulted in 57 relevant publications. We complemented the results of the research with references known to the authors to identify a total of 67 manuscripts.
To synthesize the information presented in all 67 studies we applied the following criteria. We report only values averaged over the full cartilage thickness, which was the most commonly reported value. We only report the data from the group with the most severe damage to show the range of parameter variation.
Statistical methods
Correlations between MRI methods and composition were reported as the range of correlations with the mean calculated using the Fisher’s z-scale. To summarize differences between groups we used the Cohen's d as a measure of effect size.[11] Since only few studies have analyzed the performance of MRI biomarkers for the diagnosis, we only use descriptive statistics to summarize the results.
RESULTS
Group differences
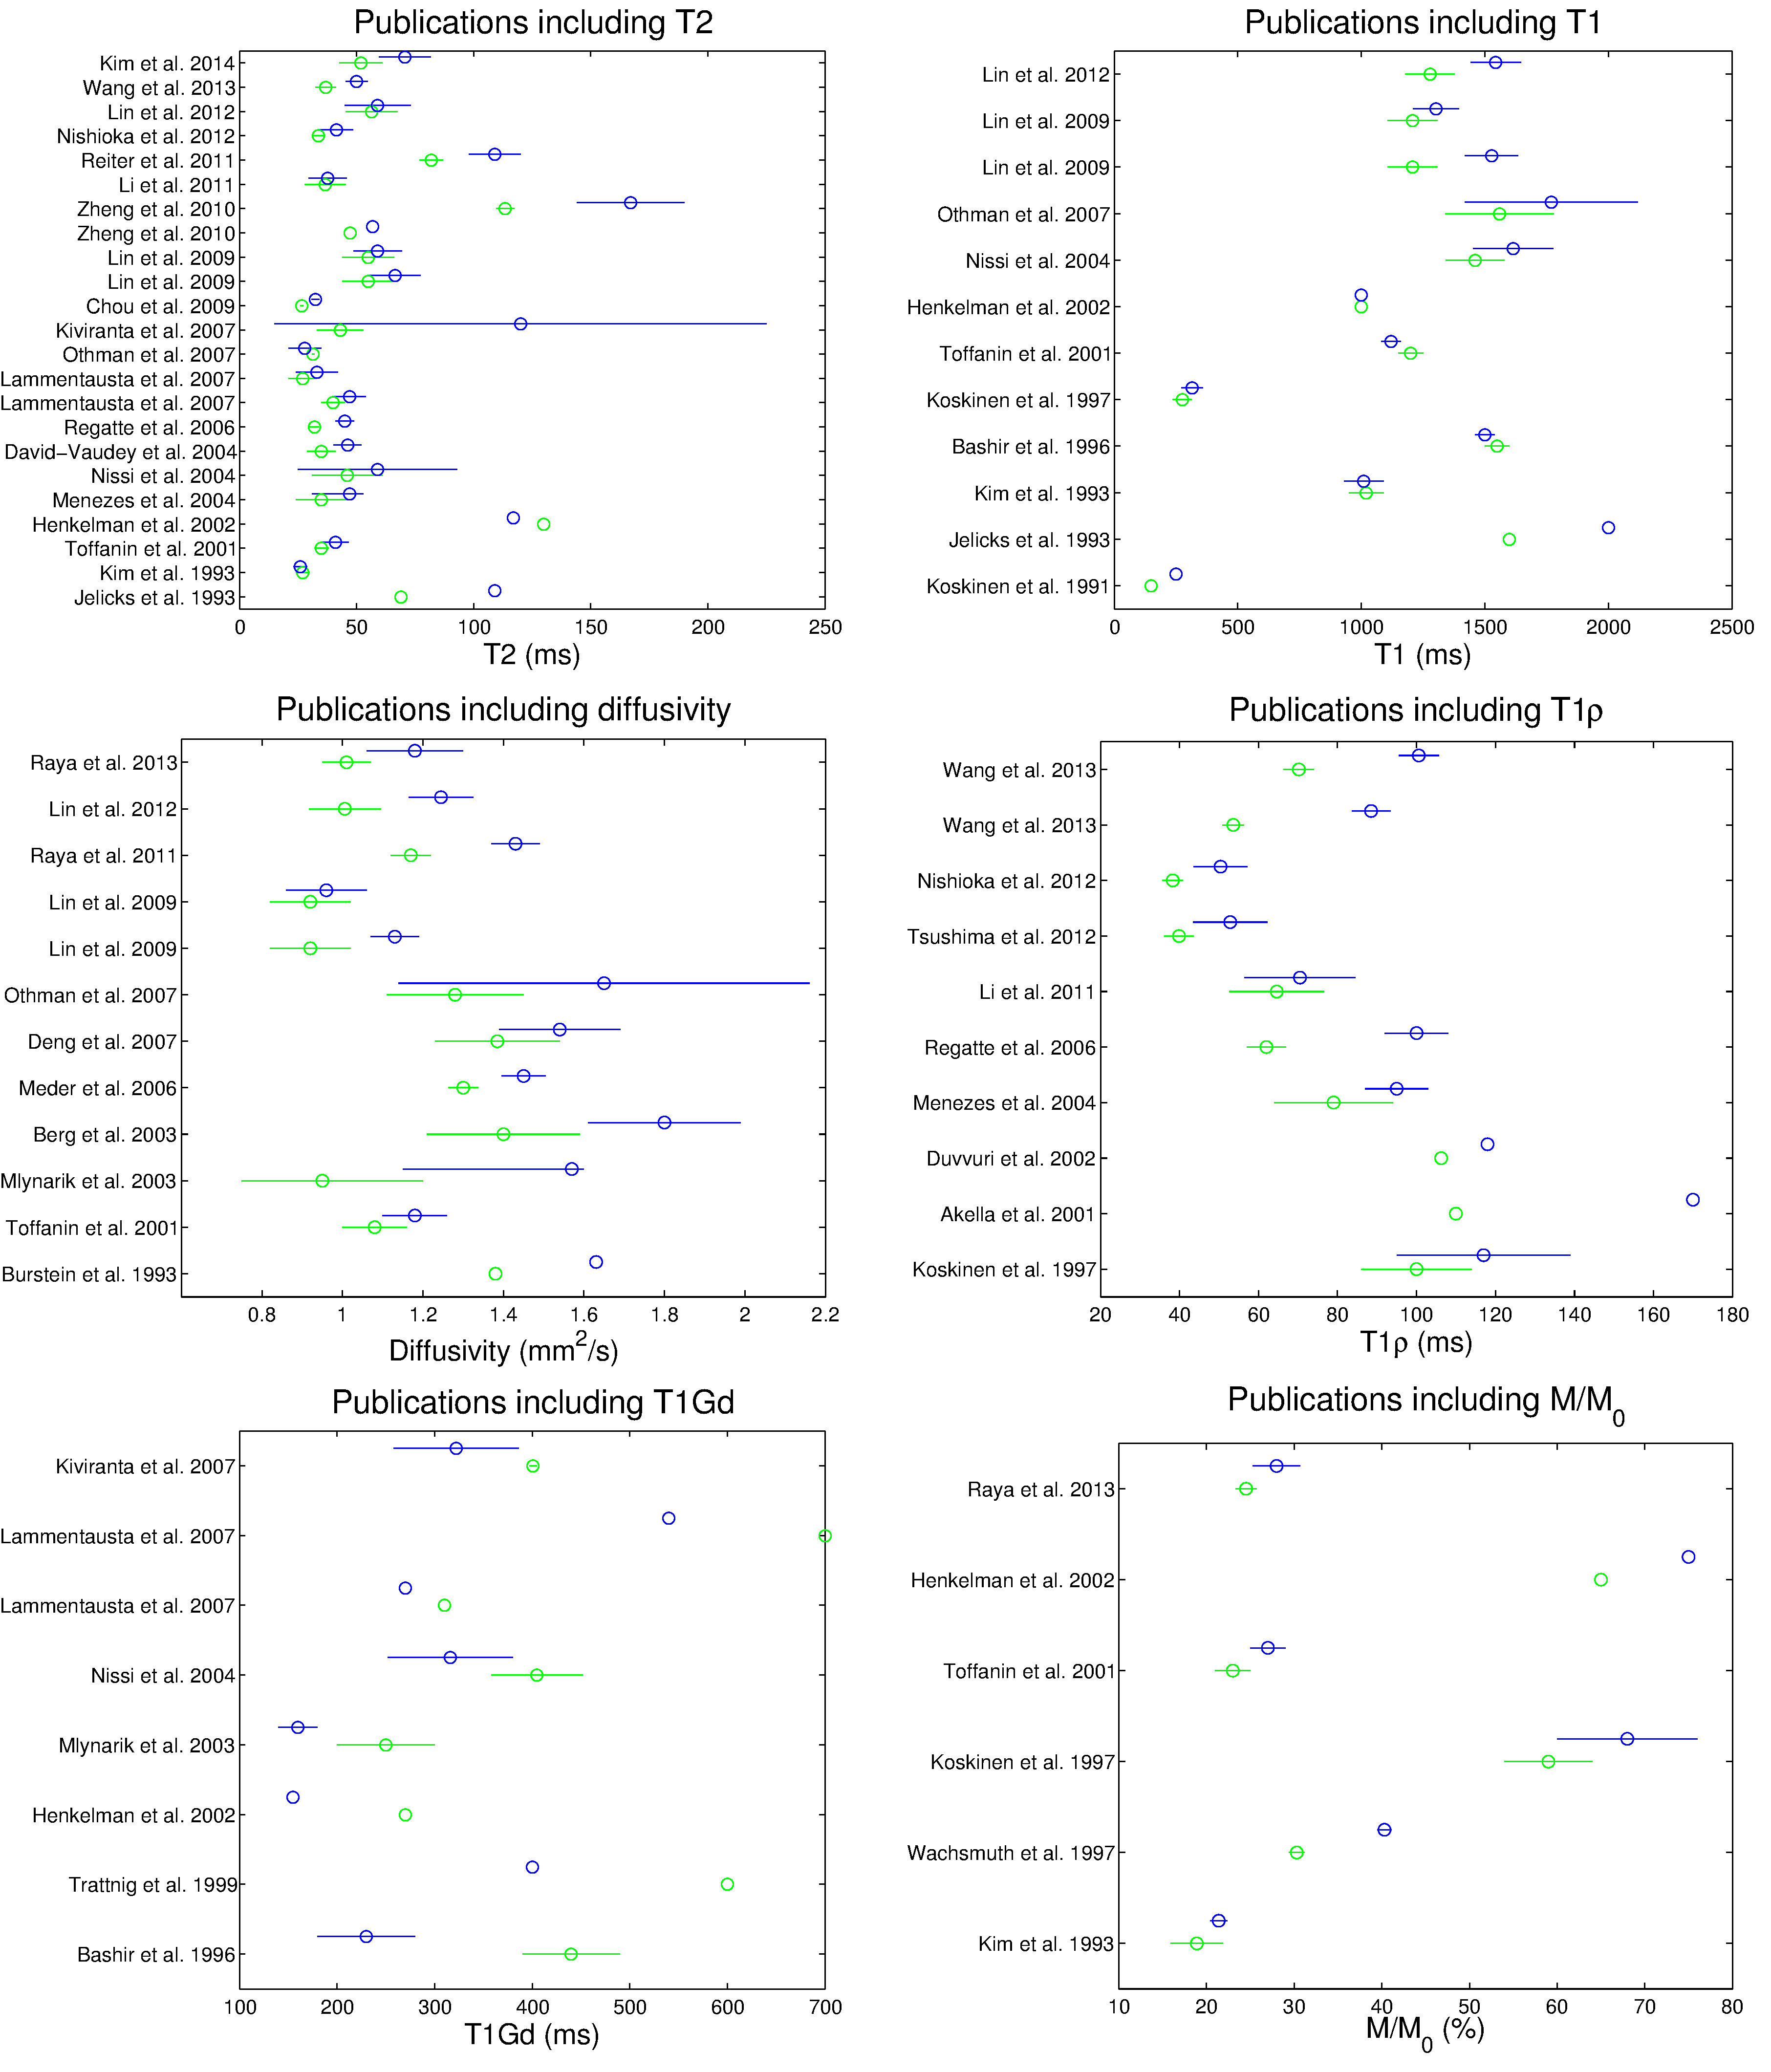
Differences in MRI parameters between healthy and degraded samples are summarized in Figure 1. The most studies validated T2[4,7,12-41] and T1,[4,7,9,10,12,14,16-18,20,25,28-31,38,42-47] followed by diffusion,[8,14,18,27-30,38,48-53], dGEMRIC,[9,17,19,20,24,26,28-30,43,45,47,51,54,55] T1ρ,[10,16,19,23,34,35,37,45,47,56-60] magnetization transfer,[10,12,17,29,30,38,44,46,61,62] and Na-imaging and spectroscopy.[5,7,8,42,61,63,64] The largest Cohen’s d was for Na concentration, [Na], (d=-2.45). Diffusivity measurements have the next largest Cohen’s d=1.14 (n=12 studies), followed by km (-1.10). T1ρ, T1Gd, and FA showed moderate significance to detect changes (d=-0.86, 0.77, and 0.75 respectively). The large standard deviation of T2 and T1 indicate the rather modest ability of T2 and T1 to detect changes (d=0.39), likely explaining the low performance of clinical MRI sequences for the detection of early cartilage degeneration.
Correlation
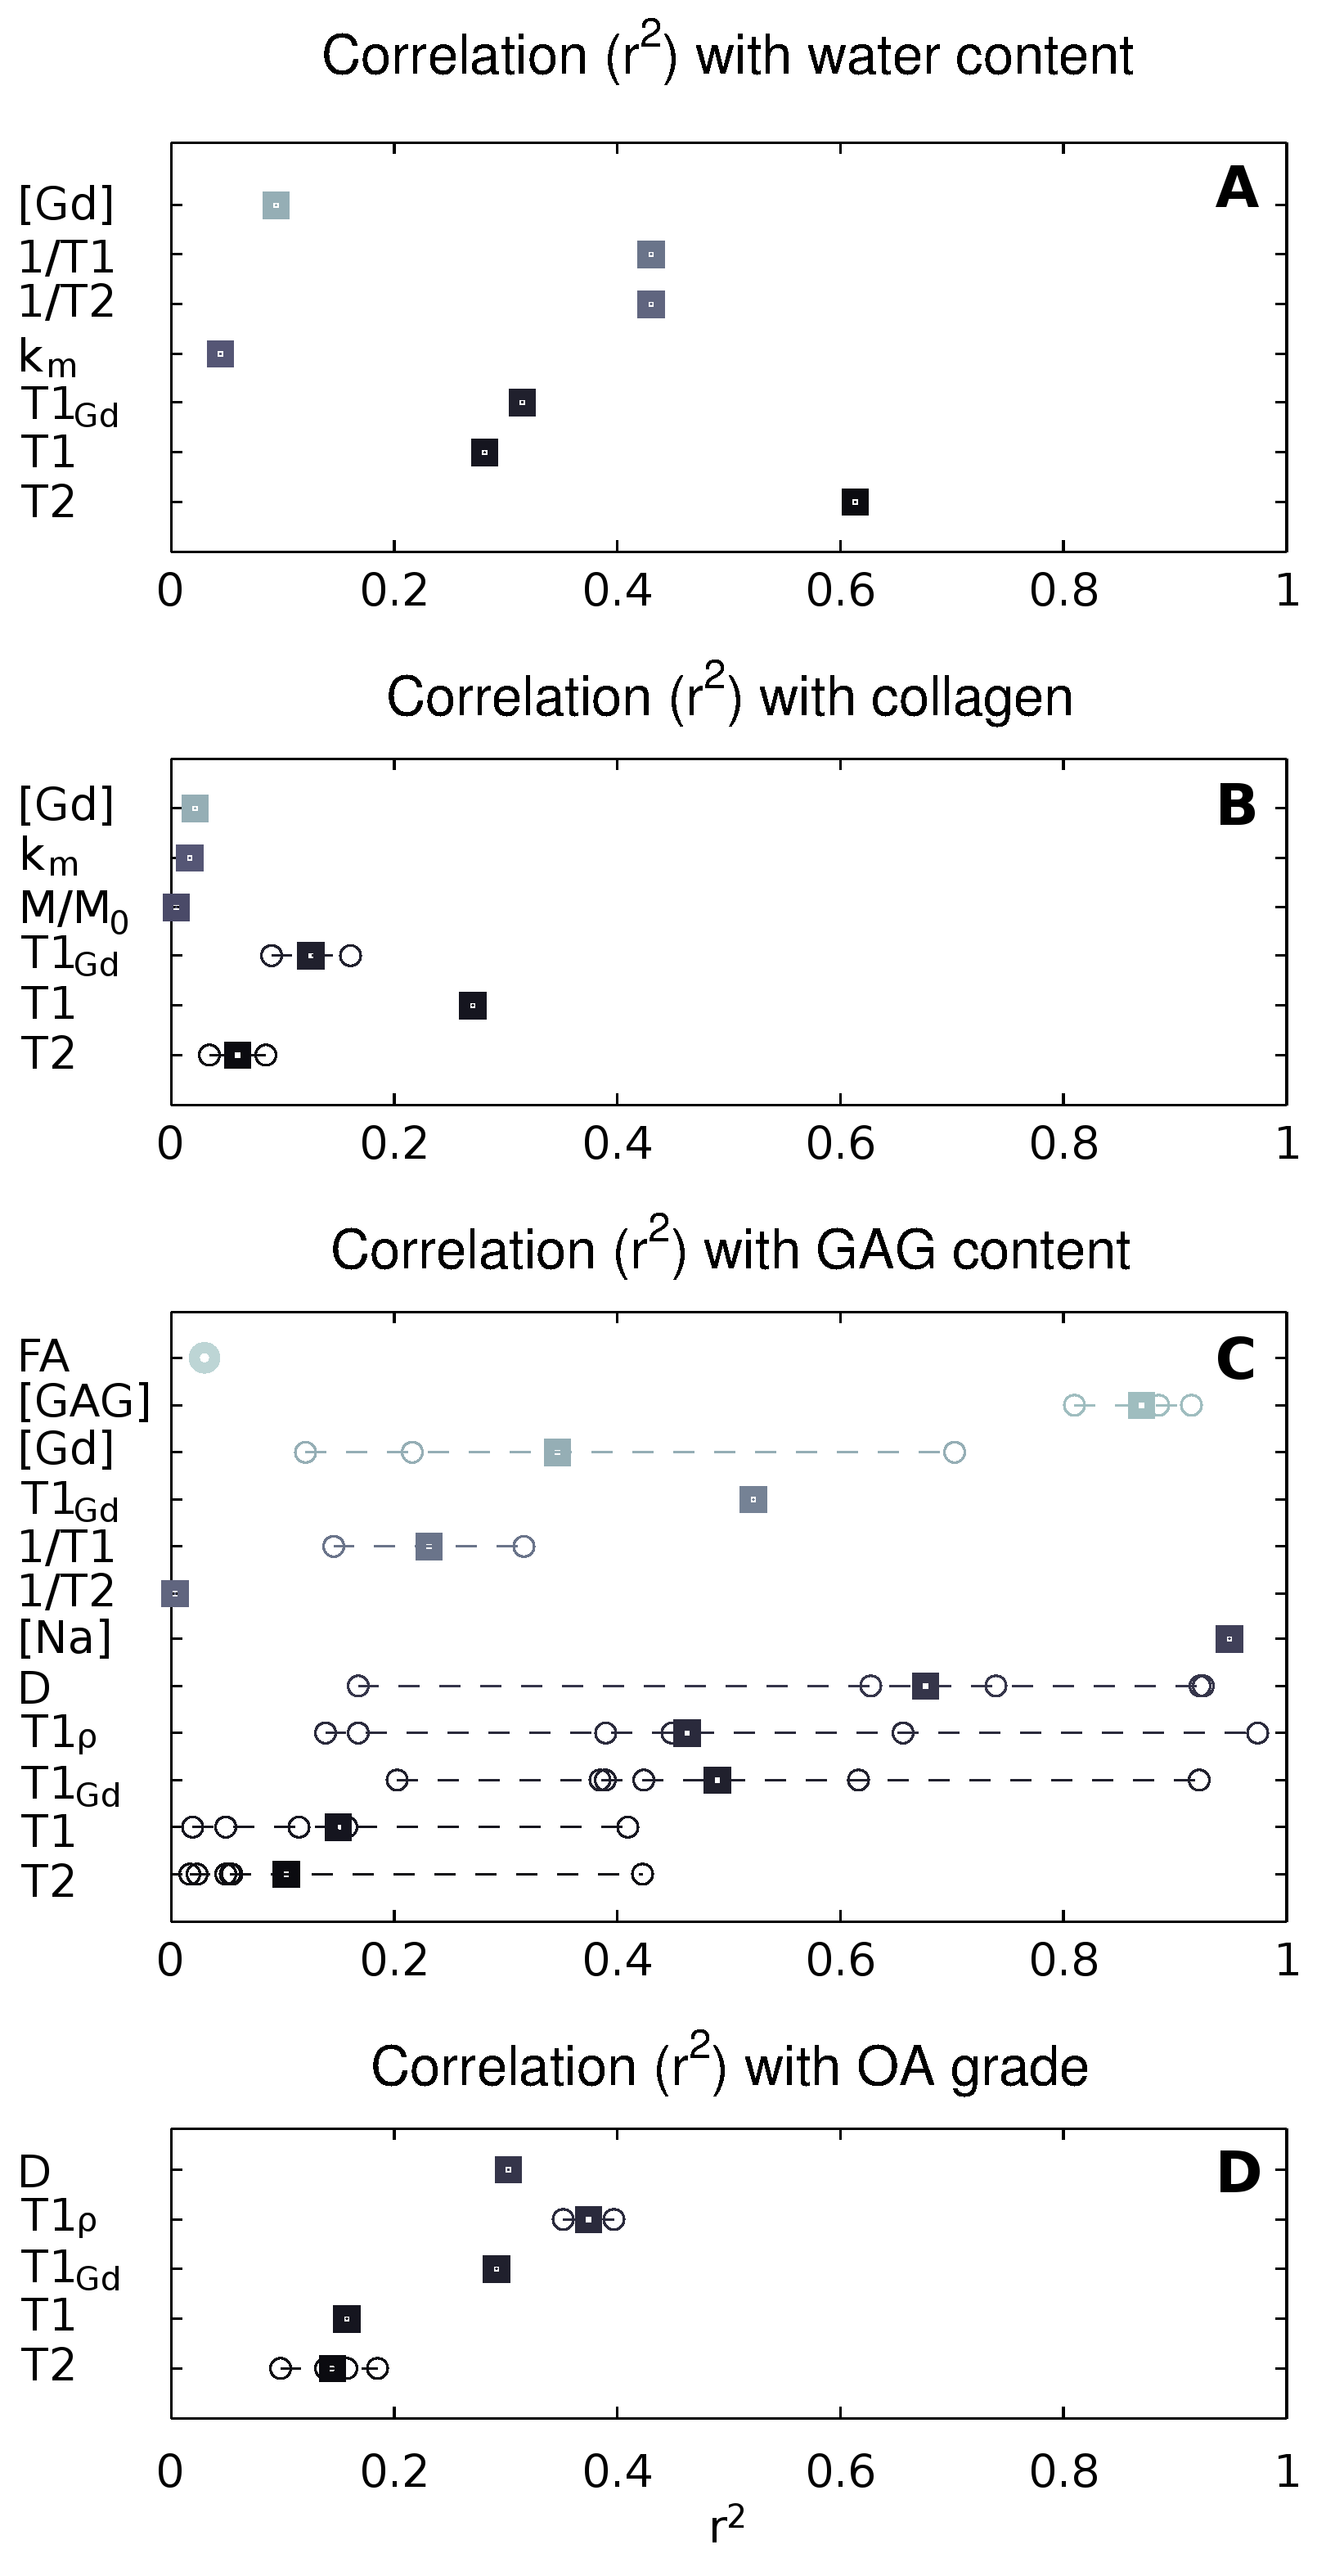
MRI parameters have been correlated against the histological score,[4,21,26,34,35,37,40,53,57] the GAG content,[8,9,16,18,20,24,26,31,34,35,37,38,42,43,45,46,48,49,52,54-57,62,63] the collagen content,[20,24,26,35,37,46] and the water content (WC)[20,26,31,37,38]. The MRI parameters (T2, T1, diffusion, T1ρ, and T1Gd) show a moderate correlation with the histological grade, with correlation coefficients between 0.5 and 0.7 (Fig. 2). However, many studies reported non-significant correlations with histological grading for T2 (4 out of 8 studies), and T1ρ (3 out of 5 studies). Similarly, correlations with water content are weak for all parameters but T1Gd and diffusivity. Poor correlation was found between MRI and collagen content, indicating the suboptimal assessment of the collagen component of cartilage. However, we identified only a few studies that measure collagen composition. Several parameters showed a strong correlation with the GAG content. The highest correlations were for [Na] (r=0.98) followed by diffusion (r=-0.88), T1ρ (r=-0.79) and T1Gd (r=0.70).
Diagnostic accuracy
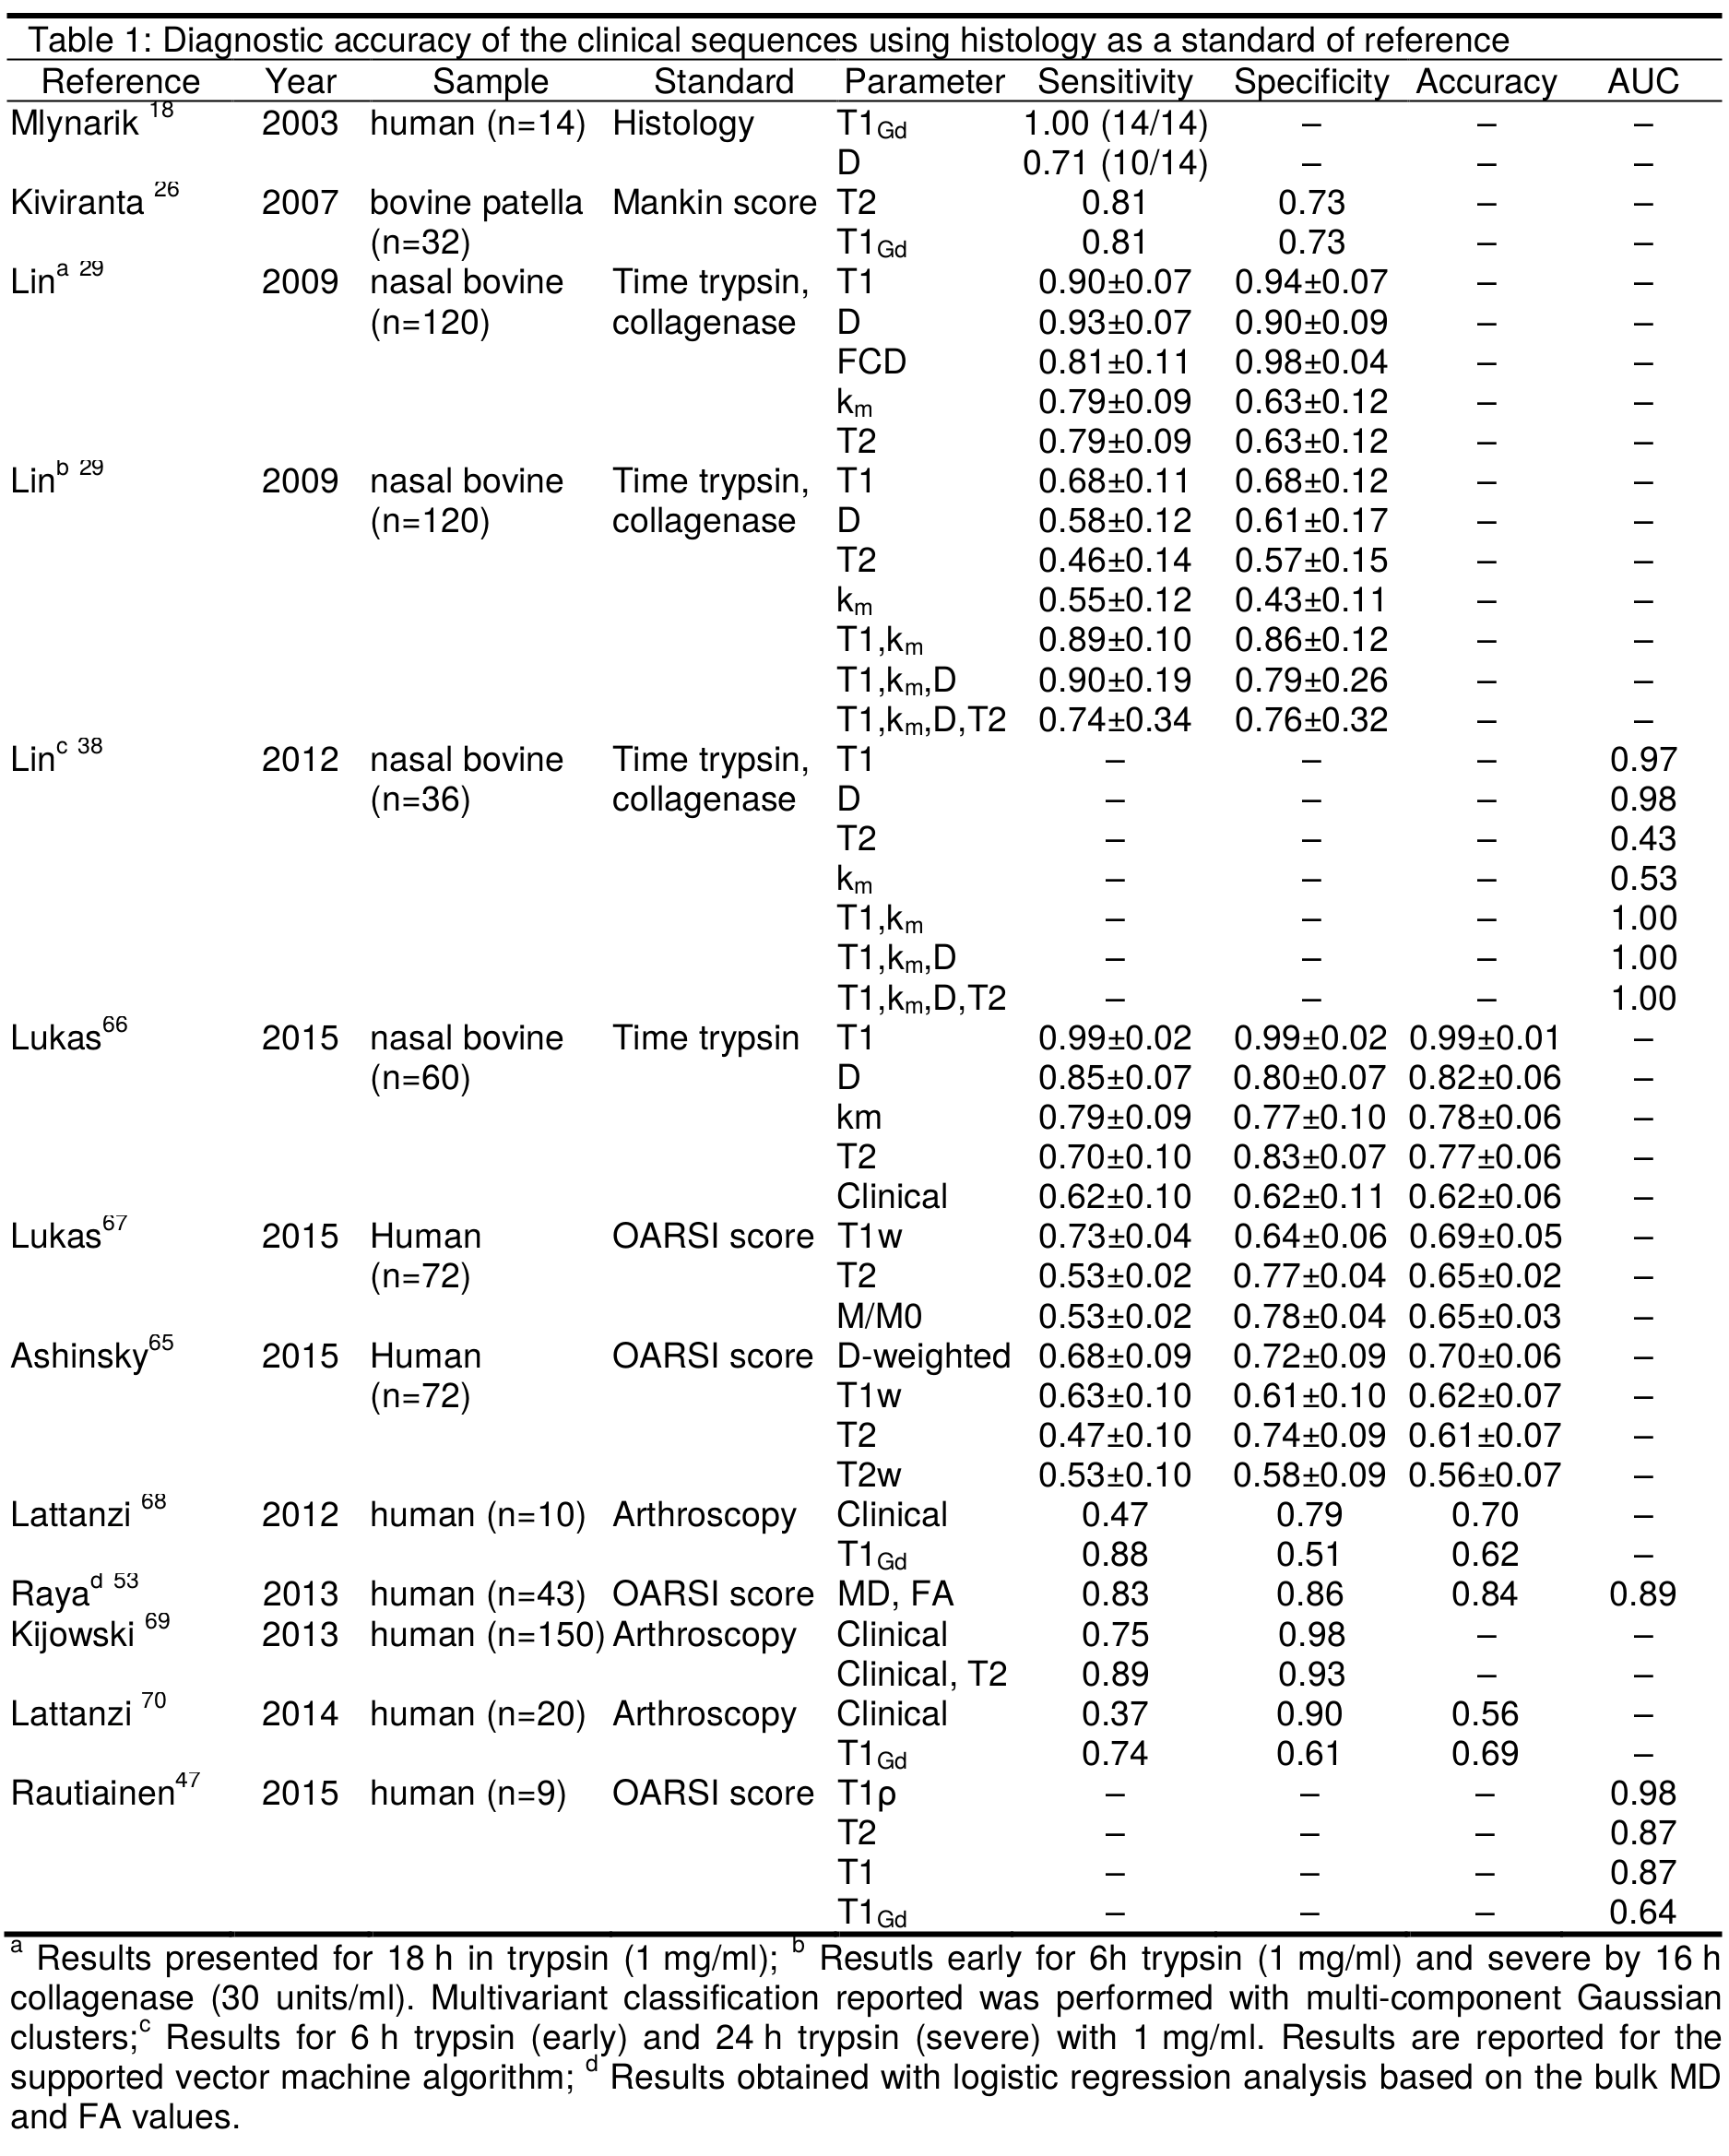
Only 10 of publications analyzed the diagnostic accuracy of MRI parameters for detecting cartilage damage, from which 6 comes from the same group.[26,29,30,38,47,53,65-67] We identified 4 in vivo studies on patients that undergo arthroscopy as a standard of reference.[68-70] The diagnostic accuracy is summarized in Table 1. Best univariate MRI classifiers were T1 (sensitivity(S)=78%, specificity(Sp)=87%), diffusion (S=78%,Sp=79%), T1Gd (S=79%,Sp=62%) and magnetization transfer (S=62%,Sp=66%). Multivariate classifications improved classification.
CONCLUSIONS
Collating data on cartilage composition was challenging due to the very different types of study designs and ways of reporting the results, so we might inadvertently introduced bias. Nonetheless, we can draw some conclusions. First, MRI parameters are modulated by two or more components of the matrix limiting the specificity of MRI to pinpoint molecular changes. Second, there is a large variability in parameter values and correlations that indicates dependence in sequence and protocols. Third, very few studies have analyzed the diagnostic value, so there is still little evidence in support of the clinical use. There is a need to standardize acquisitions and to provide further experimental evidence.Acknowledgements
The research has been supported by the National Institute of Arthritis and Musculoskeletal and Skin Diseases (NIAMS) of the National Institute of Health (NIH); Grant numbers: R21AR066897, RO1AR067789References
1. Bayliss, M.T., et al., Structure of proteoglycans from different layers of human articular cartilage. Biochem J, 1983. February 1; 209(2): 387–400.
2. Grushko, G., R. Schneiderman, and A. Maroudas, Some biochemical and biophysical parameters for the study of the pathogenesis of osteoarthritis: a comparison between the processes of ageing and degeneration in human hip cartilage. Connect Tissue Res, 1989. 19(2-4): p. 149-76.
3. Venn, M. and A. Maroudas, Chemical composition and swelling of normal and osteoarthrotic femoral head cartilage. I. Chemical composition. Ann Rheum Dis, 1977. 36(2): p. 121-9.
4. Koskinen, S.K., et al., MR imaging of patellar cartilage degeneration at 0.02 T. Study of 23 cadaveric patellae. Acta Radiol, 1991. 32(6): p. 514-7.
5. Paul, P., et al., Detection of cartilage degradation with sodium NMR. Br J Rheumatol, 1991. 30(4): p. 318.
6. Morris, G.A. and A.J. Freemont, Direct observation of the magnetization exchange dynamics responsible for magnetization transfer contrast in human cartilage in vitro. Magn Reson Med, 1992. 28(1): p. 97-104.
7. Jelicks, L.A., et al., Hydrogen-1, sodium-23, and carbon-13 MR spectroscopy of cartilage degradation in vitro. J Magn Reson Imaging, 1993. 3(4): p. 565-8.
8. Burstein, D., et al., Diffusion of small solutes in cartilage as measured by nuclear magnetic resonance (NMR) spectroscopy and imaging. J Orthop Res, 1993. 11(4): p. 465-478.
9. Bashir, A., M.L. Gray, and D. Burstein, Gd-DTPA2- as a measure of cartilage degradation. Magn Reson Med, 1996. 36(5): p. 665-673.
10. Koskinen, S.K., et al., Magnetization transfer and spin lock MR imaging of patellar cartilage degeneration at 0.1 T. Acta Radiol, 1997. 38(6): p. 1071-5.11. Cohen, J., Statistical power analysis for the behavioral sciences1988, Hillsdale, NJ: Lawrence Erlbaum.
12. Kim, D.K., et al., Analysis of water-macromolecule proton magnetization transfer in articular cartilage. Magn Reson Med, 1993. 29(2): p. 211-5.
13. Nieminen, M.T., et al., Quantitative MR microscopy of enzymatically degraded articular cartilage. Magn Reson Med, 2000. 43(5): p. 676-81.
14. Toffanin, R., et al., Proteoglycan depletion and magnetic resonance parameters of articular cartilage. Arch Biochem Biophys, 2001. 390(2): p. 235-42.
15. Watrin, A., et al., T2 mapping of rat patellar cartilage. Radiology, 2001. 219(2): p. 395-402.
16. Duvvuri, U., et al., T(1rho) relaxation can assess longitudinal proteoglycan loss from articular cartilage in vitro. Osteoarthritis Cartilage, 2002. 10(11): p. 838-44.
17. Henkelman, R.M., et al., Can MTR be used to assess cartilage in the presence of Gd-DTPA2-? Magn Reson Med, 2002. 48(6): p. 1081-4.
18. Mlynárik, V., et al., Investigation of apparent diffusion constant as an indicator of early degenerative disease in articular cartilage. J Magn Reson Imaging, 2003. 17(4): p. 440-4.
19. Menezes, N.M., et al., T2 and T1rho MRI in articular cartilage systems. Magn Reson Med, 2004. 51(3): p. 503-509.
20. Nissi, M., et al., Proteoglycan and collagen sensitive MRI evaluation of normal and degenerated articular cartilage. J Orthop Res, 2004. 22(3): p. 557-64.
21. David-Vaudey, E., et al., T2 relaxation time measurements in osteoarthritis. Magn Reson Imaging, 2004. 22(5): p. 673-82.
22. Watrin-Pinzano, A., et al., Effect of proteoglycan depletion on T2 mapping in rat patellar cartilage. Radiology, 2005. 234(1): p. 162-70.
23. Regatte, R.R., et al., T1rho relaxation mapping in human osteoarthritis (OA) cartilage: comparison of T1rho with T2. J Magn Reson Imaging, 2006. 23(4): p. 547-553.
24. Lammentausta, E., et al., Quantitative MRI of parallel changes of articular cartilage and underlying trabecular bone in degeneration. Osteoarthritis Cartilage, 2007. 15(10): p. 1149-57.
25. Othman, S.F., et al., High-resolution/high-contrast MRI of human articular cartilage lesions. Acta Orthop, 2007. 78(4): p. 536-46.
26. Kiviranta, P., et al., Comparison of novel clinically applicable methodology for sensitive diagnostics of cartilage degeneration. Eur Cell Mater, 2007. 13: p. 46-55; discussion 55.
27. Chou, M.C., et al., Correlation between the MR T2 value at 4.7 T and relative water content in articular cartilage in experimental osteoarthritis induced by ACL transection. Osteoarthritis Cartilage, 2009. 17(4): p. 441-7.
28. Juráš, V., et al., In vitro determination of biomechanical properties of human articular cartilage in osteoarthritis using multi-parametric MRI. J Magn Reson, 2009. 197(1): p. 40-47.
29. Lin, P.C., D.A. Reiter, and R.G. Spencer, Sensitivity and specificity of univariate MRI analysis of experimentally degraded cartilage. Magn Reson Med, 2009. 62(5): p. 1311-1318.
30. Lin, P.C., D.A. Reiter, and R.G. Spencer, Classification of degraded cartilage through multiparametric MRI analysis. J Magn Reson, 2009. 201(1): p. 61-71.
31. Berberat, J.E., et al., Assessment of interstitial water content of articular cartilage with T1 relaxation. Magn Reson Imaging, 2009. 27(5): p. 727-32.
32. Zheng, S. and Y. Xia, On the measurement of multi-component T2 relaxation in cartilage by MR spectroscopy and imaging. Magn Reson Imaging, 2010. 28(4): p. 537-45.
33. Zheng, S. and Y. Xia, Multi-components of T2 relaxation in ex vivo cartilage and tendon. J Magn Reson, 2009. 198(2): p. 188-96.
34. Keenan, K.E., et al., Prediction of glycosaminoglycan content in human cartilage by age, T1ρ and T2 MRI. Osteoarthritis Cartilage, 2011. 19(2): p. 171-179.
35. Li, X., et al., Quantitative MRI using T1ρ and T2 in human osteoarthritic cartilage specimens: correlation with biochemical measurements and histology. Magn Reson Imaging, 2011. 29(3): p. 324-334.
36. Reiter, D.A., et al., Improved specificity of cartilage matrix evaluation using multiexponential transverse relaxation analysis applied to pathomimetically degraded cartilage. NMR Biomed, 2011. 24(10): p. 1286-94.
37. Nishioka, H., et al., T1rho and T2 mapping reveal the in vivo extracellular matrix of articular cartilage. J Magn Reson Imaging, 2012. 35(1): p. 147-55.
38. Lin, P.C., et al., Multivariate analysis of cartilage degradation using the support vector machine algorithm. Magn Reson Med, 2012. 67(6): p. 1815-1826.
39. Wang, N. and Y. Xia, Experimental issues in the measurement of multi-component relaxation times in articular cartilage by microscopic MRI. J Magn Reson, 2013. 235: p. 15-25.
40. Kim, T., et al., An in vitro comparative study of T2 and T2* mappings of human articular cartilage at 3-Tesla MRI using histology as the standard of reference. Skeletal Radiol, 2014. 43(7): p. 947-54.
41. Reiter, D.A., et al., Anomalous T2 Relaxation in Normal and Degraded Cartilage. Magn Reson Med, 2016. 76(3): p. 953-962.
42. Lesperance, L.M., M.L. Gray, and D. Burstein, Determination of fixed charge density in cartilage using nuclear magnetic resonance. J Orthop Res, 1992. 10(1): p. 1-13.
43. Bashir, A., et al., Nondestructive imaging of human cartilage glycosaminoglycan concentration by MRI. Magn Reson Med, 1999. 41(5): p. 857-65.
44. Trattnig, S., et al., MRI visualization of proteoglycan depletion in articular cartilage via intravenous administration of Gd-DTPA. Magn Reson Imaging, 1999. 17(4): p. 577-83.
45. Nieminen, M.T., et al., Spatial assessment of articular cartilage proteoglycans with Gd-DTPA-enhanced T1 imaging. Magn Reson Med, 2002. 48(4): p. 640-8.
46. Stikov, N., et al., Cross-relaxation imaging of human articular cartilage. Magn Reson Med, 2011. 66(3): p. 725-34.
47. Rautiainen, J., et al., Multiparametric MRI assessment of human articular cartilage degeneration: Correlation with quantitative histology and mechanical properties. Magn Reson Med, 2014.
48. Xia, Y., et al., Self-diffusion monitors degraded cartilage. Arch Biochem Biophys, 1995. 323(2): p. 323-8.
49. Berg, A., T. Singer, and E. Moser, High-resolution diffusivity imaging at 3.0 T for the detection of degenerative changes: a trypsin-based arthritis model. Invest Radiol, 2003. 38(7): p. 460-6.
50. Meder, R., et al., Diffusion tensor imaging of articular cartilage as a measure of tissue microstructure. Osteoarthritis Cartilage, 2006. 14(9): p. 875-881.
51. Deng, X., et al., Diffusion tensor imaging of native and degenerated human articular cartilage. Magn Reson Imag, 2007. 25(2): p. 168-171.
52. Raya, J.G., et al., Change of Diffusion Tensor Imaging Parameters in Articular Cartilage with Progressive Proteoglycan Extraction. Invest Radiol, 2011. 46(6): p. 401-409.
53. Raya, J.G., et al., Diffusion-tensor imaging of human articular cartilage specimens with early signs of cartilage damage. Radiology, 2013. 266(3): p. 831-841.
54. Zheng, S. and Y. Xia, The impact of the relaxivity definition on the quantitative measurement of glycosaminoglycans in cartilage by the MRI dGEMRIC method. Magn Reson Med, 2010. 63(1): p. 25-32.
55. Stubendorff, J.J., et al., Is cartilage sGAG content related to early changes in cartilage disease? Implications for interpretation of dGEMRIC. Osteoarthritis Cartilage, 2012. 20(5): p. 396-404.
56. Akella, S.V., et al., Proteoglycan-induced changes in T1rho-relaxation of articular cartilage at 4T. Magn Reson Med, 2001. 46(3): p. 419-23.
57. Tsushima, H., et al., Evaluation of cartilage degradation in arthritis using T1rho magnetic resonance imaging mapping. Rheumatol Int, 2012. 32(9): p. 2867-75.
58. Wang, N. and Y. Xia, Dependencies of multi-component T2 and T1rho relaxation on the anisotropy of collagen fibrils in bovine nasal cartilage. J Magn Reson, 2011. 212(1): p. 124-32.
59. Wang, N. and Y. Xia, Depth and orientational dependencies of MRI T(2) and T(1rho) sensitivities towards trypsin degradation and Gd-DTPA(2-) presence in articular cartilage at microscopic resolution. Magn Reson Imaging, 2012. 30(3): p. 361-70.
60. Wang, N. and Y. Xia, Orientational dependent sensitivities of T2 and T1rho towards trypsin degradation and Gd-DTPA2- presence in bovine nasal cartilage. Magn Reson Mater Phy, 2012. 25(4): p. 297-304.
61. Gray, M.L., et al., Magnetization transfer in cartilage and its constituent macromolecules. Magn Reson Med, 1995. 34(3): p. 319-25.
62. Wachsmuth, L., H.P. Juretschke, and R.X. Raiss, Can magnetization transfer magnetic resonance imaging follow proteoglycan depletion in articular cartilage? Magn Reson Mater Phy, 1997. 5(1): p. 71-8.
63. Borthakur, A., et al., Effect of IL-1beta-induced macromolecular depletion on residual quadrupolar interaction in articular cartilage. J Magn Reson Imaging, 2002. 15(3): p. 315-23.
64. Wheaton, A.J., et al., Sodium magnetic resonance imaging of proteoglycan depletion in an in vivo model of osteoarthritis. Acad Radiol, 2004. 11(1): p. 21-8.
65. Ashinsky, B.G., et al., Machine learning classification of OARSI-scored human articular cartilage using magnetic resonance imaging. Osteoarthritis Cartilage, 2015. 23(10): p. 1704-12.
66. Lukas, V.A., et al., Sensitivity and specificity of univariate MRI analysis of experimentally degraded cartilage under clinical imaging conditions. Journal of Magnetic Resonance Imaging, 2015. 42(1): p. 136-144.
67. Lukas, V.A., et al., Classification of Histologically Scored Human Knee Osteochondral Plugs by Quantitative Analysis of Magnetic Resonance Images at 3T. Journal of Orthopaedic Research, 2015. 33(5): p. 640-650.
68. Lattanzi, R., et al., A new method to analyze dGEMRIC measurements in femoroacetabular impingement: preliminary validation against arthroscopic findings. Osteoarthritis Cartilage, 2012. 20(10): p. 1127-33.
69. Kijowski, R., et al., Evaluation of the articular cartilage of the knee joint: value of adding a T2 mapping sequence to a routine MR imaging protocol. Radiology, 2013. 267(2): p. 503-513.
70. Lattanzi, R., et al., Detection of cartilage damage in femoroacetabular impingement with standardized dGEMRIC at 3 T. Osteoarthritis Cartilage, 2014. 22(3): p. 447-56.
Figures