5084
Test-retest repeatability of human speech biomarkers from static and real-time dynamic magnetic resonance imaging1Ming Hsieh Department of Electrical Engineering, University of Southern California, Los Angeles, CA, United States
Synopsis
This study presents a test-retest repeatability framework for quantitative speech biomarkers from static MRI and real-time MRI (RT-MRI), and applies the framework to healthy volunteers (n=8). Repeatability was quantified using intraclass correlation coefficient (ICC) and mean within-subject standard deviation (σe). Inter-study agreement was strong to very strong for static anatomical biomarkers, (ICC: min/median/max 0.71/0.89/0.98, σe: min/median/max 0.90/2.20/6.72 mm), poor to very strong for dynamic RT-MRI biomarkers of articulator motion range (ICC: 0.26/0.75/0.90, σe: 1.6/2.5/3.6 mm) and poor to very strong for velocity (ICC: 0.26/0.56/0.93, σe: 2.2/4.4/16.7 cm/s). The introduced framework can be used to guide future development of speech biomarkers.
Purpose
Static anatomical and real-time dynamic magnetic resonance imaging (RT-MRI) of the upper airway are valuable methods for studying upper airway function in research1–9 and clinical settings.10–12 The test-retest repeatability of quantitative imaging biomarkers13 is an important parameter, since it sets the fundamental limit to effect sizes and group differences that can be studied. This study aims to present a test-retest repeatability framework for quantitative speech biomarkers from static MRI and RT-MRI, and apply it to healthy volunteers.Methods
Healthy volunteers (n=8, 4 female, 4 male) were examined on a GE Signa Excite scanner using a custom 8-channel upper airway coil.14 The protocol, including static and dynamic speech task imaging, was performed twice on the same day.
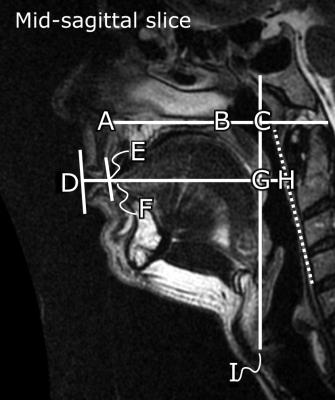
The static protocol consisted of sagittal T2-weighted fast spin echo imaging, with 50 slices covering the head. Sequence parameters: resolution 0.6x0.6 mm, slice thickness 3 mm, TR/TE/flip 4500 ms/121 ms/90°, acquisition time 3.5 minutes. Upper airway anatomical biomarkers were measured manually in a mid-sagittal slice (Figure 1).
Dynamic imaging was performed using a real-time spiral sequence based on RTHawk (HeartVista, Menlo Park, CA, USA).14,15 Sequence parameters: one mid-sagittal slice, field of view 200x200 mm, spatial resolution 2.4x2.4 mm, slice thickness 6 mm, TR 6 ms, TE 3.6 ms, flip angle 15° and 13 spirals for full (Nyquist) sampling. Images were reconstructed to a temporal resolution of 12 ms (2 spirals per frame, 83 fps) using a temporal finite-difference constraint,14 implemented in the Berkeley Advanced Reconstruction Toolbox (BART).16,17
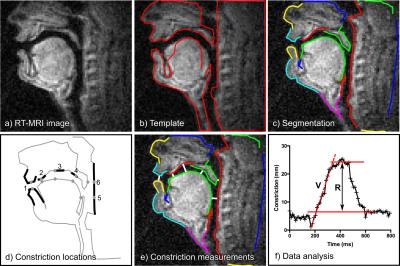
For dynamic imaging, subjects were instructed to speak simple utterances targeting constriction formation at the lips (‘apa’, ‘ipi’, ‘upu’), alveolar ridge (‘ata’, ‘iti’, ‘utu’), back of the palate (‘aka’, ‘iki’, ‘uku’), velopharyngeal opening (‘ama’, ‘imi’, ‘umu’) and tongue forward-backward motion (‘aa-ii-aa’). The set of speech tasks was repeated 10 times in each scan. A semi-automatic segmentation method was used to delineate articulators for each utterance (Figure 2).18 Two quantitative biomarkers were computed for each utterance: articulator motion range (R) and velocity (V) (Figure 2). All image analysis was performed by one observer.
For both static and dynamic biomarkers, inter-study agreement was quantified using intraclass correlation coefficient (ICC) from a linear mixed-effects model. The model-estimated variances were used to compute mean within-subject standard deviation (σe).
Results
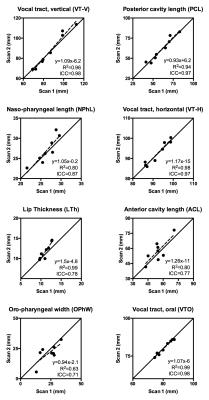
Static anatomical biomarkers showed strong to very strong repeatability (ICC min/median/max: 0.71/0.89/0.98, σe min/median/max). The mean within-subject standard deviation (σe) ranged from 0.9 mm (VT-O) to 6.7 mm (ACL), with a median of 2.2 mm. Compared to dynamic RT-MRI biomarkers, static biomarkers had higher ICC (0.89±0.09 vs 0.59±0.21, p<0.0001). Figure 3 shows graphical results for a subset of static biomarkers.
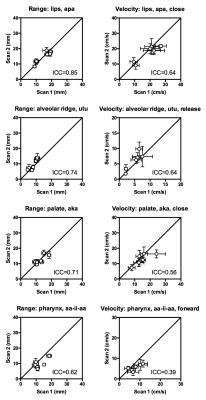
For dynamic biomarkers, range (R) showed higher ICC than velocity (V) (0.70±0.21 vs. 0.50±0.23, p=0.03). Articulator motion range showed poor to strong repeatability (ICC min/median/max: 0.26/0.72/0.90). The mean within-subject standard deviation (σe) ranged from 1.6 mm to 3.3 mm, with median 2.3 mm. Velocity showed poor to strong repeatability, with ICC values from 0.00 (palate, ‘uku’, close) to 0.84, with median 0.54, and σe ranged from 1.5 cm/s to 6.6 cm/s with median 3.5 cm/s. Figure 4 shows graphical results for a subset of biomarkers.
Discussion
The higher ICC values observed for static anatomical compared to real-time dynamic biomarkers can be explained by several factors, including that no variation in speaker anatomy is expected in the short time between scans. In contrast, several factors may influence dynamic biomarkers, such as short-term variability in speech production. Furthermore, dynamic phenomena are inherently more challenging to image compared to static anatomy due to the trade-offs required in designing the RT-MRI sequence.14 Finally, static scans have higher spatial resolution and are less sensitive to off-resonance effects at tissue-airway boundaries than RT-MRI.
The lower ICC in velocity measurements compared to range suggests that RT-MRI velocity measurements should be performed and interpreted carefully, or with additional regularization of constriction data, as often performed for electromagnetic articulography (EMA) studies.19 Furthermore, EMA benefits from higher temporal resolutions (up to 500 fps compared to 24-102 fps for RT-MRI14,20), which may provide more repeatable velocity measurements.
Conclusion
This study has investigated test-retest repeatability of static anatomical and real-time dynamic biomarkers of human speech. Static anatomical biomarkers showed strong to very strong repeatability. For dynamic measurements, quantification of articulator motion range showed poor to very strong repeatability. Repeatability of velocities varied from poor to strong depending on utterance, suggesting that velocity measurements should be interpreted with care. The introduced repeatability framework can be used to guide future development of quantitative imaging biomarkers of speech and upper airway function.Acknowledgements
This work is supported the National Science Foundation (NSF, grant #1514544) and by the National Institutes of Health (NIH, grant #R01-DC007124).References
1. Ramanarayanan, V., Lammert, A., Goldstein, L. & Narayanan, S. Are Articulatory Settings Mechanically Advantageous for Speech Motor Control? PLoS One 9, e104168 (2014).
2. Narayanan, S. et al. Real-time magnetic resonance imaging and electromagnetic articulography database for speech production research (TC). J. Acoust. Soc. Am. 136, 1307–1311 (2014).
3. Proctor, M., Bresch, E., Byrd, D., Nayak, K. & Narayanan, S. Paralinguistic mechanisms of production in human ‘beatboxing’: A real-time magnetic resonance imaging study. J. Acoust. Soc. Am. 133, 1043–1054 (2013).
4. Bresch, E. & Narayanan, S. Real-time magnetic resonance imaging investigation of resonance tuning in soprano singing. J. Acoust. Soc. Am. 128, EL335 (2010).
5. Laprie, Y., Loosvelt, M., Maeda, S., Sock, R. & Hirsch, F. Articulatory copy synthesis from cine X-ray films. Proc. Annu. Conf. Int. Speech Commun. Assoc. INTERSPEECH 2013, 2024–2028 (2013).
6. Birkholz, P. Modeling Consonant-Vowel Coarticulation for Articulatory Speech Synthesis. PLoS One 8, e60603 (2013).
7. Sturim, D. et al. The MIT LL 2010 speaker recognition evaluation system: Scalable language-independent speaker recognition. in 2011 IEEE International Conference on Acoustics, Speech and Signal Processing (ICASSP) 5272–5275 (IEEE, 2011). doi:10.1109/ICASSP.2011.5947547
8. Reynolds, D. A., Quatieri, T. F. & Dunn, R. B. Speaker Verification Using Adapted Gaussian Mixture Models. Digit. Signal Process. 10, 19–41 (2000).
9. Li, M. & Narayanan, S. Simplified supervised i-vector modeling with application to robust and efficient language identification and speaker verification. Comput. Speech Lang. 28, 940–958 (2014).
10. Stone, M., Langguth, J. M., Woo, J., Chen, H. & Prince, J. L. Tongue motion patterns in post-glossectomy and typical speakers: a principal components analysis. J. Speech. Lang. Hear. Res. 57, 707–17 (2014).
11. Beer, A. J. et al. Dynamic near-real-time magnetic resonance imaging for analyzing the velopharyngeal closure in comparison with videofluoroscopy. J. Magn. Reson. Imaging 20, 791–797 (2004).
12. Zu, Y. et al. Evaluation of Swallow Function After Tongue Cancer Treatment Using Real-Time Magnetic Resonance Imaging. JAMA Otolaryngol. Neck Surg. 139, 1312–1319 (2013).
13. Kessler, L. G. et al. The emerging science of quantitative imaging biomarkers terminology and definitions for scientific studies and regulatory submissions. Stat. Methods Med. Res. 24, 9–26 (2015).
14. Lingala, S. G. et al. A fast and flexible MRI system for the study of dynamic vocal tract shaping. Magn. Reson. Med. (2016). doi:10.1002/mrm.26090
15. Narayanan, S., Nayak, K., Lee, S. B., Sethy, A. & Byrd, D. An approach to real-time magnetic resonance imaging for speech production. J. Acoust. Soc. Am. 115, 1771–1776 (2004).
16. Tamir, J. I., Ong, F., Cheng, J. Y., Uecker, M. & Lustig, M. Generalized Magnetic Resonance Image Reconstruction using The Berkeley Advanced Reconstruction Toolbox. in ISMRM Workshop on Data Sampling and Image Reconstruction, Sedona 2016 (2016).
17. Uecker, M. et al. Berkeley Advanced Reconstruction Toolbox. in In Proc. Intl. Soc. Mag. Reson. Med. 23:2486 (2015).
18. Bresch, E. & Narayanan, S. Region segmentation in the frequency domain applied to upper airway real-time magnetic resonance images. IEEE Trans. Med. Imaging 28, 323–338 (2009).
19. Perkell, J. S. et al. Electromagnetic midsagittal articulometer systems for transducing speech articulatory movements. J. Acoust. Soc. Am. 92, 3078–3096 (1992).
20. Fu, M. et al. High-resolution dynamic speech imaging with joint low-rank and sparsity constraints. Magn. Reson. Med. 73, 1820–1832 (2015).
Figures


