5083
Personalized map to assess diffuse and focal brain damageGuillaume Bonnier1, Alexis Roche2,3, Tom Hilbert3,4,5, Gunnar Krueger6, Cristina Granziera1,7, and Tobias Kober4
1MGH/MIT/HMS Athinoula A. Martinos Center for Biomedical Imaging, Massachusetts General Hospital, Harvard Medical School, Charlestown, MA, United States, 2Advanced Clinical Imaging Technology, Siemens Healthcare AG, Lausanne, Switzerland, 3Department of Radiology, University Hospital (CHUV), Lausanne, Switzerland, 4Siemens Healthcare AG, Advanced Clinical Imaging Technology, Lausanne, Switzerland, 5LTS5, École Polytechnique Fédérale de Lausanne, Lausanne, Switzerland, 6Siemens Medical Solutions USA, Inc., Malvern, MA, United States, 7Neuroimmunology Unit, Neurology, Department of Clinical Neurosciences, Centre Hospitalier Universitaire Vaudois (CHUV) and University of Lausanne (UNIL), Lausanne, Switzerland
Synopsis
We propose a new methodology, which is based on the quantification of region-specific brain tissue-properties to provide personalize maps of brain damage in a single patient. To achieve this aim, we used T1, T2, T2* and MTI maps and applied the method to detect brain abnormalities in multiple sclerosis patients.
Introduction
Neuro-inflammatory and neuro-degenerative diseases affect the central nervous system causing focal and diffuse damage, which can be quantified using magnetic resonance imaging (MRI). MRI contrasts that are sensitive and specific to pathological mechanisms in neuroinflammation and degeneration are invaluable assets to perform disease diagnosis and monitoring. Recent imaging techniques such as relaxometry or magnetization transfer imaging (MTI) showed high sensitivity to subtle brain changes in a number of neurological disease1-3. Nevertheless, to date, personalized advanced MRI metrics of brain degeneration and inflammation are not available. We propose here a new methodology, which is based on the quantification of region-specific brain tissue-properties to provide personalize maps of brain damage in a single patient. To achive this aim, we used T1, T2* and MTI maps and applied the method to detect brain abnormalities in multiple sclerosis patients.Method
We acquired Magnetization Prepared 2 Rapid Acquisition Gradient Echoes (MP2RAGE)4 at 3T for T1 relaxometry, as well as T25 and T2* relaxometry and MTI using prototype sequences in 19 healthy controls and 5 relapsing-remitting MS (RRMS) patients at early phase of the disease (Table 1). Brain segmentation into lobes and concentration estimation of brain tissues (white matter, grey matter and cerebrospinal fluid) were performed on T1 maps using a partial volume estimation algorithm6. Lesions were manually segmented by two raters in consensus on MP2RAGE images. For each contrast (T1, T2, T2* and magnetization transfer ratio-MTR), we estimated a healthy distribution of each brain tissue in each lobe7 and performed a voxel-wise comparison of each patient to the healthy distribution of each contrast using a T-score. Finally, we qualitatively analyzed the T-score maps in each subject and contrast and measured the mean T-score in the RRMS patient lesions.Results
The deviation maps computed from T1 maps of the 4 healthy controls showed no with high T-score value (Figure 2.A). The deviation map from RRMS patients (Figure 2.B), showed high mean T-score inside lesions (Mean Lesions T-score=3.7±1.8), but also revealed diffuse changes of T1 in the NA tissue surrounding lesions (Figure 2.C). The figure 2 shows the T-score maps of a RRMS patient computed from T2, MTR and T2* maps with strong changes inside lesions characterized by high T2 T-score (Mean T2 Lesions T-score = 1.6 ± 0.7), but a low MTR T-score (Mean MTR Lesions T-score = -0.9 ± 0.6) and T2* T-score (Mean T2* Lesions T-score = 0.7 ± 0.3) (Figure 3). We also observe diffuse changes in T2 T-score map around the lesions, also present but less advanced in the T2* T-score map.Discussion and Conclusion
We propose a novel approach to provide personalized quantification of brain damage using a comparison between quantitative parameters of tissue integrity in a patient and the distribution of the same parameters in a population of healthy controls. Based on the identification of brain tissue concentrations and the measure of a deviation score, we obtain a voxel-wise deviation map, which highlights subtle MR signal variations due to diffuse and focal damage in 5 exemplary MS patients. The T1 contrast appeared to be the most sensitive to both focal and diffuse pathological changes; the lower sensitivity of the other maps could be dependent on the different nature of the signal they provide but also on their lower spatial resolution (Table 1). One advantage of the proposed method compared to conventional voxel-based morphometry8 is that the maps are computed in patient space. The obtained T-score maps evidence both focal and diffuse damage, as it is expected in MS patients9,10. A current challenge of this approach is represented by the cortical ribbon, whose MRI properties appear to be highly variable within lobes: future developments will aim to integrate a more detailed parcellation of the cerebral cortex to overcome this problem. In addition, it can be challenging to estimate WM, GM and CSF concentrations from contrasts with low structural detail (e.g. T2, T2* and MTR). In summary, we have presented a novel approach to perform personalized quantification of brain damage using multiple advanced MRI contrasts, which may permit to better stratify and follow-up the impact of neuroinflammatory and neurodegenerative brain pathologies.Acknowledgements
No acknowledgement found.References
1. Deoni SC. Quantitative relaxometry of the brain, Top Magn Reson Imaging. 2010; 2. Seiler S. et al., Magnetization transfer imaging for in vivo detection of microstructural tissue changes in aging and dementia: a short literature review. J Alzheimers Dis. 2014; 3. Enzinger C. et al., Nonconventional MRI and microstructural cerebral changes in multiple sclerosis. Nat Rev Neurol. 2015; 4. Marques et al., MP2RAGE, a self bias-field corrected sequence for improved segmentation and T1-mapping at high field. NeuroImage 2010;5. Sumpf et al., Fast T2 Mapping with Improved Accuracy Using Undersampled Spin-echo MRI and Model-based Reconstructions with a Generating Function.; 6. Roche et al. Partial Volume Estimation in Brain MRI Revisited. Med Image Comput Comput Assist Interv. 2014 ; 7. Schmitter D. et al., An Evaluation of Volume-Based Morphometry for Prediction of Mild Cognitive Impairment and Alzheimer's Disease. NeuroImage: Clinical, vol. 7, pp. 7-17, 2015. 8. Ashburner et al. Voxel-based morphometry--the methods, Neuroimage. 2000; 9. Seewann A, Vrenken H, van der Valk P, et al. Diffusely abnormal white matter in chronic multiple sclerosis: imaging and histopathologic analysis. Arch Neurol 2009; 10. Parry, A., Clare, S., Jenkinson, M. et al. White matter and lesion T1 relaxation times increase in parallel and correlate with disability in multiple sclerosis. J Neurol (2002) 249: 1279. doi:10.1007/s00415-002-0837-7;Figures
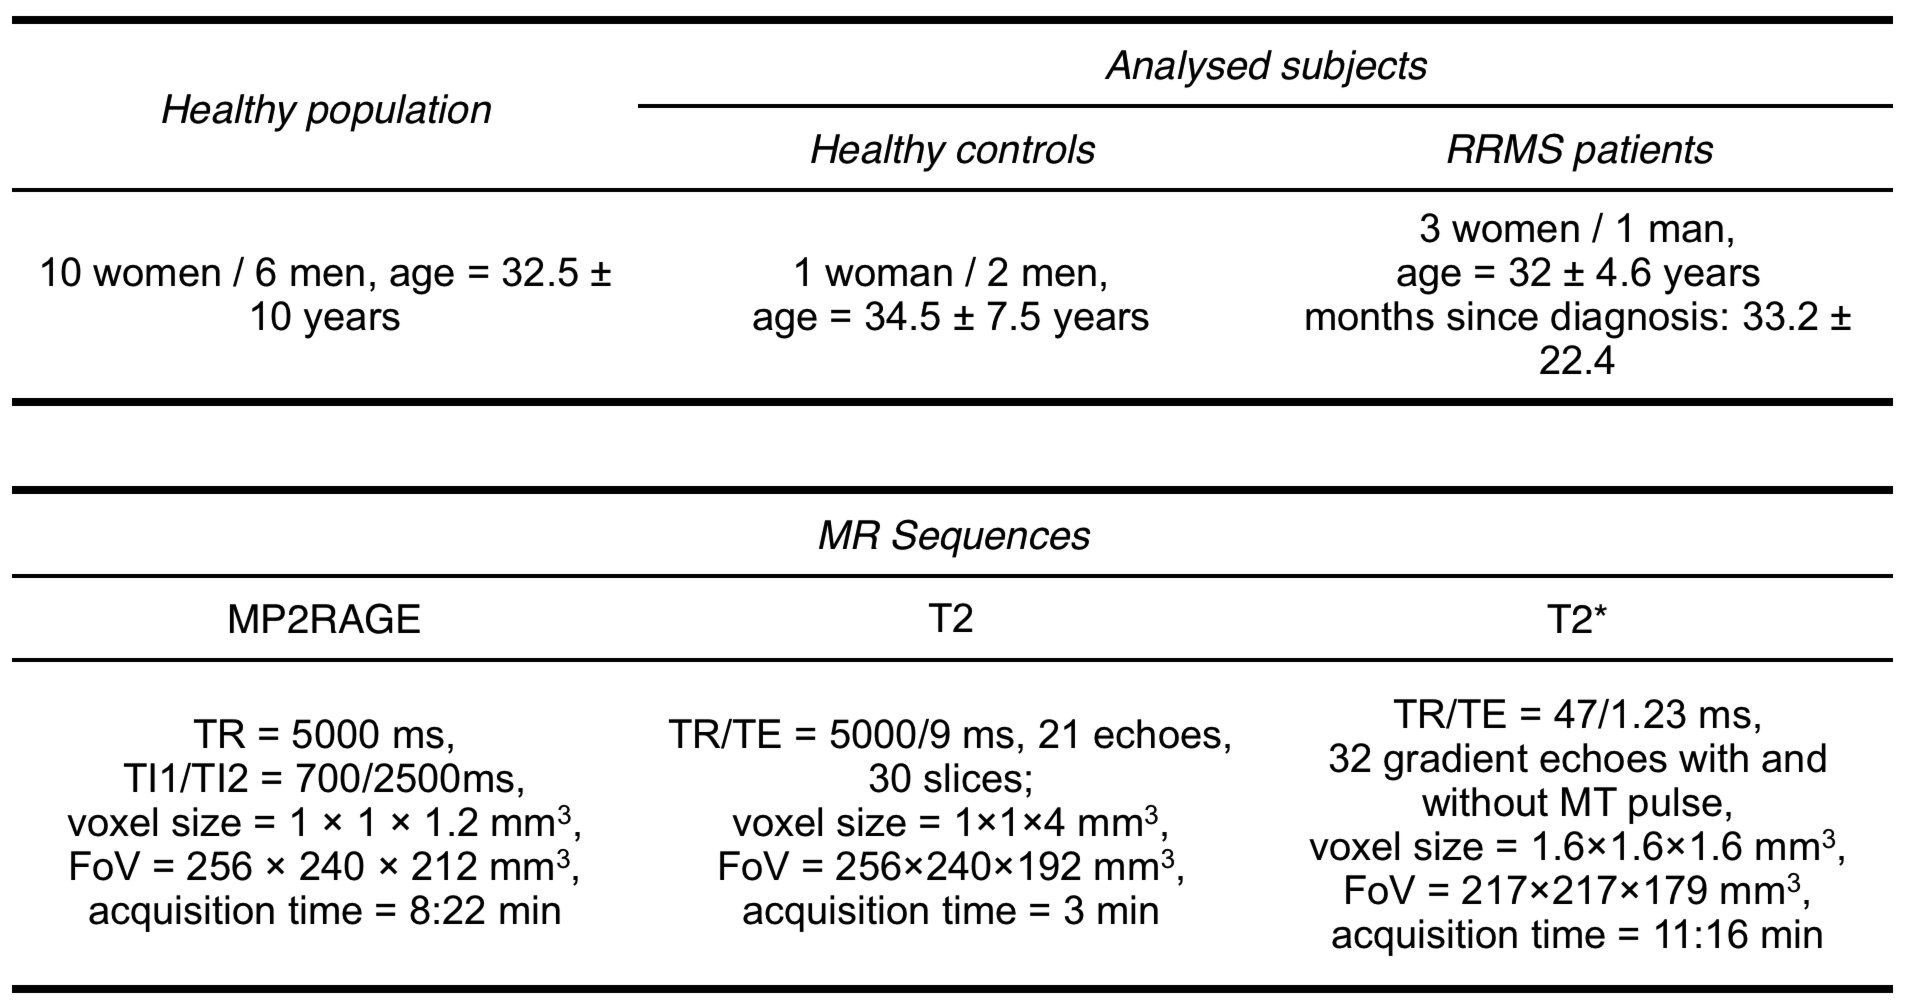
Population statistics and MR sequences parameters

Pipeline to process T-score map in single patient space.
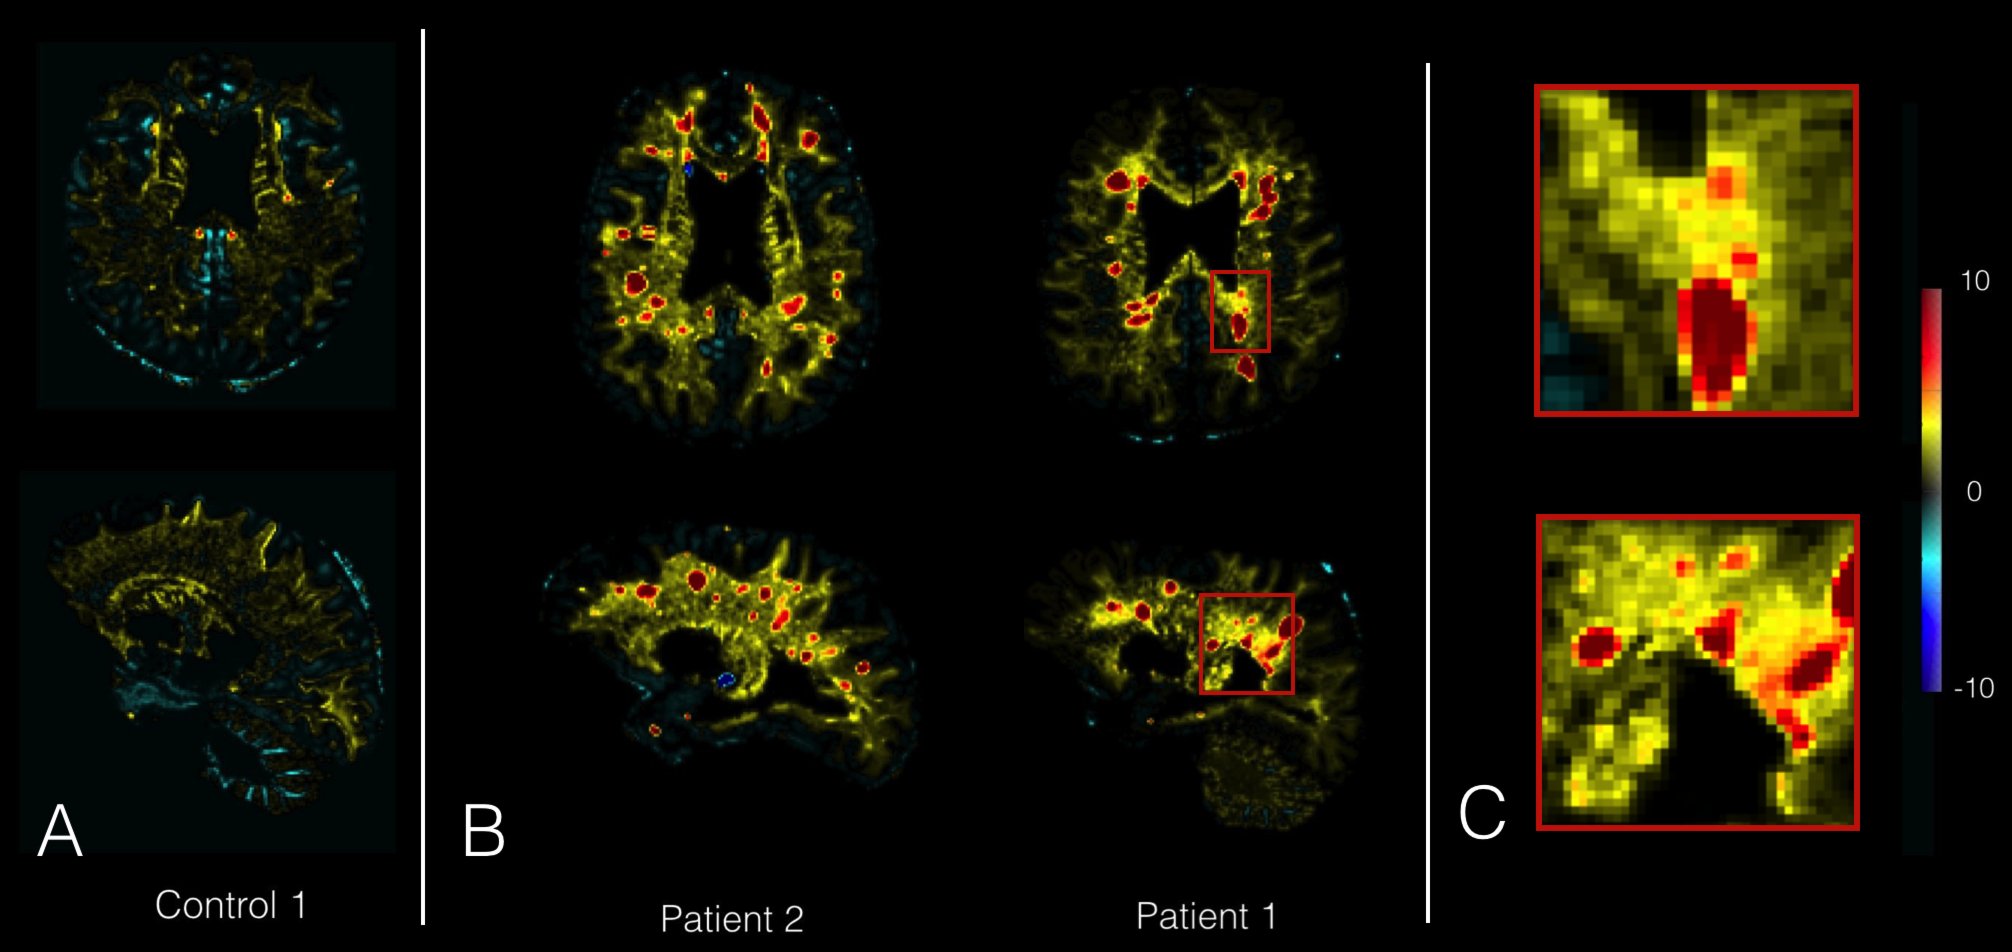
(A) Example of T-score maps from T1 map of 1 healthy control, (B) and 2 RRMS patients. Patients lesions show high T-score on T-score map (red), while control T-score map doesn’t reveal any changes. (C) Zoomed area of Patient 1 showing lesions and diffuse change around the lesion.
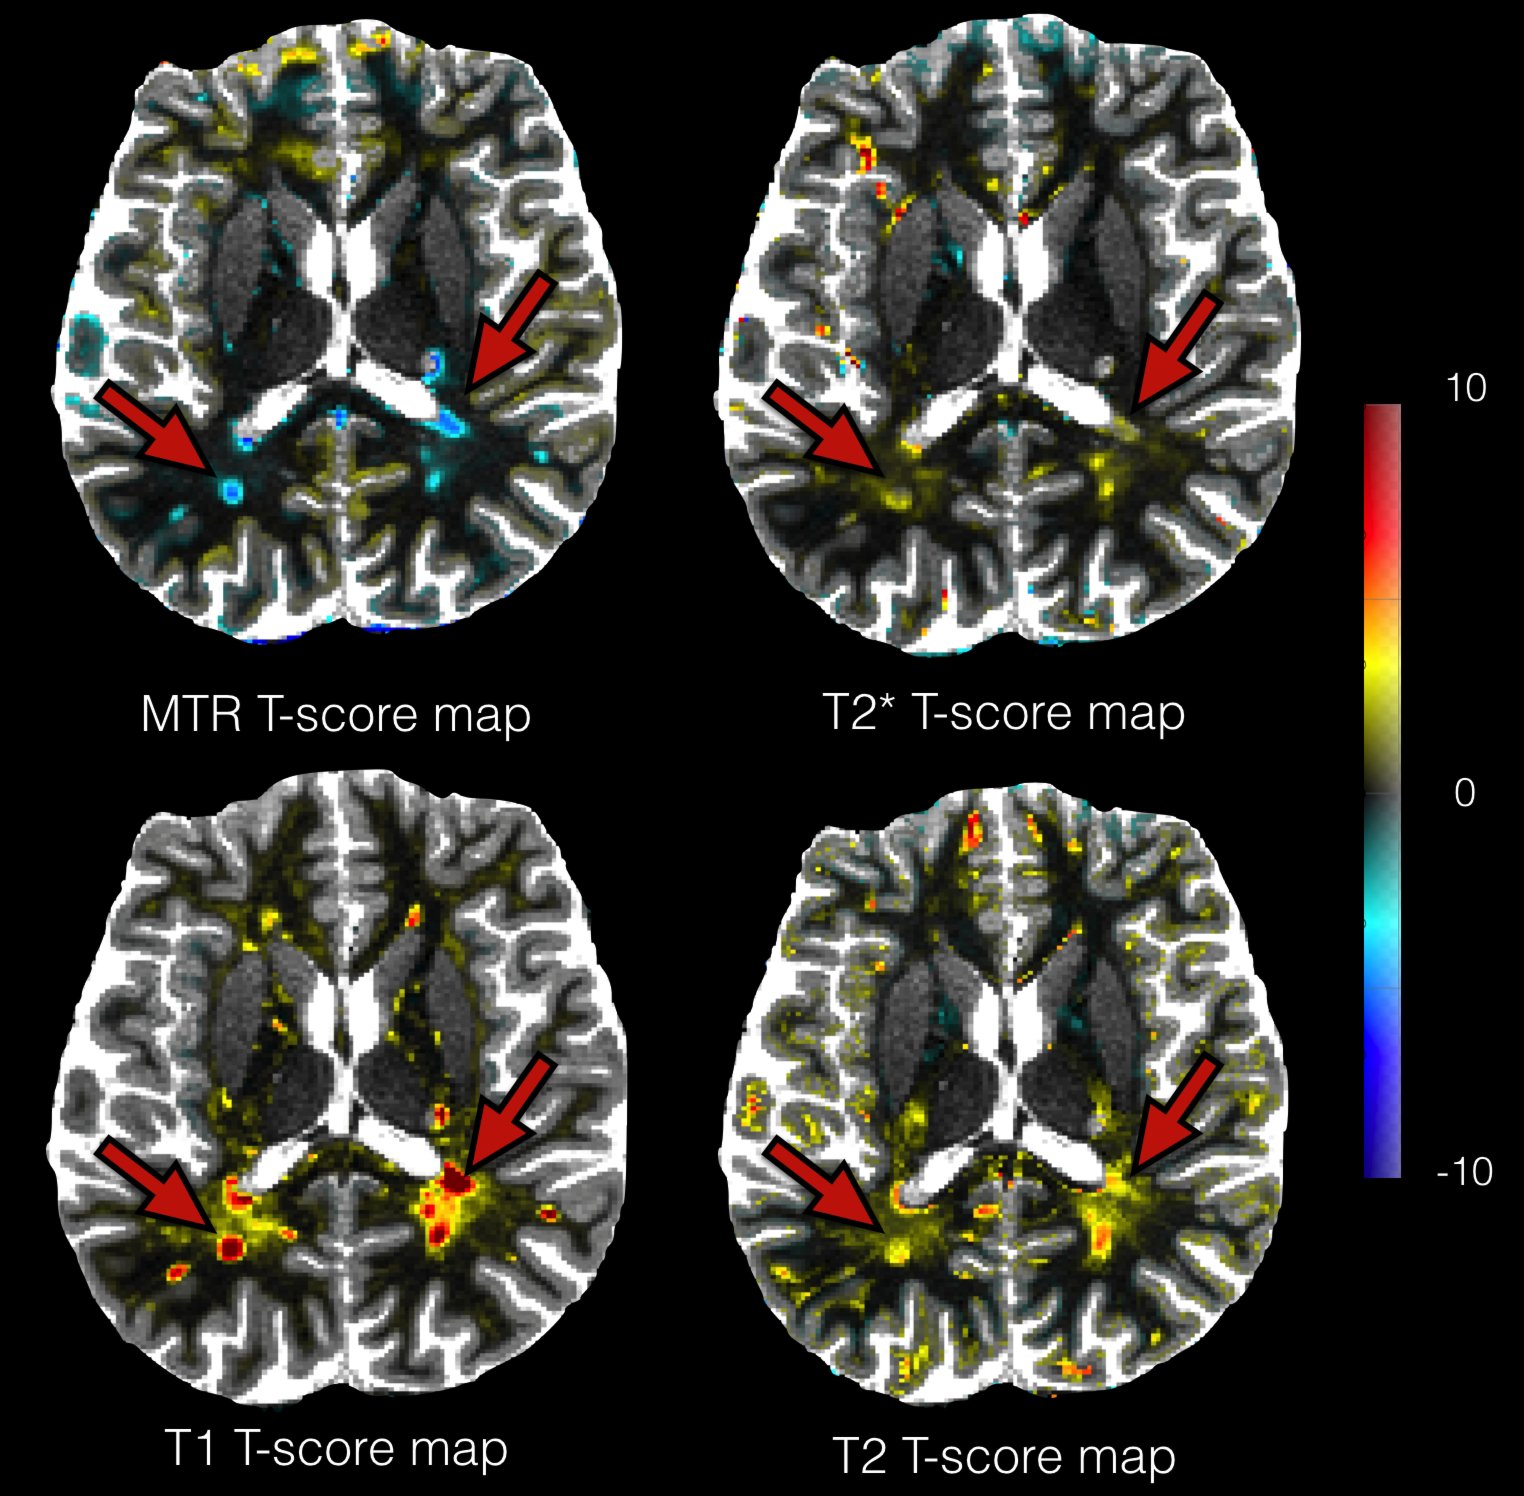
Example of T-score maps overlap on T1 map for a RRMS patients from analysis of T1, T2, T2* and MTR maps. T2, T2* and MTR maps have been registered in T1 map space. We observe strong changes in the lesions (red arrows) on maps, and more diffuse changes in their vicinity on T1 and T2 T-score maps.