5078
Temperature Mapping of Fluorinated (19F) Gas in a Cool Down Experiment1Technische Universität München, Munich, Germany, 2GE Global Research, Munich, Germany
Synopsis
Magnetic resonance imaging (MRI) temperature mapping of gases is challenging due to limited sensitivity. In this proof of concept study, proton thermometry methods from tissue temperature monitoring were transferred to 19F gas MRI.
A phase-dependent 19F resonance frequency shift temperature mapping is proposed for fluorinated gas at 3T based on a spiral readout to overcome limitations of ultra-short relaxation times.
This work demonstrates the feasibility of 2D thermometry in a canonical setup with inert fluorinated gases.
Purpose
Gas temperature mapping could lead to applications in the examination of mechanisms in respiratory airways. In static lung MRI, fluorinated (19F) gases are reported to be a reasonable substitute for hyperpolarized gases1.
However, the concepts of MR thermometry are clinically
only applied in tissue temperature monitoring e.g. for therapeutic hyperthermia2.
A change in temperature induces a proton resonance frequency shift (PRFS), which
serves as a measure for temperature and allows thermometry mapping based on
phase contrast3.
In this proof of concept study, phase contrast temperature mapping using the Fluorine resonance frequency shift (FRFS) is proposed for 19F MRI. Gas temperature sensitivity is investigated in a canonical cool down experiment. Further, PRFS concepts are applied to derive the thermal FRFS coefficient.
Materials and Methods
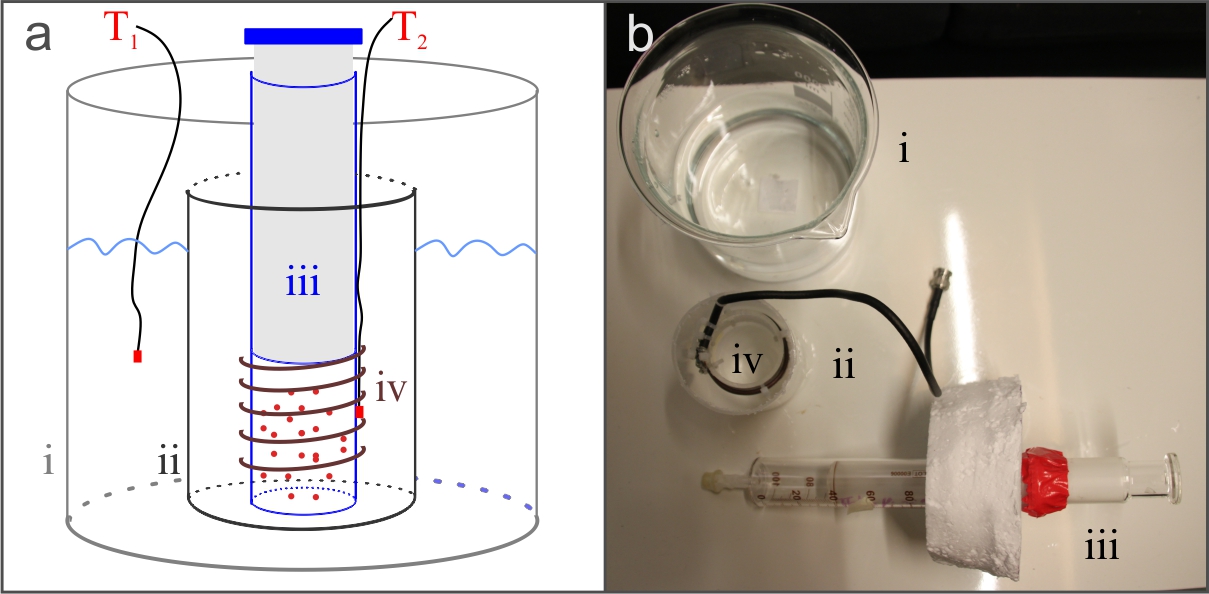
In vitro experiments were performed on a 3.0T GE MR750 (GE Healthcare, Milwaukee, WI) using a tailor-built solenoid-coil at f0=120.19 MHz, connected via a 19F T/R-switch (RAPID Biomedical, Rimpar, Germany). The gases C3HF7, CH2FCF3 and C4F8 (Octafluorocyclobutane), which are chemically inert and colorless, were investigated. Gas was filled into a glass syringe surrounded by the coil (Fig.1) and a bath of H2O to provide mass for a steady cool down process. External temperature was monitored with two fiber optic probes (LumaSense, Frankfurt, Germany).
Spectroscopy and imaging was conducted using a multi-nuclear pulse-and-acquire research sequence with an optional spiral readout. The PRFS method relies on the resonant frequency being described as ω=γB0(1-σ), i.e. the product of gyromagnetic ratio γ and external magnetic field strength B0 minus the screening constant σ. Higher temperature increases the screening, leading to a lower frequency.
Although more complex bonding mechanisms apply for 19F gases, a similar behavior was expected4-6. Hence, spectra were acquired during the cool down to investigate the change in resonance frequency Δf0 of the fluorinated gases and to quantify it with the external monitoring.
Subsequently, spiral images were obtained during the cool down. The resulting phase contrast images, in reference to a baseline acquisition at known temperature, yield a phase shift over time. The recorded phase Φ accumulates over the nominal echo time (TE) as Φ=ωTE and is temperature dependent. To derive the FRFS thermal coefficient, the phase data is plotted over the temperature probe measurements. A linear dependency is expected and the slope of the regression c yields the desired thermal coefficient $$$\alpha=\frac{\it c}{\gamma B_{0} TE}$$$.
This allows for the pixel wise translation of phase contrast images to
temperature changes for constant $$$\gamma_{^{19}F}$$$, B0
and known TE. Thus, absolute temperature values could be deduced in reference
to a known baseline temperature by $$$\small T_{abs}=\frac{\Delta \Phi}{\it c}-T_{ref}$$$.
Results
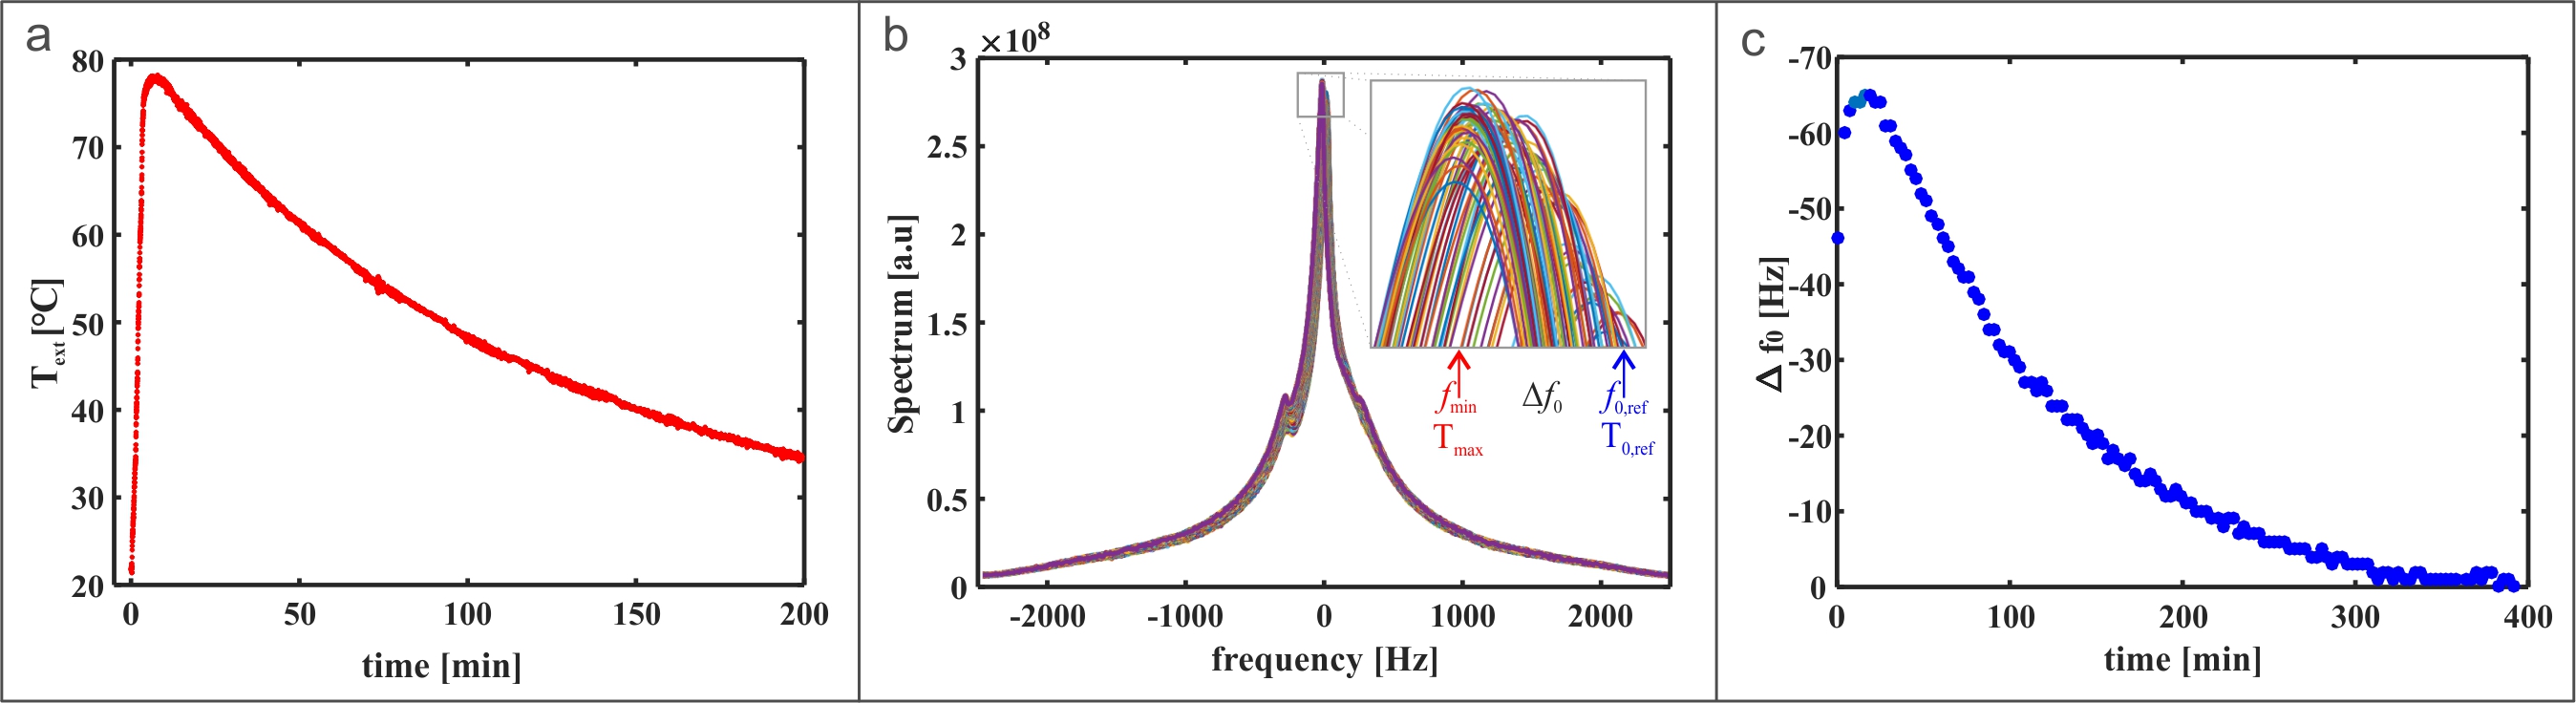
The temperature monitoring of the cool down process (Fig.2(a)) after the initial heating of the glass container reflects the expected exponential decay described by the lumped capacitance model.
Spectra, periodically acquired during the cool down of C4F8 (Fig.2(b)), confirm the resonant frequency response to changing temperature. The inset highlights the resonant frequency shift towards lower frequency at higher temperatures. This is in accordance with the understanding of increased screening.
The graph of Δf0 over time resembles the external temperature data (Fig.2(c)). After the initial heating, center frequencies decay back to the reference frequency.
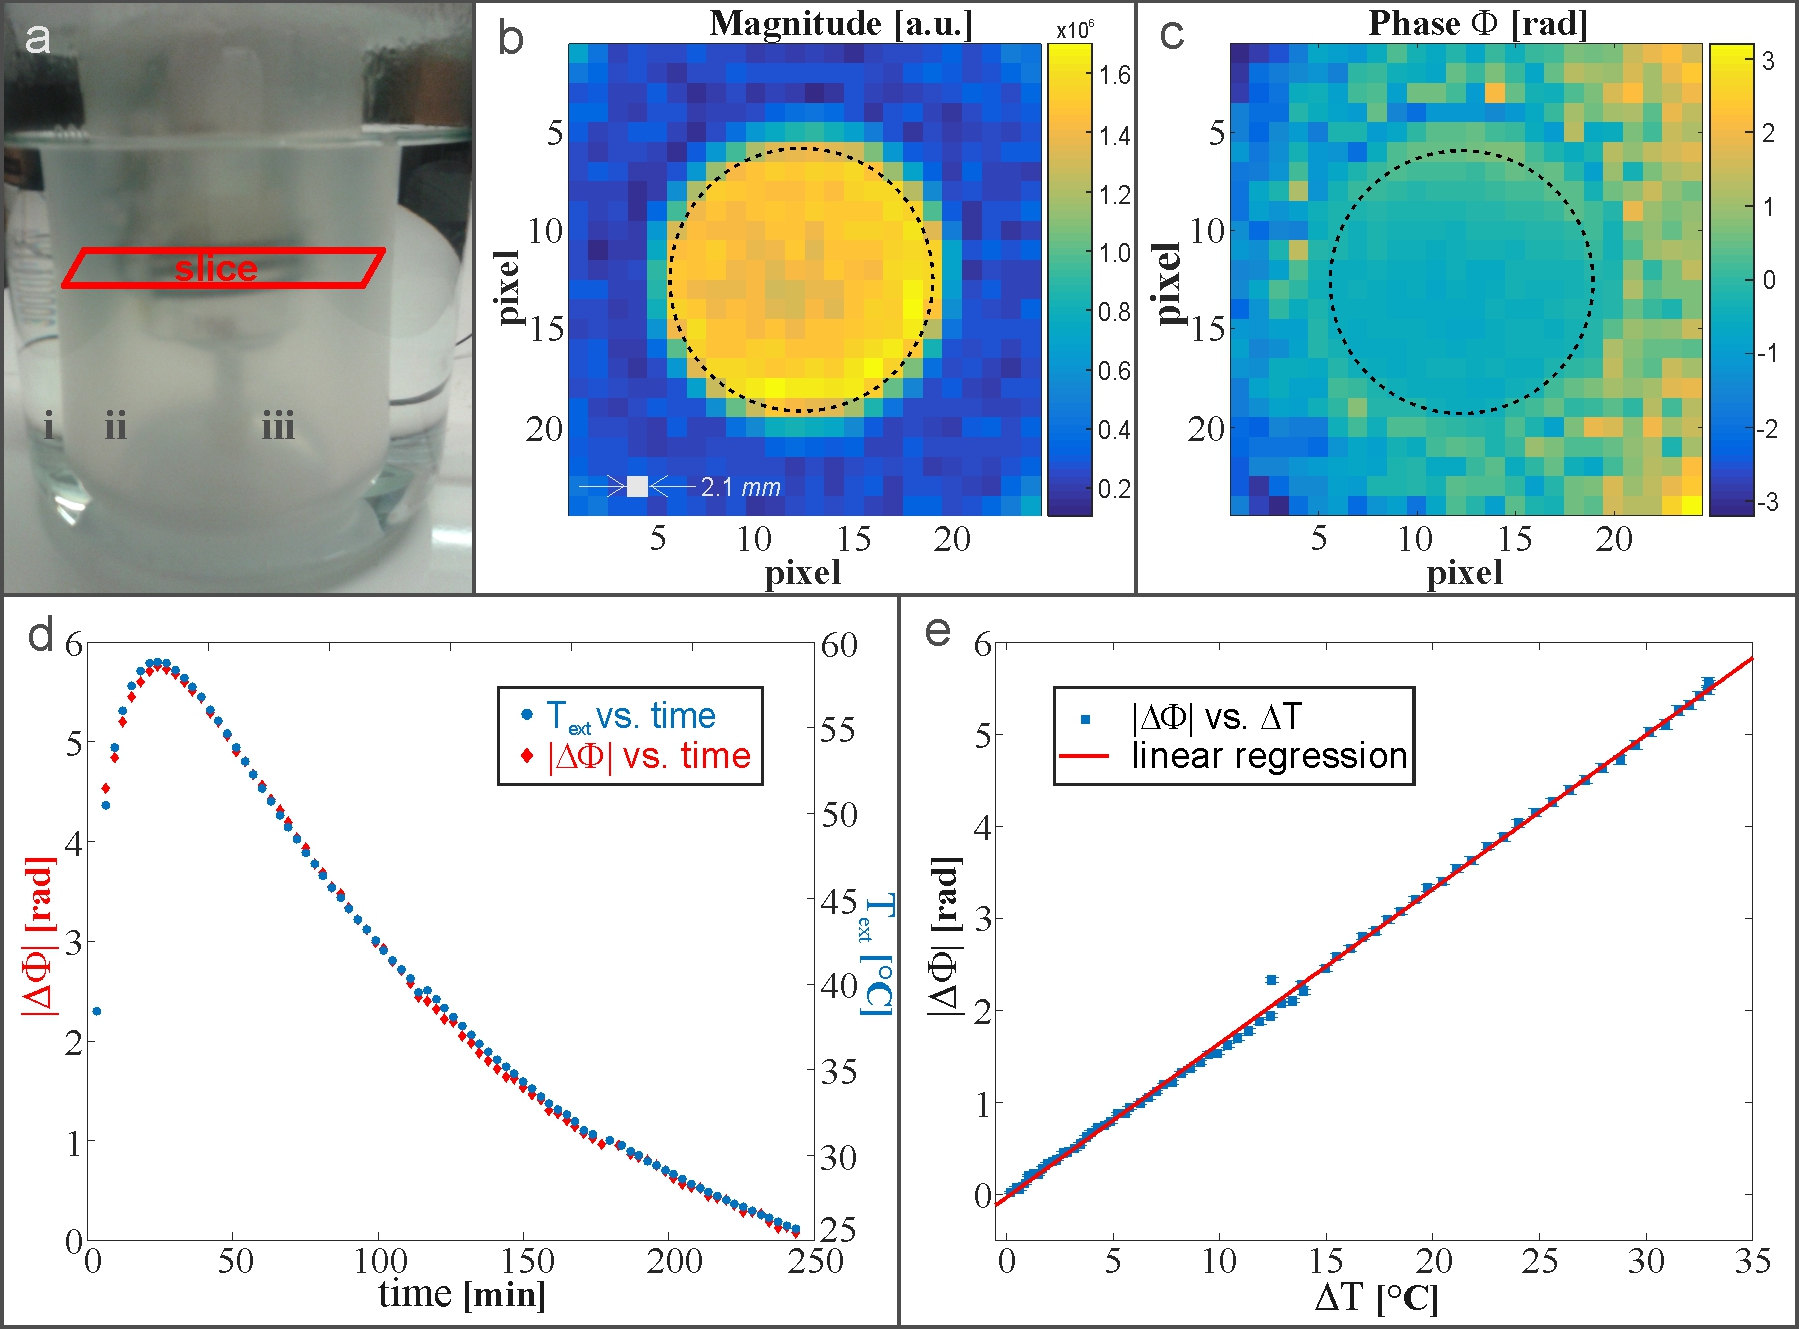
Repeated imaging of the phase in a slice through the syringe (Fig.3(a-c)) leads to the comparison of phase shift data ΔΦ and temperature change ΔText over time (Fig.3(d)). Both data sets refer to the baseline phase map at known temperature. The agreement of the respective graphs is reflected in the linearity of the graph ΔΦ versus ΔText (Fig.3(e)). Linear regression yields a FRF-thermal coefficient $$$\alpha_{C_{4}F_{8}}=\small-(0.0634 \pm 0.0030)\frac{ppm}{°C}$$$.
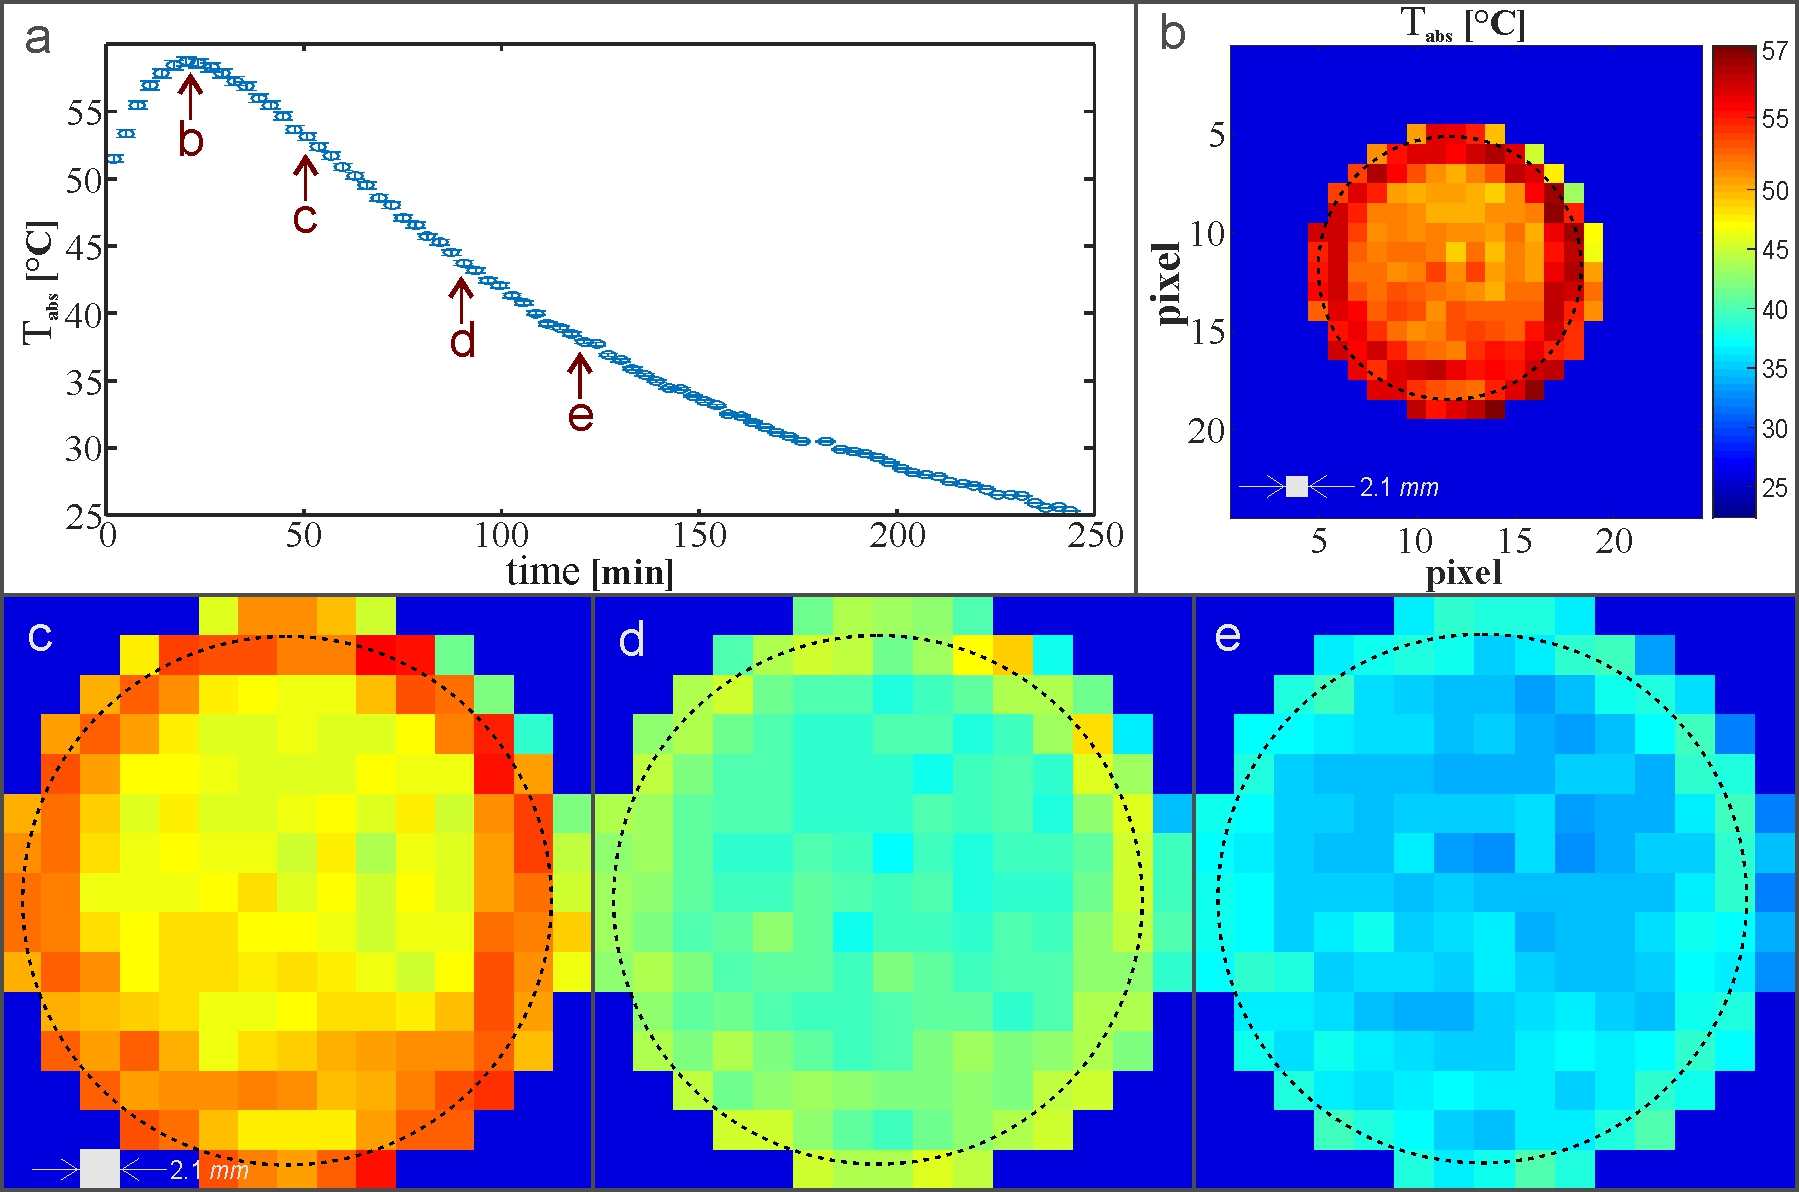
The validation of $$$\alpha_{C4F8}$$$ allowed for the translation of phase contrast data to absolute temperature values (Fig.4(a)). Pixel wise reconstruction led to temperature maps throughout the cool down process (Fig.4(b-e)).
Spectroscopic investigations of C3HF7 showed the same FRFS temperature feedback. However, experiments on CH2FCF3 yielded no such sensitivity due to differing intramolecular deshielding effects.
Discussion
The results confirm the possibility of gas temperature mapping using the fluorinated contrast gas C4F8. Relatively low signal intensity was compensated by high number of averages. The short T2*=9.1±0.1ms was alleviated by rapid spiral acquisition.
Partial volume effects may be reduced by higher resolution, e.g. by using more spiral interleaves. Temperature fluctuations are related to thermal fluctuations or low image SNR; improved coils may help.
In conclusion, this proof of concept study showed the applicability of phase contrast FRFS methods for 19F gas temperature mapping. In combination with gas flow measurements this may lead to understanding of chronic respiratory diseases.
Acknowledgements
The authors wish to thank Guido Kudielka and Pekka Sipilae for their fruitful input on the design of the MR probehead.References
1. Couch MJ, Ball IK, Li T, et al. Inert fluorinated gas MRI: a new pulmonary imaging modality. NMR in Biomedicine. 2014;27(12):1525-1534.
2. Lebihan D, Delannoy J, Levin RL. Temperature mapping with MR imaging of molecular diffusion: application to hyperthermia. Radiology. 1989;171(3):853-7.
3. Rieke V, Butts Pauly K. MR thermometry. J Magn Reson Imaging. 2008;27(2):376–390.
4. Petrakis L, Bernstein HJ. Medium effects in NMR. III. Fluorine resonance in gases. IEEE Transactions on Medical Imaging. 1963;38(7):1562-1568.
5. Mohanty S, Bernstein HJ. Temperature and pressure dependence of the chemical shift of gases. Chemical Physics Letters.1970;4(9):575-576.
6. Mohanty S, Bernstein HJ. Medium effects in NMR. VIII. Temperature and Pressure Dependence of 19F Chemical Shifts in Pure CF4, SiF4, and SF6 Gases and in Gaseous Mixtures. The Journal of Chemical Physics. 1971;54(5):2254-2264.
Figures