5077
A T2 Template Map from a Healthy Cohort to Identify Localized Anomalies in Single Subjects1Advanced Clinical Imaging Technology, Siemens Healthcare AG, Lausanne, Switzerland, 2Department of Radiology, University Hospital (CHUV), Lausanne, Switzerland, 3LTS5, École Polytechnique Fédérale de Lausanne, Lausanne, Switzerland, 4Neuroimmunology Unit, Neurology, Department of Clinical Neurosciences, Centre Hospitalier Universitaire Vaudois (CHUV) and University of Lausanne (UNIL), Lausanne, Switzerland, 5Martinos Center for Biomedical Imaging, Massachusetts General Hospital and Harvard Medical School, Boston, MA, United States, 6Center for Advanced Imaging, the University of Queensland, Brisbane, Australia, 7Siemens Healthcare Pty Ltd, Brisbane, Australia, 8German Center for Neurodegenerative Diseases, Bonn, Germany, 9Siemens Medical Solutions USA, Inc., Boston, MA, United States
Synopsis
We construct a database of normal T2 values by spatially normalizing quantitative maps from healthy subjects into a common space. A low standard deviation across all subjects demonstrates good reproducibility of the T2 values in white matter and deep grey matter. Additionally we adopt a standard voxel-based procedure that compares the quantitative T2 map of a patient to the database and test it on three multiple sclerosis datasets. The obtained z-score maps show that white matter lesions can be detected in the limits of the available resolution and the applied smoothing.
Purpose
Quantitative MRI (qMRI) provides a direct measure of physiological and pathological brain tissue properties1. In particular, transverse relaxation (T2) has been shown to be sensitive to intra- and extracellular water accumulation (i.e. gliosis and oedema) and myelin loss2,3,4,5. Only recently, fast relaxometry techniques have been established enabling their clinical use. However, to exploit the full clinical value of qMRI, databases of normative quantitative values in healthy tissue are required, which will enable the direct comparison of a given patient measurement to a healthy cohort. Here, we establish a database of 36 healthy subject T2 maps and adopt a widely used methodology (i.e. voxel-based significance testing) to perform the comparison between pathological brain tissue in a patient and healthy brain tissue in the atlas.Methods
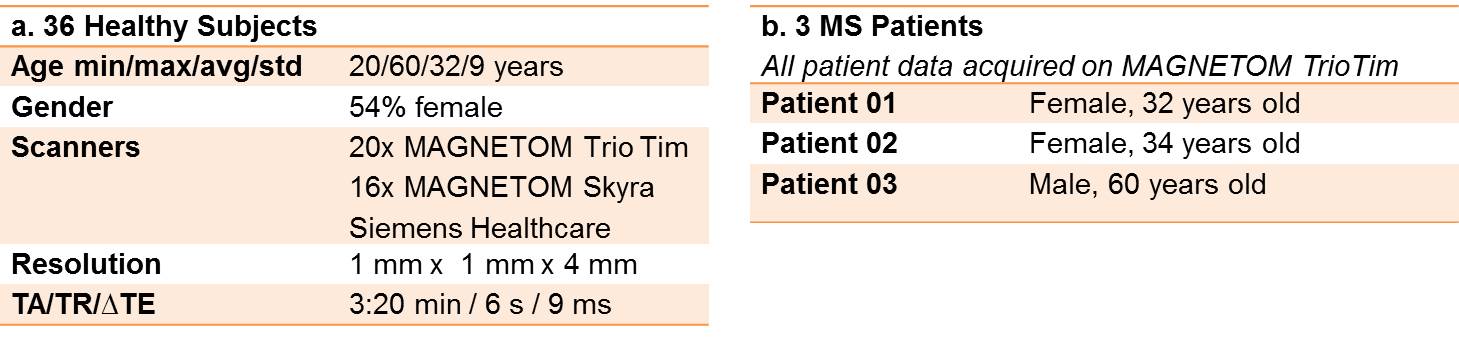
The T2 maps of 36 healthy subjects (HS) were acquired at 3T from two different scanners (Magnetom Skyra and Tim Trio, Siemens, Erlangen, Germany) and reconstructed using a 5-fold undersampled prototype sequence that uses an iterative model-based reconstruction to estimate T25 (c.f. Table 1 for details on acquisition and subject/patient cohorts). The HS T2 maps were spatially normalized to MNI space using the DARTEL tools of SPM126. Each T2 map was visually inspected to ensure that the spatial normalization was correct. The mean T2 value and standard deviation across all HS in the database were calculated to evaluate the reproducibility of T2 values in different brain regions.
In order to demonstrate the comparison of a single subject to the database of HS T2 maps, data of three patients with early-stage relapsing-remitting multiple sclerosis (MS) were acquired (Table 1.b.) as part of a larger ethics-cleared study, and spatially normalized to the MNI space using the same spatial normalization procedure.
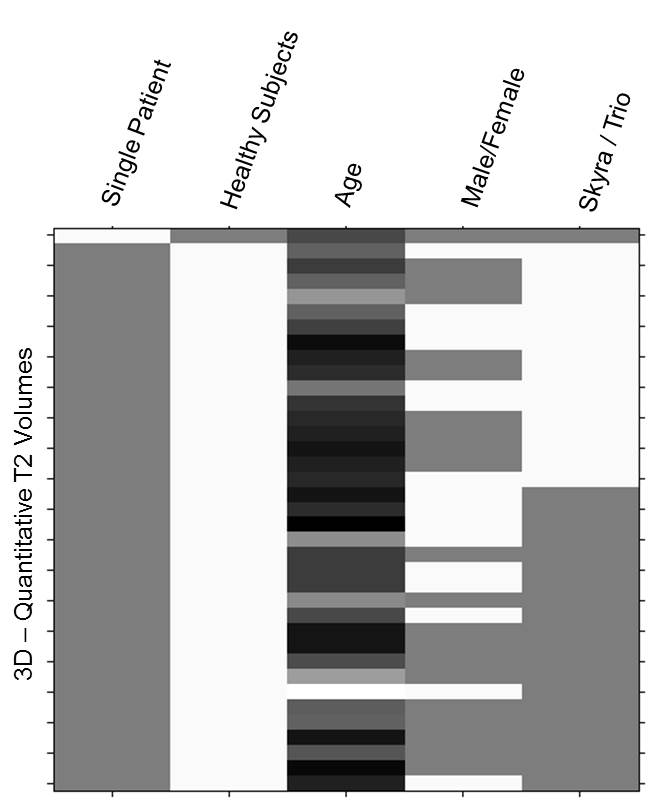
Before comparison, the patient and HS data were smoothed in MNI space with a Gaussian kernel (1.5mm x 1.5mm x 1.5mm FWHM) to increase statistical power and avoid aliasing due to the resampling after registration. A two-sample t-test was performed using age, gender and employed MR scanner as covariates. The design matrix generated from SPM12 is shown in Figure 1. The resulting T-Maps were converted into Z-score maps and overlaid on the patient’s T2 map in MNI space.
Results and Discussion
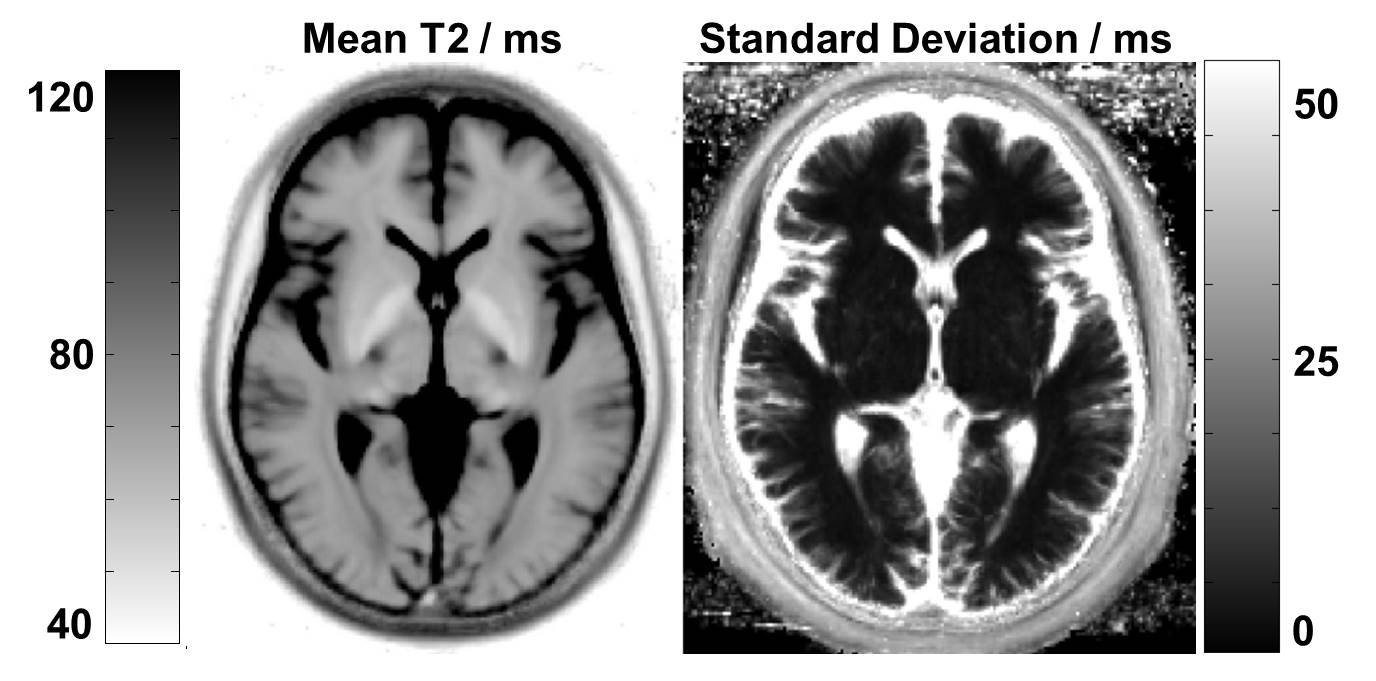
The mean and standard deviation of T2 relaxation times across all spatially normalized HS in the database is shown in Figure 2. The standard deviation in deep grey matter and white matter is remarkably low (< ~5 ms). However, the cortex exhibits a fairly high standard deviation (> 50 ms), presumably due to registration errors in conjunction with the high contrast between brain tissue and adjacent CSF. Beside the registration errors, the standard deviation varies due to regional differences of the T2 values. These findings indicate that the comparison will perform best in white and deep grey matter. No significant age-, gender- or scanner-induced effects were observed in the atlas; this may be due to the relatively small sample size and age range of the HS that do not allow to fully model these effects.
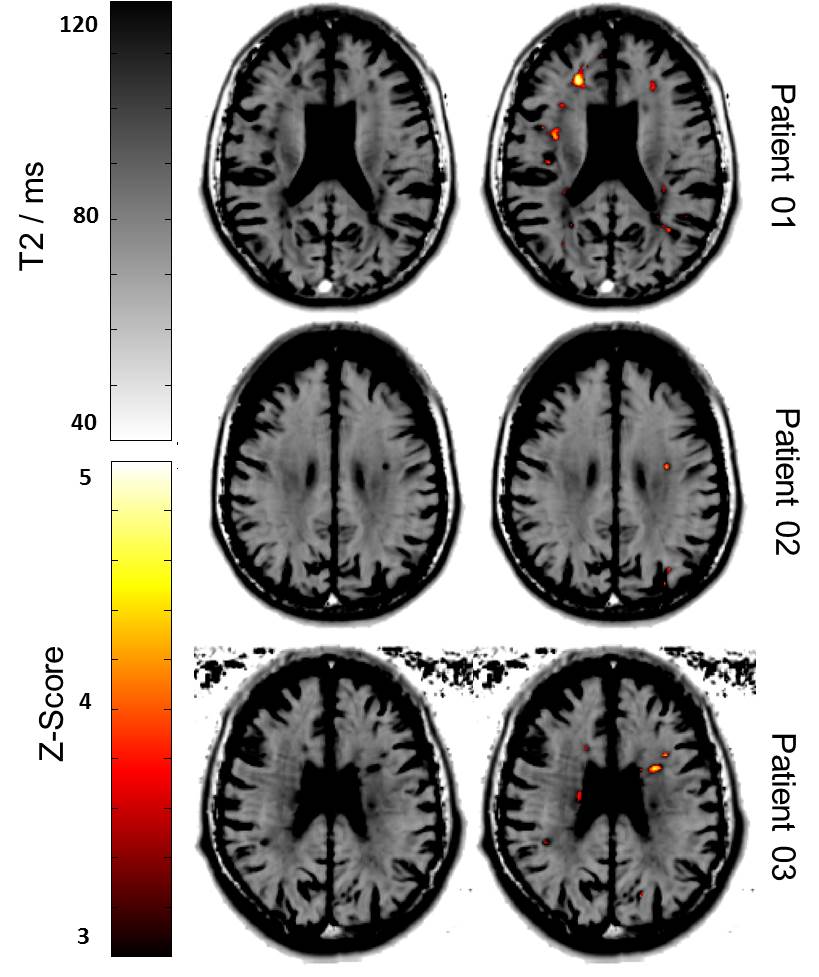
Figure 3 shows the T2 maps of all patients in MNI space and the same map overlaid with the Z-score map obtained from the exemplary comparison indicating significant differences (Z-score > 3) of the individual patient to the healthy cohort. Several white matter lesions are highlighted in the Z-score maps due to their prolonged T2 values in comparison to normal values. However, some false-positives and false-negatives appear in the Z-score map, which might be caused by the limited image resolution, the applied spatial smoothing or registration errors. In the future, the HS atlas should be extended with more T2 maps from a wider age range to better account for age-related effects. This potentially increases the statistical power and may allow detecting smaller T2 abnormalities such as normal-appearing white matter.
Conclusion
We established and characterized a T2 relaxometry atlas by spatially normalizing T2 maps from healthy subjects into MNI space. This atlas contains T2 values from 36 healthy subjects and exhibits a good inter-subject consistency. Additionally, by using a simple statistical method to compare data obtained from one MS patient to the atlas, we provide evidence that this approach may be useful to provide personalized measures of brain pathology.Acknowledgements
No acknowledgement found.References
1. Damadian R. Tumor detection by nuclear magnetic resonance. Science 1971; 171.3976:1151-1153.2. Margaret Cheng HL, Hai-Ling, Stikov N, Ghugre NR, Wright GA. Practical medical applications of quantitative MR relaxometry. J Magn Reson Im 2012;36:805-824.
3. Bonnier G, Roche A, Romascano D, Simioni S, Meskaldji D, Rotzinger D, Lin YC, Menegaz G, Schluep M, Du Pasquier R, Sumpf TJ, Frahm J, Thiran JP, Krueger G, Granziera C. Advanced MRI unravels the nature of tissue alterations in early multiple sclerosis. Ann Clin T Neurol 2014;1:423-432.
4. Deoni, S. C. (2010). Quantitative relaxometry of the brain. Topics in magnetic resonance imaging: TMRI, 21(2), 101.
5. Laule, C., Vavasour, I. M., Moore, G. R. W., Oger, J., Li, D. K. B., Paty, D. W., & MacKay, A. L. (2004). Water content and myelin water fraction in multiple sclerosis. Journal of neurology, 251(3), 284-293.
6. Sumpf TJ, Uecker M, Boretius S, Frahm J. Model-based nonlinear inverse reconstruction for T2 mapping using highly undersampled spin-echo MRI. J Magn Reson Imag 2011:34:420-428.
7. Ashburner, J., Barnes, G., Chen, C., Daunizeau, J., Flandin, G., Friston, K., Kiebel, S., Kilner, J., Litvak, V., Moran, R. and Penny, W. SPM12 Manual. 2014.
Figures