5073
An alternative to phase image-based Magnetic Resonance Elastography (MRE) using k-space data processing1ICube, University of Strasbourg, CNRS, IHU Strasbourg, Strasbourg, France, 2Wellcome Trust Centre for Neuroimaging, UCL Institute of Neurology, London, United Kingdom
Synopsis
MR Elastography (MRE) requires substantial data processing involving phase image reconstruction, wave enhancement and inverse problem solving. The objective of this study is to propose an alternative reconstruction method based on direct k-space data processing, particularly adapted to applications requiring fast MRE measurements such as the monitoring of elasticity changes. Elastograms are directly reconstructed from raw MR data without prior phase image reconstruction, circumventing thereby the delicate step of phase unwrapping. The k-space MRE method shows promising results by providing elasticity values similar to the ones obtained with conventional MRE in phantoms and in vivo in porcine liver.
Purpose
Magnetic
Resonance Elastography (MRE) requires substantial data processing involving
phase image reconstruction and unwrapping, harmonic analysis through temporal
Fourier transforms and elastogram reconstruction through the resolution of the MRE
inverse problem. In this study, an alternative method is proposed for
accelerating and simplifying the reconstruction of the elastogram for applications
that require fast MRE information, such as the monitoring of elasticity changes
during thermal ablations in interventional radiology1,2.
Methods
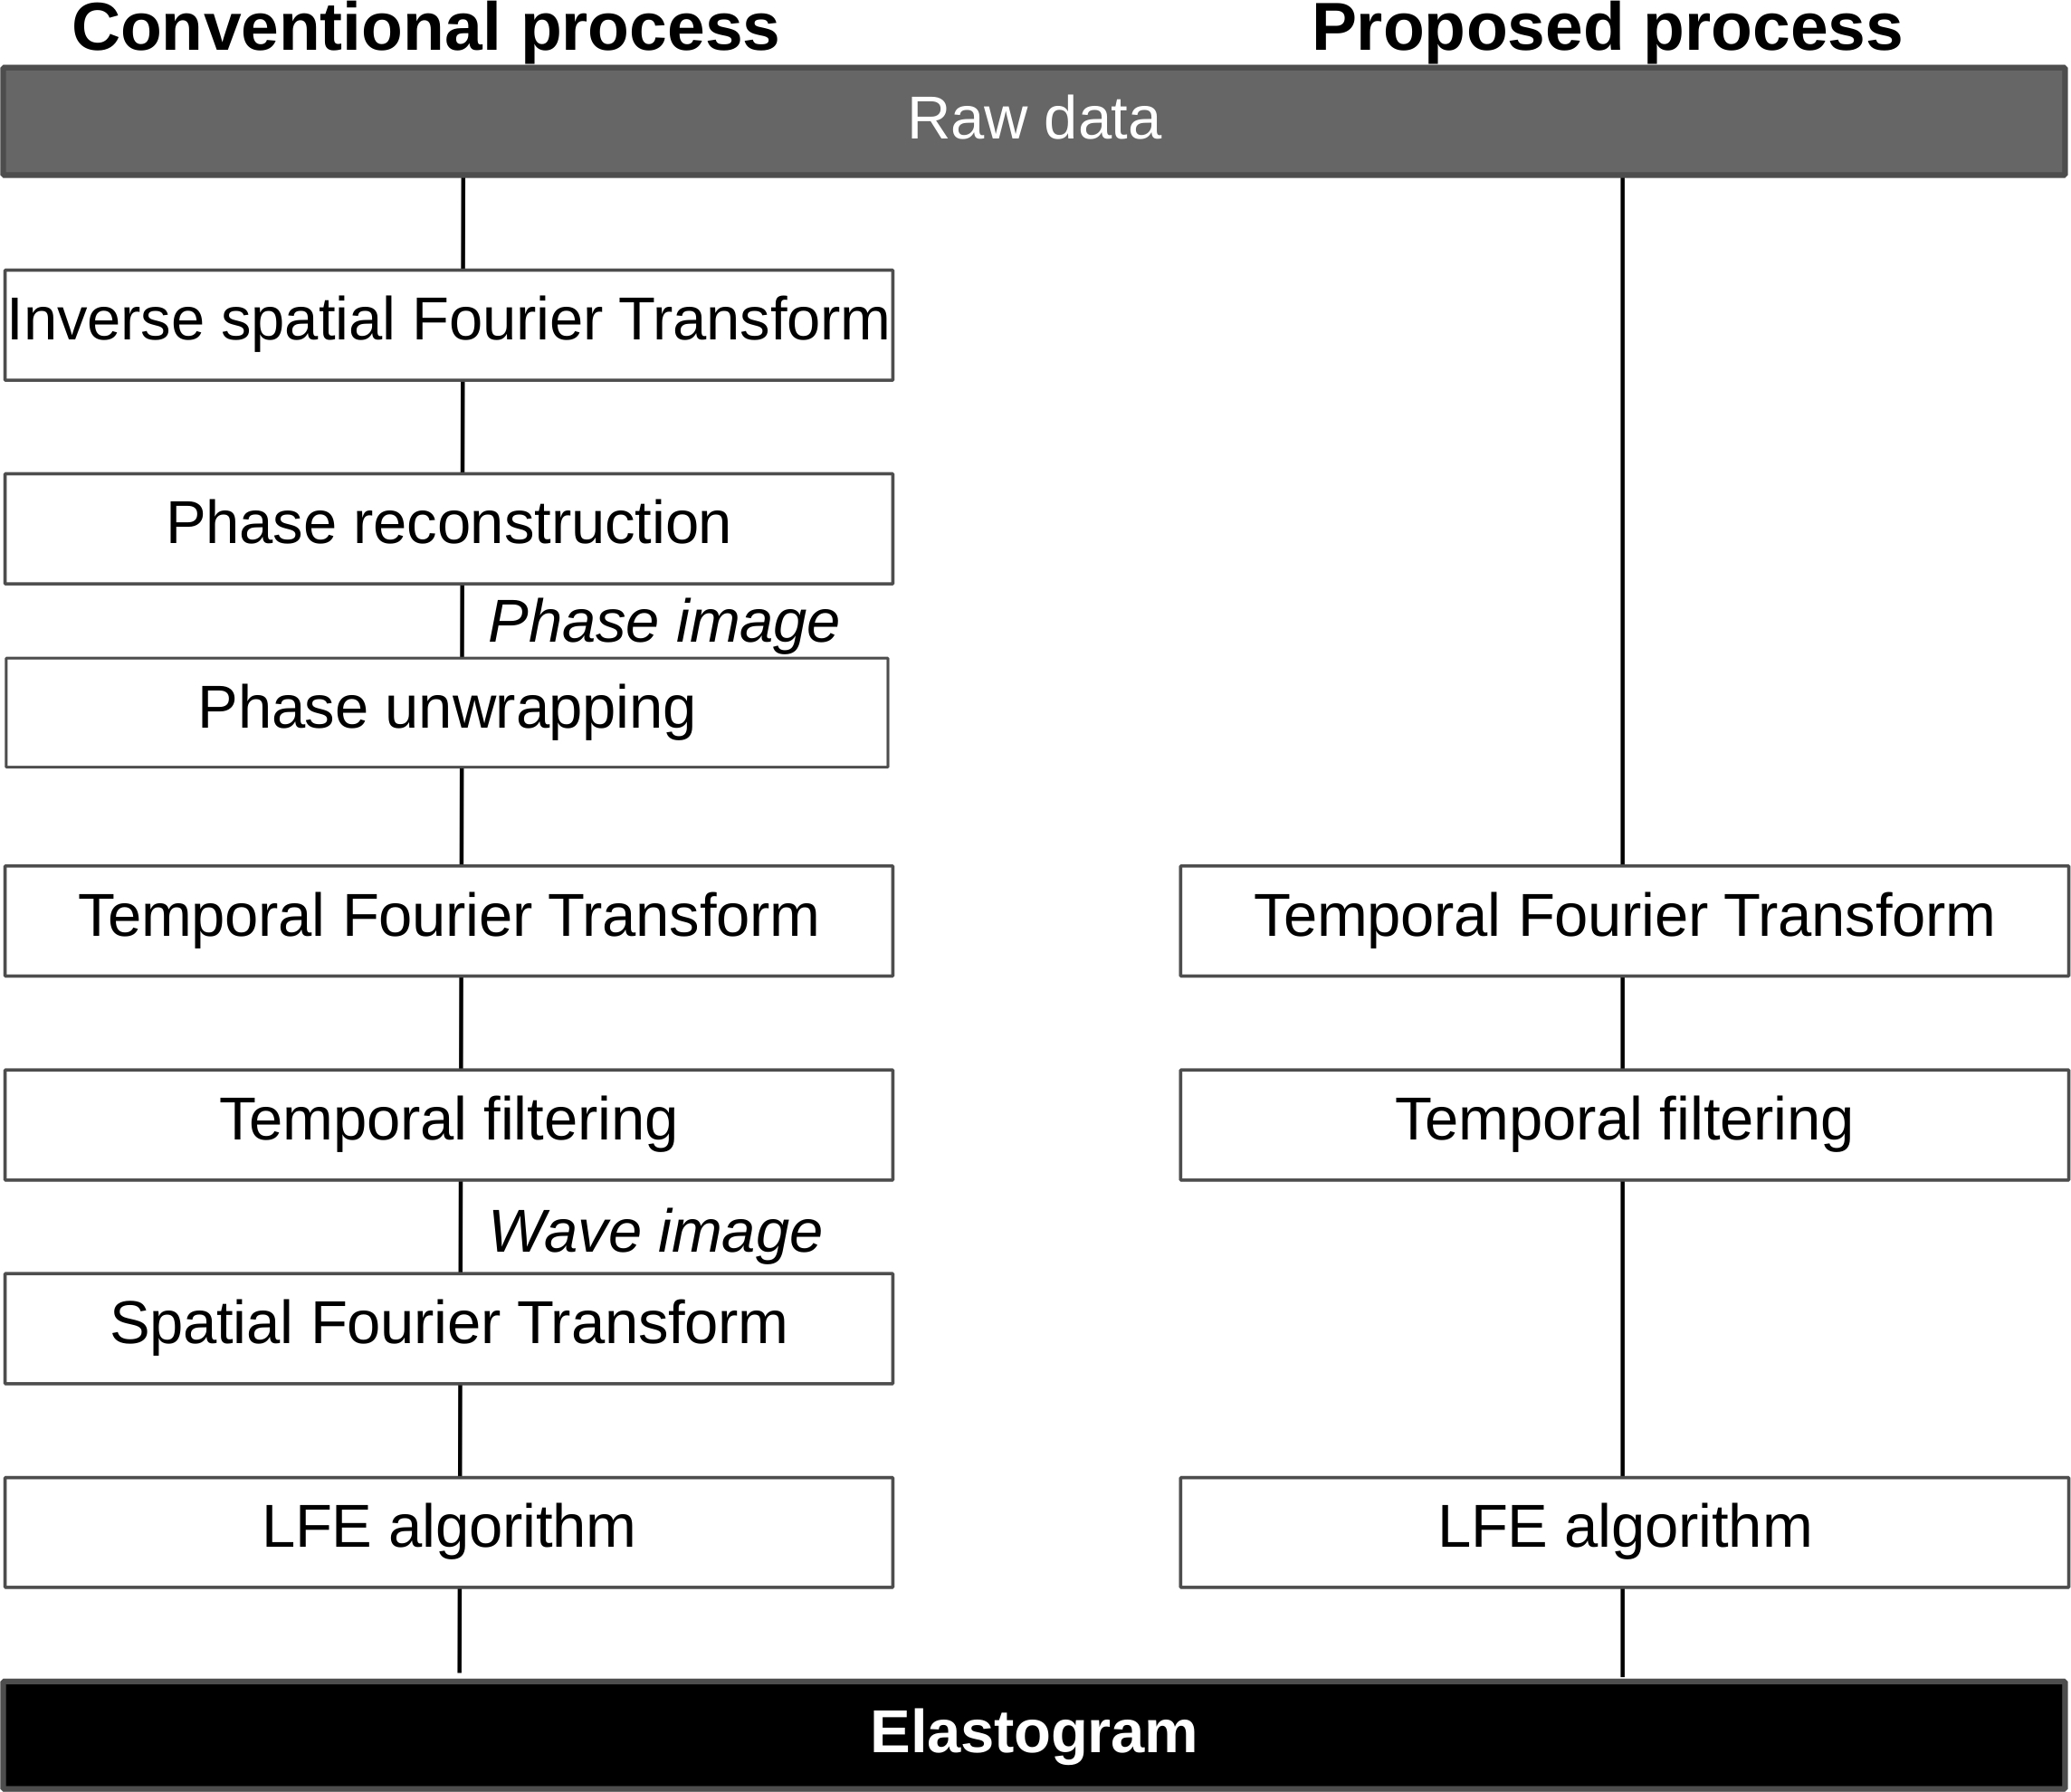
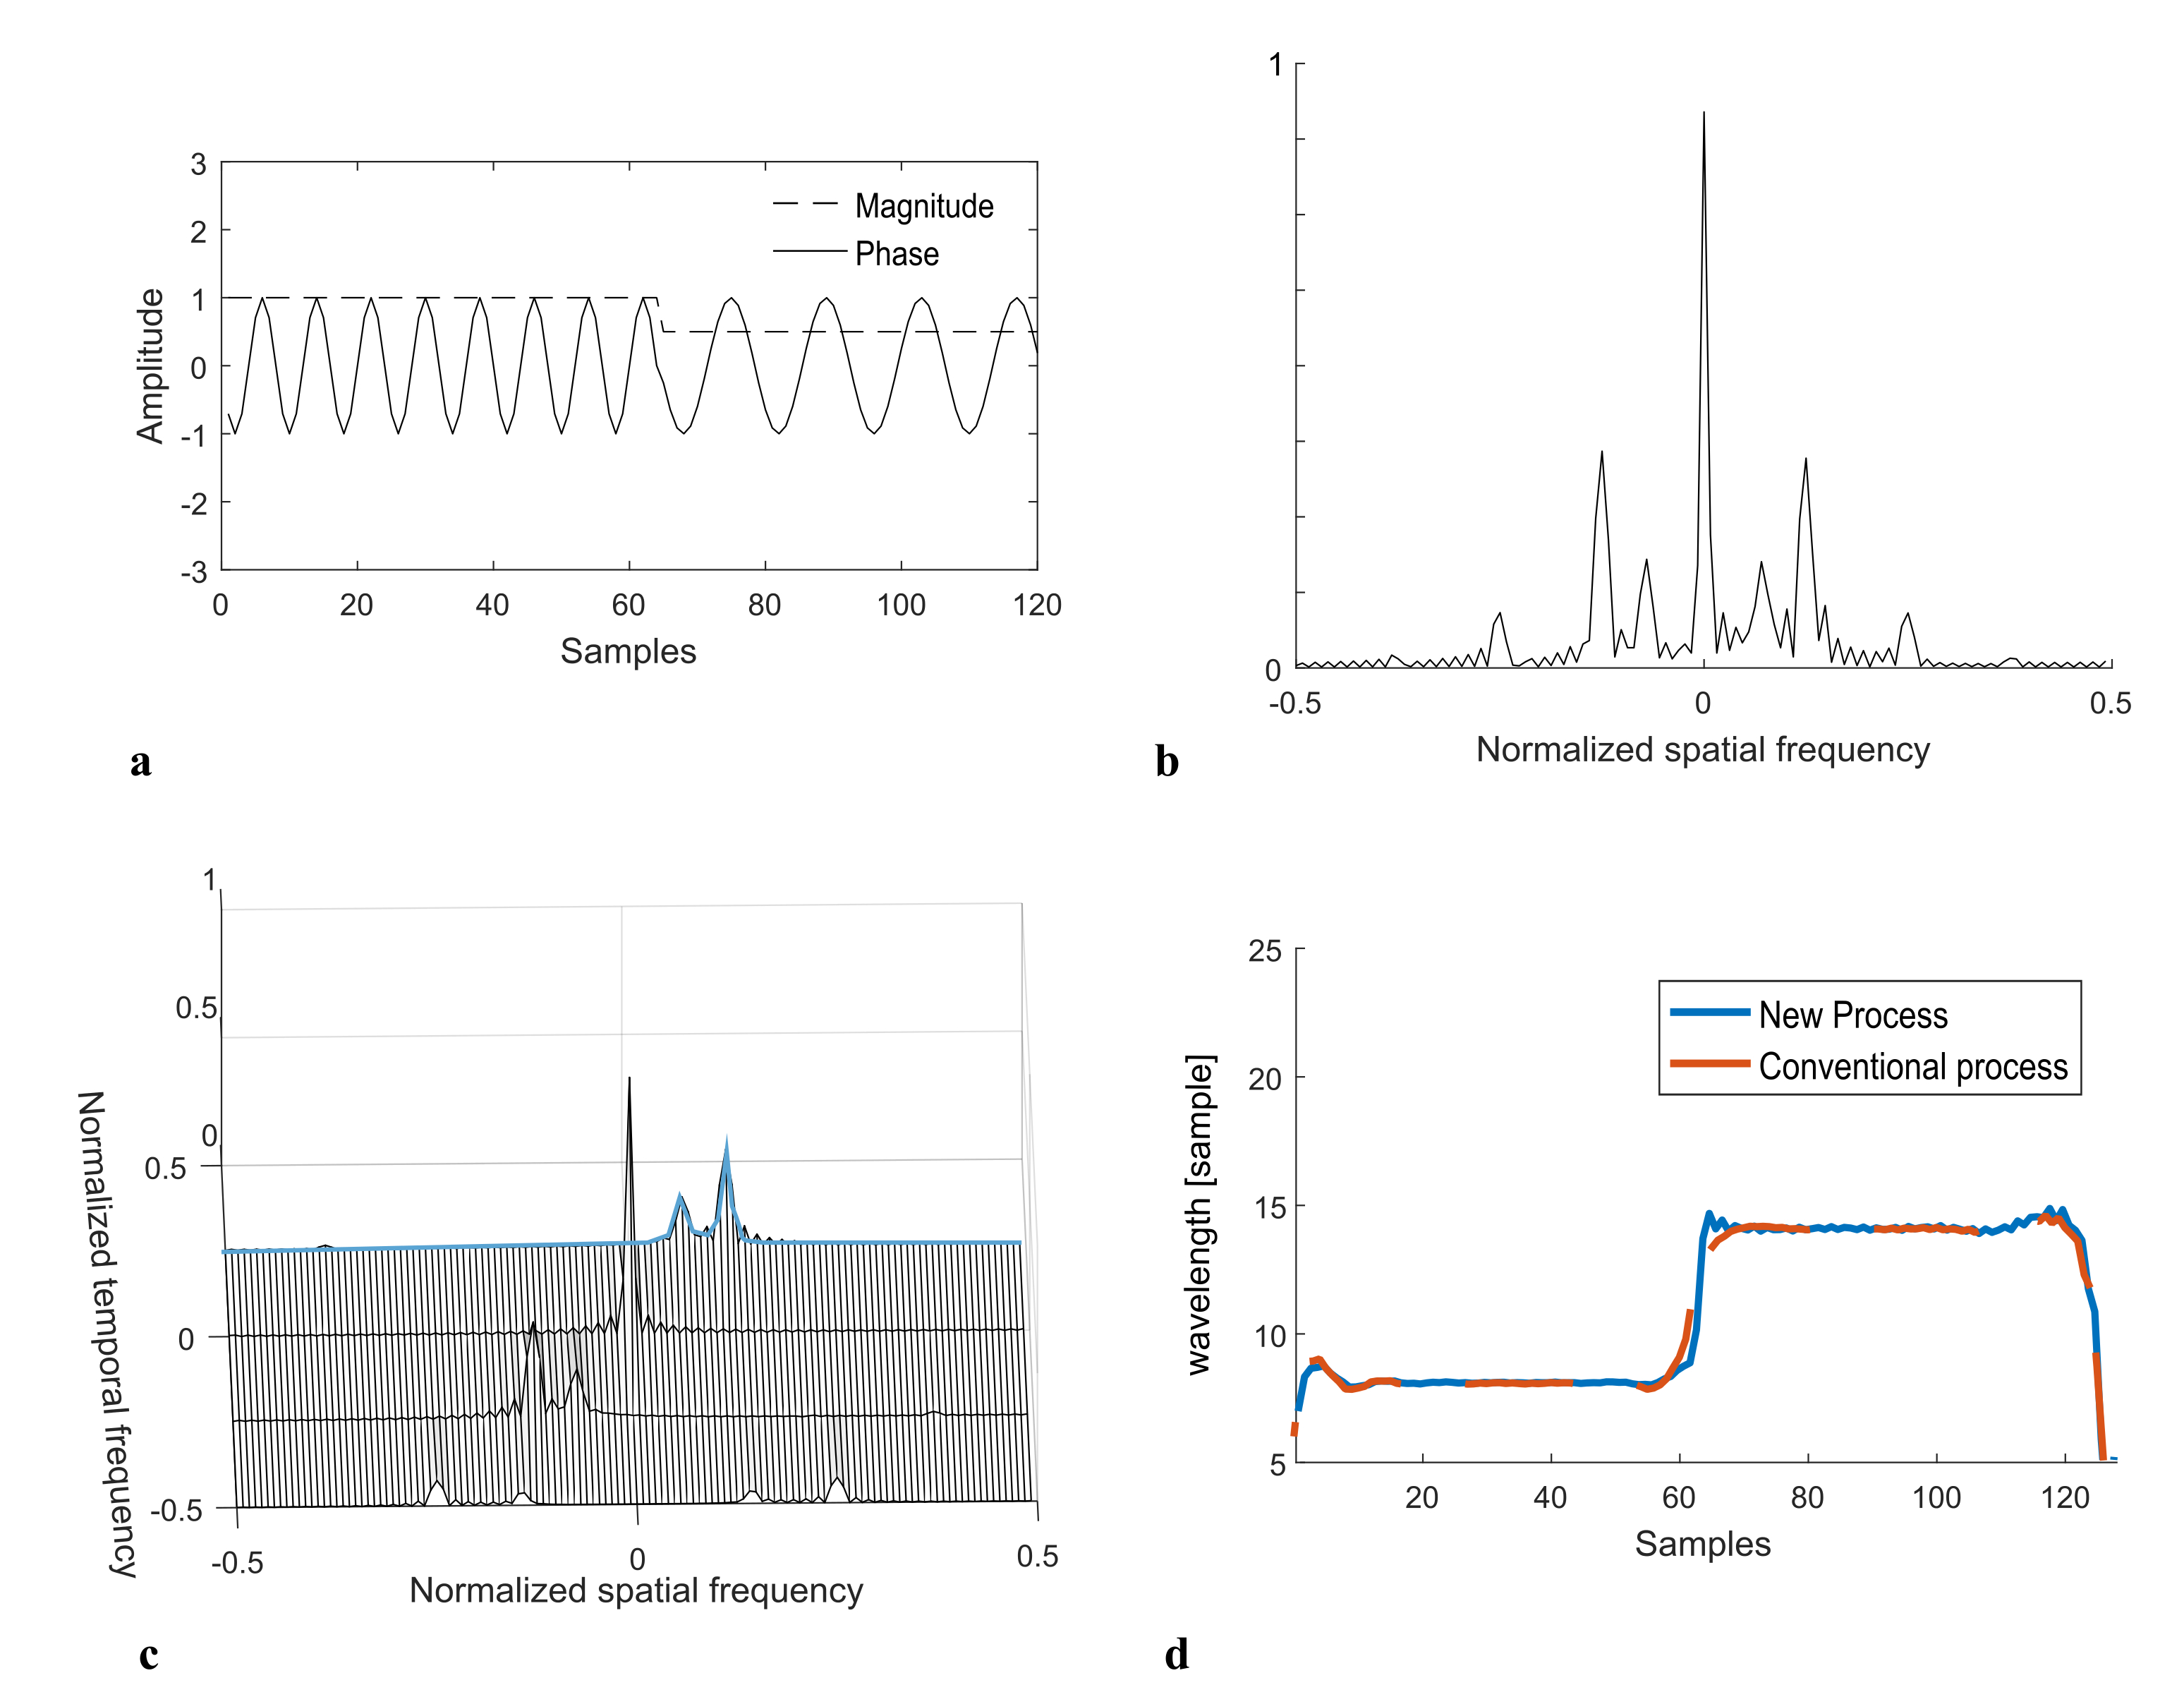
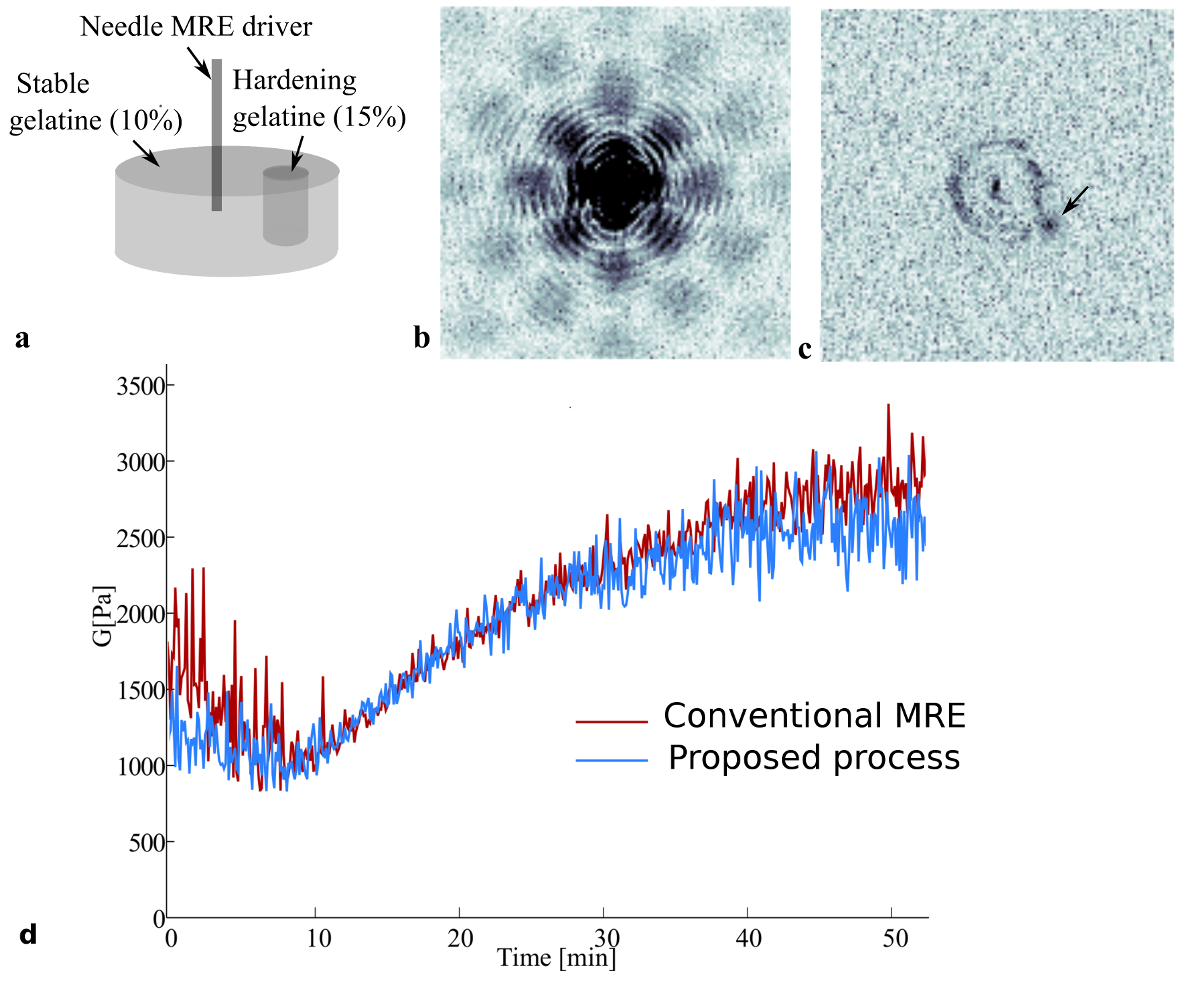
The key feature of the proposed method is that elastograms are reconstructed from k-space MR data, without any need for phase image reconstruction. This allows circumventing several steps such as unwrapping and spatial inverse and forward Fourier transforms. In Fig.1, the typical reconstruction process used in MRE and the proposed method are compared. MRE relies on the encoding of tissue motion in the phase $$$\phi$$$ of the complex MRI signal. The MRE phase shift can be written as: $$$ \phi_s = C_1cos(-\overrightarrow{k}.\overrightarrow{u} + C_2)$$$, where $$$ \overrightarrow{k} $$$ is the wave number, $$$ \overrightarrow{u} $$$ the position vector, $$$ C_1$$$ and $$$ C_2 $$$ are constants related to motion encoding. The k-space signal acquired in MRE experiments can be written (here in 1D for clarity) as: $$ S(\nu_x)=\sum_{x=0}^{N_x-1}M(x)e^{j\phi_0(x)+jC_1(x)cos(-\frac{k_xx}{N_x}+C_2)}e^{-\frac{j2\pi \nu_xx}{N_x}} $$ with $$$ \frac{k_x}{N_x} $$$ being the normalized discrete wave number and $$$ \nu_x $$$ the discrete spatial frequency. It can be shown that the presence of the cosine pattern in the exponential term results in an infinite number of harmonics in the k-space3,4. Figure 2 shows the spectrum of a simulated MRE 1D-signal. The objective of our method is to select only the frequency components of interest. The solution used here is inspired from the harmonic analysis used in conventional MRE, where a temporal Fourier transform is performed on phase images acquired with varying phase shifts between mechanical excitation and motion encoding gradients. In the proposed method, the temporal Fourier transform is directly applied on the k-space data and not on the phase images. Spatial harmonics are thus separated in the frequency domain, allowing to select the spatial components of interest associated to the temporal frequency of interest (Fig.2c). Finally, the Local Frequency Estimation (LFE)5 is performed directly on this filtered k-space data. Experimental feasibility is assessed both in a gelatin phantom (4 and 8%) and in the liver of a porcine model in vivo. In a second phantom, changes in elasticity are monitored in real-time during the solidification of a liquid gelatin inclusion. Experiments were performed at 1.5 T (MAGNETOM Aera, Siemens) with the body coil. Bipolar motion encoding gradients were added in a spoiled gradient echo sequence. 4 (or 3 for phantom 2) phase-offsets evenly spaced across a mechanical period were acquired. Fractional encoding was used with excitation/encoding frequencies set to 120/220 Hz for phantom 1, 40/90Hz in vivo, and 120/90 Hz during the solidification of gelatin. Elastograms are reconstructed with both the direct k-space MRE method and the conventional MRE processing including phase unwrapping.Results
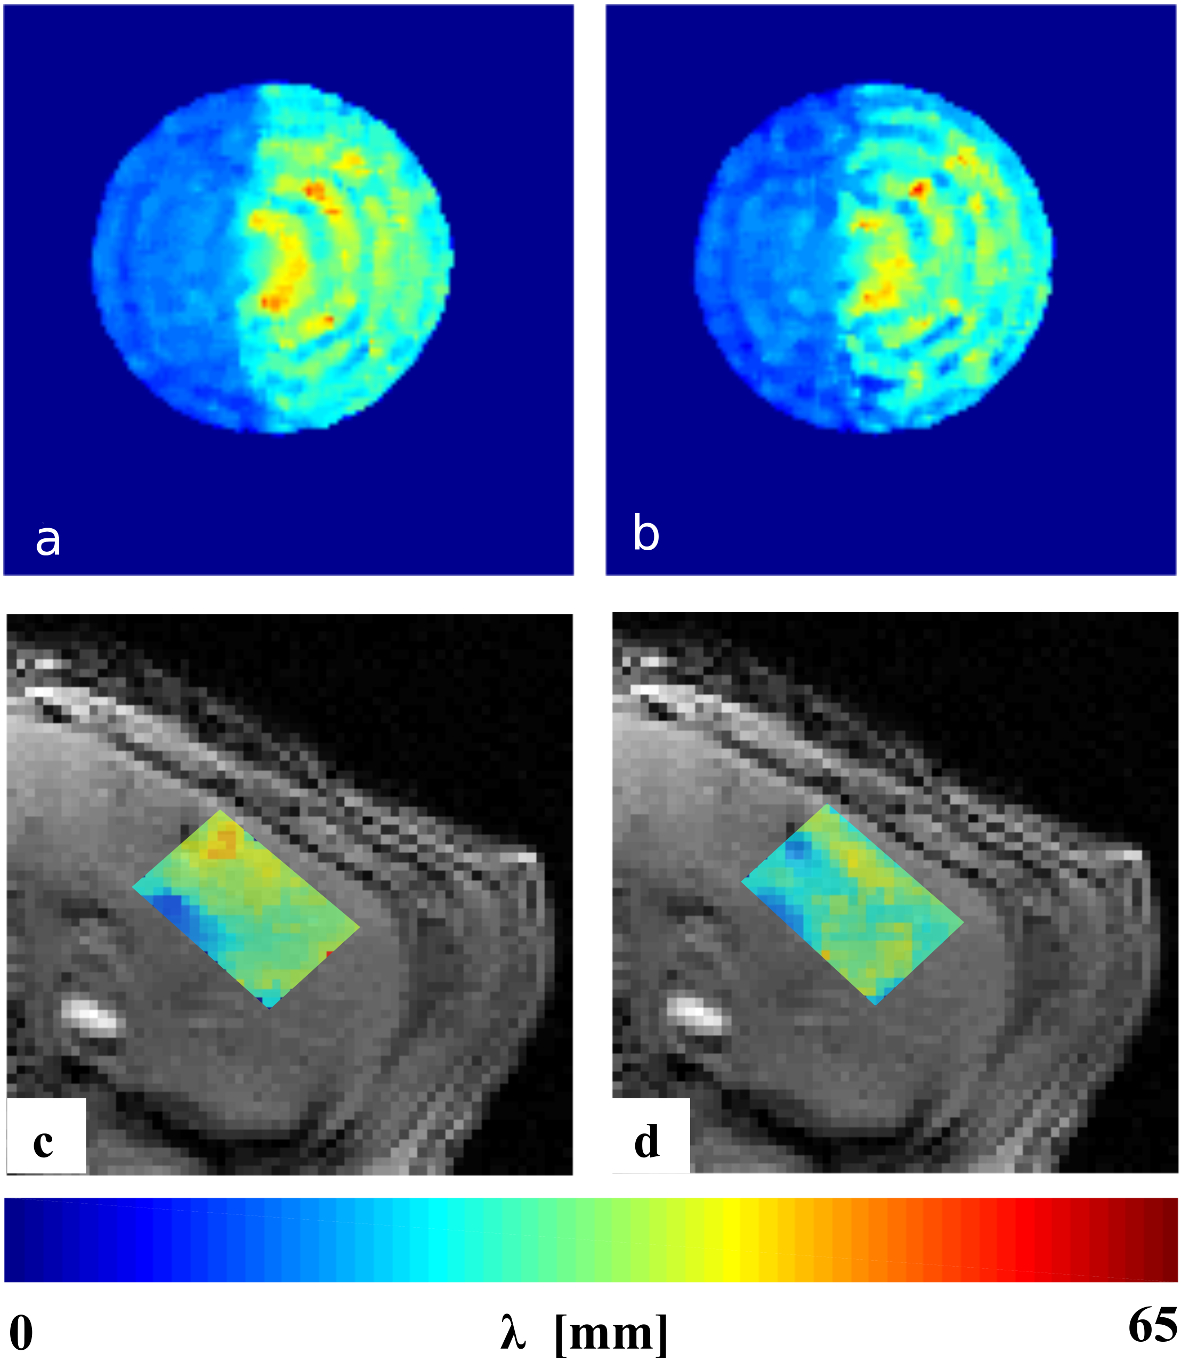
LFE-derived elastograms obtained by both methods are very similar in phantom and in vivo in porcine liver (Fig.3). The local wavelength obtained by the k-space MRE method and conventional MRE in vivo in the liver is equal to 28.45±5.44 mm and 30.50±7.9 mm, respectively. During the solidification of the gelatin, the variation of elasticity estimated with the proposed method is comparable to the reference one (Fig.4).Discussion
The k-space MRE method shows promising results by providing similar elasticity values to the ones obtained with conventional MRE while decreasing the number of processing steps. Since its framework remains in the complex domain, the proposed method offers the advantage of being inherently immune to phase wrapping, a known challenge in MRE6,7. One limitation of this method is that it requires a minimum number of phase offsets (typically 3 to 8 depending on shear wave amplitude) to select correctly the frequency of interest. One must also remain aware that the filtered k-space is convolved by the magnitude spectrum. Although this influence is deemed to be negligible in most cases, high frequencies corresponding to strong magnitude variations in the region of interest may corrupt the filtered k-space data.Conclusion
This study demonstrates the feasibility of directly reconstructing elastograms from k-space data, without prior phase image reconstruction, while circumventing the delicate step of phase unwrapping. Despite its limitations, this method is well suited for applications requiring fast update rate of MRE information, and it may lead to alternative ways of estimating biomechanical properties in the future. Ongoing work focuses on using this method with multi-channel arrays and undersampled k-space raw data.Acknowledgements
This work
was partly funded by the French state funds managed by the ANR (within the
Investissements d’Avenir programme for the Labex CAMI); Grant number:
ANR-11-LABX-0004, and the IHU Strasbourg; Grant number: ANR-10-IAHU-02.
References
1. Chen J, Woodrum DA, Glaser KJ, et al. R Assessment of in vivo laser ablation using MR elastography with an inertial driver. Magn Reson Med. 2014;72:59–67.
2. Corbin N, Vappou J, Breton E, et al. Interventional MR elastography for MRI-guided percutaneous procedures. Magn Reson Med. 2016;75:1110–8.
3. Corbin N, Breton E, Mathelin de M , Vappou J. K-space data processing for magnetic resonance elastography (MRE). Magn Reson Mater Phys Biol Med. 2016; Published online.DOI 10.1007/s10334-016-0594-8
4. Colton D, Kress R (2013) Inverse Acoustic and Electromagnetic Scattering Theory. Springer New York, New York, NY
5. Manduca A, Muthupillai R, Rossman PJ, Greenleaf JF, Ehman RL (1996) Image analysis for magnetic resonance elastography. In: Proceedings of the IEEE International Conference on Engineering in Medicine and Biology Society, Amsterdam, The Netherlands, pp 756-757
6. Barnhill E, Kennedy P, Johnson CL, et al. Real-time 4D phase unwrapping applied to magnetic resonance elastography. Magn Reson Med. 2014;73:2321-31.
7. Wang H, Weaver JB, Perreard II, et al. A three-dimensional quality-guided phase unwrapping method for MR elastography. Phys Med Biol. 2011;56:3935–52.
Figures