5072
Wavelet based Texture Analysis of Liver Fibrosis in Delayed Phase Gadolinium-Enhanced T1-weighted in vivo Images1Electrical and Computer Engineering, University of Arizona, Tucson, AZ, United States, 2College of Optical Sciences, University of Arizona, Tucson, AZ, United States, 3Medical Imaging, University of Arizona, Tucson, AZ, United States, 4Biomedical Engineering, University of Arizona, Tucson, AZ, United States
Synopsis
Non-invasive imaging techniques that can identify early structural changes due to fibrosis in vivo are of high clinical importance. In this work, a five-level wavelet decomposition of biopsy confirmed normal and fibrotic ex vivo liver tissues is performed and histogram-based features are extracted from the wavelet subbands. A linear classifier is trained using the top 10 features and applied to classify liver fibrosis in Gadolinium-enhanced delayed phase T1-weighted in vivo images. The results show that normal samples yield low posterior probabilities for fibrosis whereas these values are very high for fibrotic samples.
Motivation
Non-Alcoholic Fatty Liver Disease (NAFLD) has become the most common chronic liver condition in the Western world. Some of the individuals with NAFLD develop progressive Non-Alcoholic Steatohepatitis (NASH), which is the result of chronic hepatocyte injury with inflammation and resultant progressive hepatic fibrosis. Hepatic fibrosis is characterized by structural changes in the liver due to deposition of collagen in the extra-cellular matrix. Current gold standard in staging liver fibrosis is biopsy, which is invasive and prone to sampling errors. Non-invasive imaging techniques that can identify early structural changes due to fibrosis in vivo are of high clinical importance. Recently, Li et al.1 introduced a wavelet-based technique to study the structural changes associated with fibrosis in formalin fixed ex vivo liver tissues. Additionally, Brand et al.2 have shown that the log of the average radial power spectrum of the formalin fixed ex vivo liver tissue is similar to the delayed phase Gadolinium-enhanced T1-weighted in vivo images, suggesting similarity of the signal characteristics of fibrotic structures in both cases. In this work, we present a technique for training a classifier using biopsy confirmed ex vivo tissue samples to classify liver fibrosis in in vivo Gadolinium-enhanced delayed phase images.Methods
Multiple biopsies were performed on the formalin fixed ex vivo liver tissues to stage fibrosis. Tissues with a METAVIR score of F0/F1 (normal) and F4 (fibrotic) were imaged in a Siemens 3T (Skyra) scanner using the 3D VIBE sequence without parallel imaging. Images were acquired at high (0.35 mm isotropic) and low-resolution (1.08 mm in plane, slice thickness=3mm). The images were normalized to zero mean and unit standard deviation after excluding major vessels. A five-level overcomplete wavelet decomposition was performed. The LL5 subband was excluded, resulting in 15 subbands. Ten features (the mean, root mean square, min, max, skewness, kurtosis, entropy, 50th percentile and two parameters obtained by fitting the data to a generalized Gaussian probability density function) were extracted from the absolute value of the wavelet coefficients using a 11x11 sliding block. A block was discarded from analysis if it encountered an edge of the liver tissue or a vessel. Each pixel can therefore be considered as a vector in the 150-dimensional feature space obtained by combining the features from all wavelet scales. For feature reduction, the top 10 features with minimum probability of error (POE) were sequentially selected such that new features are least correlated with already selected features3. For these features, the corresponding resolutions of their wavelet subbands were recorded. A linear classifier was trained using the top 10 features from the low-resolution image. The classifier achieved an Area Under the Curve (AUC) of 0.926. A total of 82,340 training samples were used. The trained classifier was then applied to two Gadolinium-enhanced T1-weighted in vivo images acquired on the Siemens 3T (Skyra) using the 3D VIBE sequence (TR/TE/$$$\alpha$$$=3.61ms/1.47ms/9°, 1.08 mm in plane, slice thickness=3mm, no parallel imaging). These images were previously categorized as normal and fibrotic by radiologists.Results and Discussion
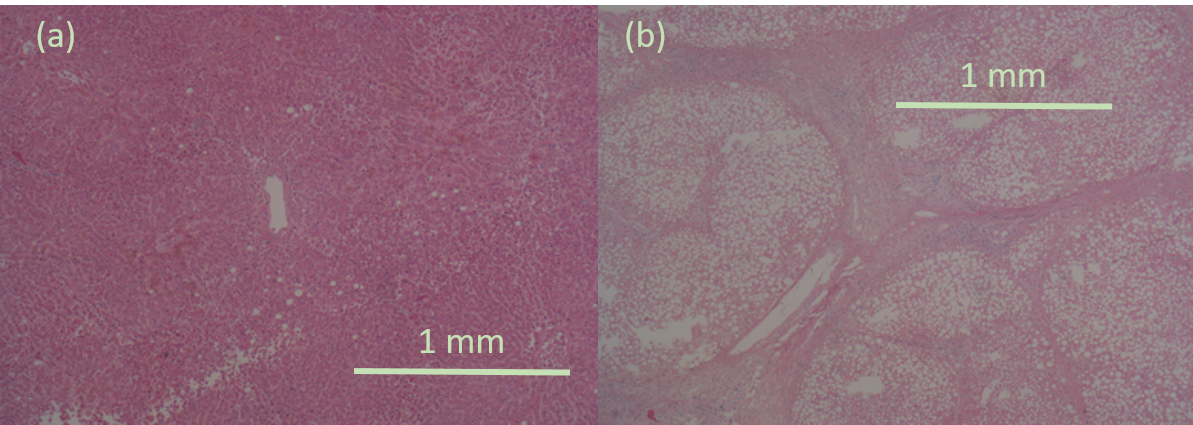
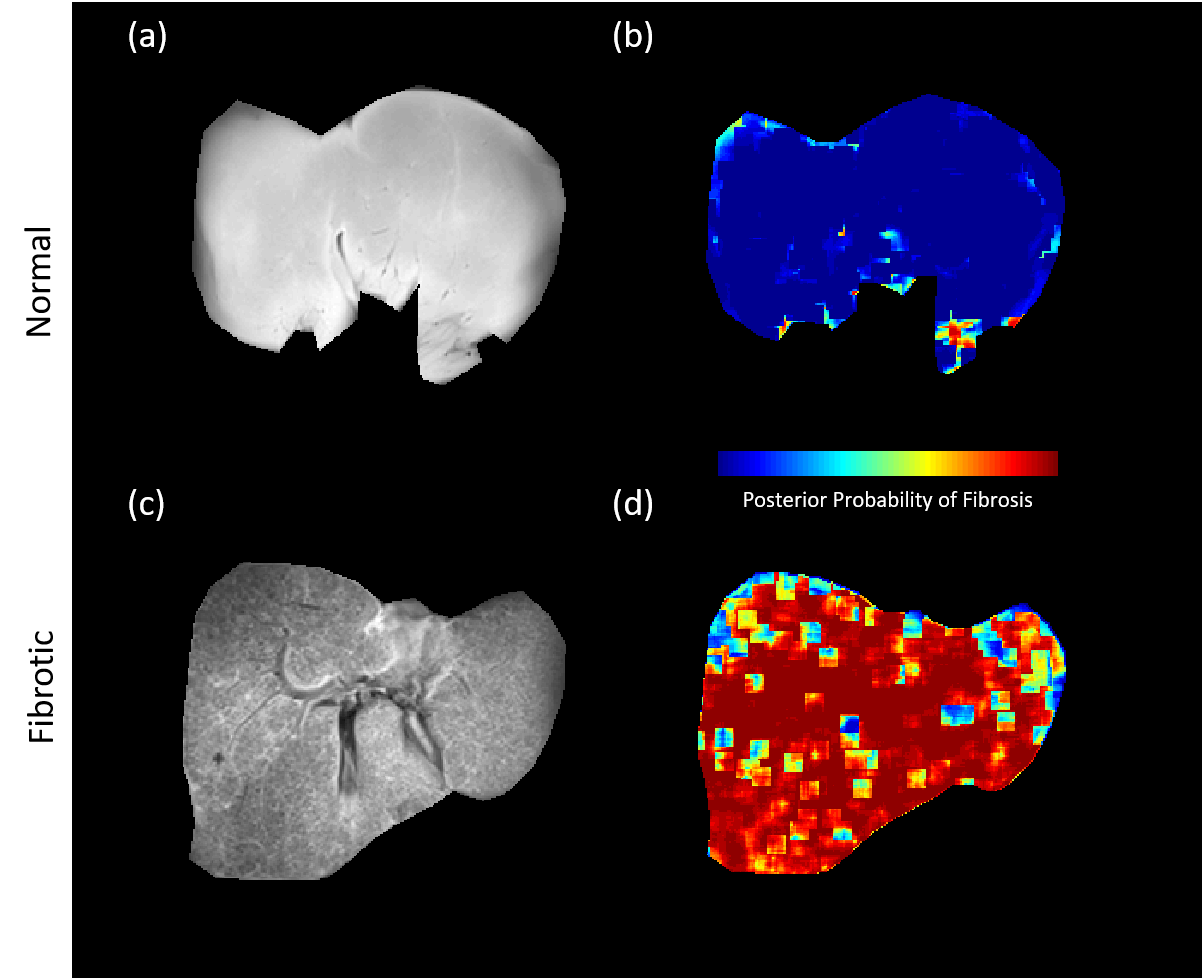
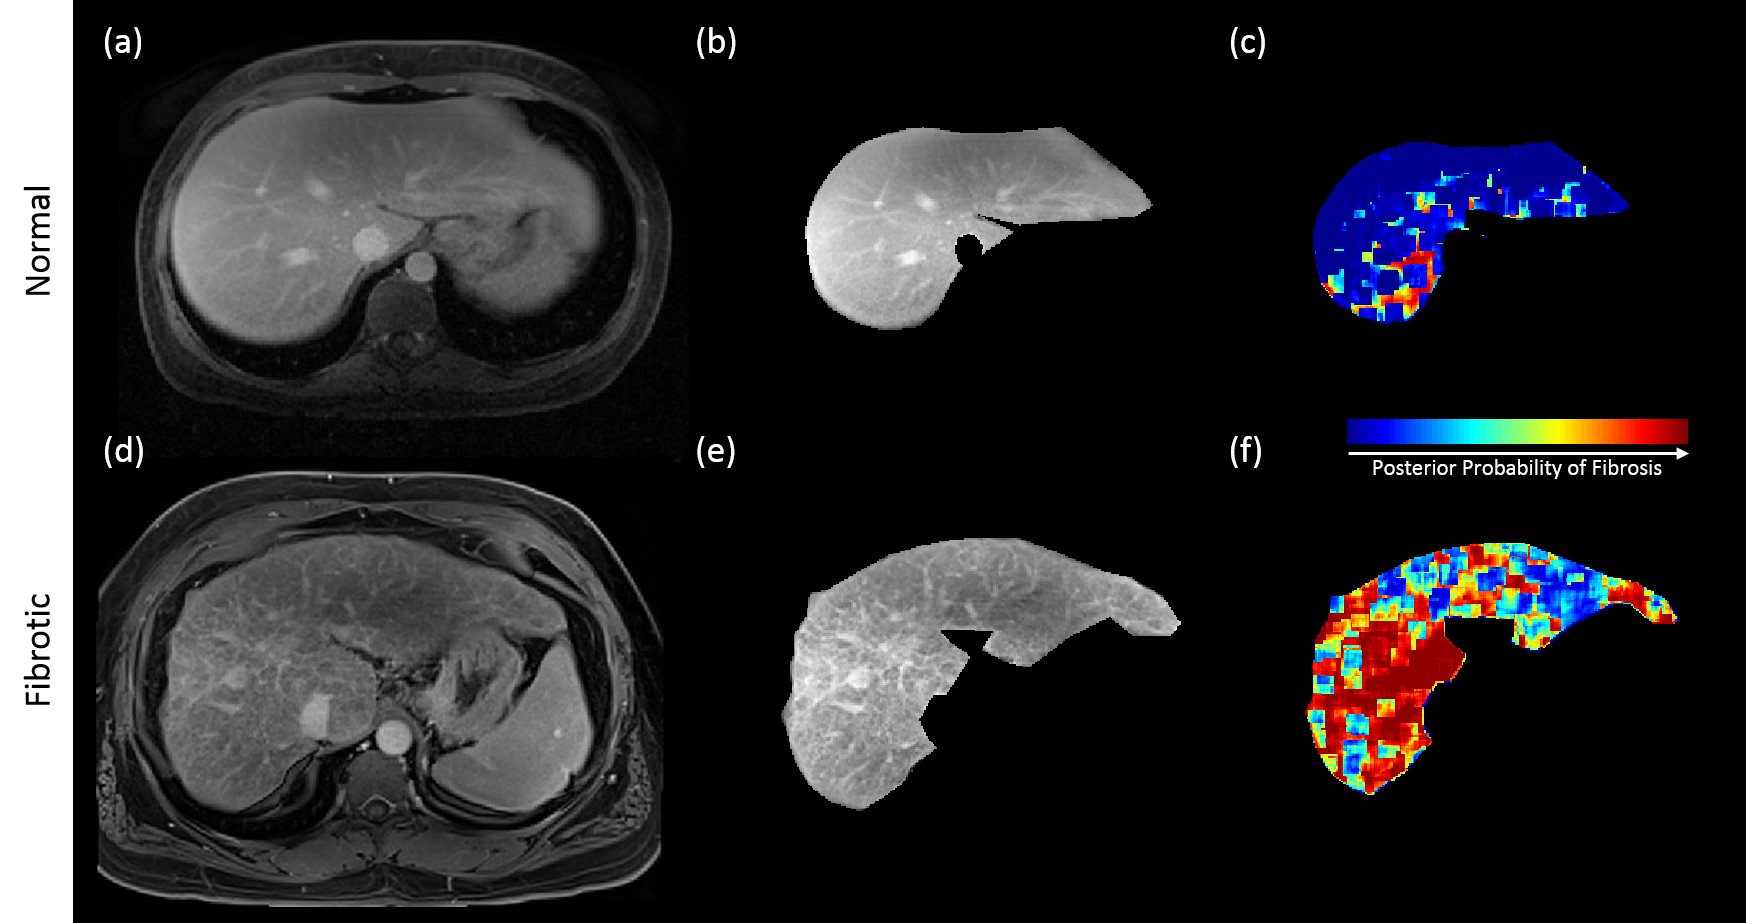
It was observed that most of the selected features from the high-resolution images were from subbands at the third decomposition level, which roughly corresponds to 1.5mm spatial resolution. For the low-resolution image, the selected features were from first-level subbands roughly corresponding to 1mm spatial resolution. This is consistent with histological findings indicating that some of the structures associated with fibrosis are above 1mm scale (see Figure 1). This encouraging result suggests that classifiers could be trained using biopsy-confirmed ex vivo tissue samples and used on in vivo Gadolinium-enhanced delayed phase T1-weighted images obtained at clinically feasible resolutions. Figure 2 shows the results obtained by applying the classifier on two ex vivo samples. It can be seen that the normal sample yields fairly low posterior probabilities for fibrosis whereas the posterior probabilities are very high for the fibrotic sample. Figure 3 illustrates the results obtained by applying the classifier (trained on ex vivo data) on delayed phase Gadolinium-enhanced T1-weighted in vivo images. The results are consistent with the ex vivo results showing mostly low probability of fibrosis in the normal sample and high probability of fibrosis in the fibrotic sample. Note that the high probabilities in the normal sample were isolated to regions around vessels.Conclusion
A method for training a classifier using biopsy confirmed ex vivo tissue samples to classify liver fibrosis in Gadolinium-enhanced delayed phase in vivo images was presented. Results show that it is possible to detect fibrosis at clinically feasible image resolutions using the proposed method.Acknowledgements
Arizona Biomedical Research Commission (ADHS14-082996)References
1. Li Z, Bilgin A, Galons JP, Sharma P, Martin D, Altbach M. Wavelet Analysis of Liver Fibrosis. proc ISMRM 2014.
2. Brand JF, Furenlid LR, Altbach et al. Task-based optimization of flip angle for fibrosis detection in T1-weighted MRI of liver. Journal of Medical Imaging. 2016
3. Mucciardi AN, Gose EE. A Comparison of Seven Techniques for Choosing Subsets of Pattern Recognition Properties. IEEE Transactions Computers. 1971. 20(9):1023-1031
Figures