5066
A supervised automated segmentation strategy for renal DCE-MR images1Academy for Advanced Interdisciplinary Studies, Peking University, Beijing, People's Republic of China, 2Department of Radiology, University of Cambridge, United Kingdom, 3College of Engineering, Peking University, Beijing, People's Republic of China, 4Department of Radiology, Peking University First Hospital, Beijing, People's Republic of China
Synopsis
A supervised DCE-MR images classification strategy is proposed in this study. First, the training set was obtained by an automated seeds extraction procedure. Subsequently, support vector machine (SVM) and random walk algorithms were employed as two separate classification approaches to achieve image segmentations, respectively. The automated segmentations and a repeated manual segmentation were compared quantitatively with a reference manual segmentation. The average similarity indexes for SVM, random walker and repeated manual segmentation were 0.78, 0.76 and 0.72, respectively. The results indicate that the proposed strategy yield a satisfied similarity with manual segmentation and is more stable than the manual segmentation.
Introduction
Dynamic contrast-enhanced magnetic resonance imaging (DCE-MRI) provides clear view of cortex and the medulla, pelvis of kidney. The quantification of renal cortical and medulla volume has been reported to be meaningful in many clinical situations [1]. However, manual segmentation performed by radiologists are quite time-consuming and fastidious.
Most of renal segmentation methods are based on a single image [2-7,11], which neglect the information in the time dimension. Some other methods adopt unsupervised clustering algorithms and group the voxels according to their signal variations in the time dimension [8,9,10]. One limitation of the unsupervised segmentation methods is that it divide the images into homogeneous regions using image-based features rather than anatomically meaningful distinctions [12]. Moreover, the number of clusters is difficult to be determined in unsupervised clustering algorithms.
In this study, we proposed a seed-based supervised classification method, which makes use of both spatial and temporal information of DCE-MR images. Compared with clustering algorithm, the proposed algorithms and can automatically extract the anatomically meaningful seeds for classification and do not require the predetermined number of clusters.
Materials and methods
MR imaging
This study was approved by the local Institutional Review Board. Written informed consent was obtained from four volunteers (age 68±15.17 years). All scans were performed using a clinical 3T MRI scanner (Signa TM; GE Medical Systems, Milwaukee, WI). A 3-D EFGRE sequence for T1-weighted images was scanned. A total of 70 frames of images were acquired after an administration of 0.025mmol/kg of Gd-DTPA.
Overview of the model
The flowchart is shown in Fig. 1. The method consists of three steps:
A. Registration To correct the respiratory motion, the images were registered to typical cortical phase using a rigid affine transformation.
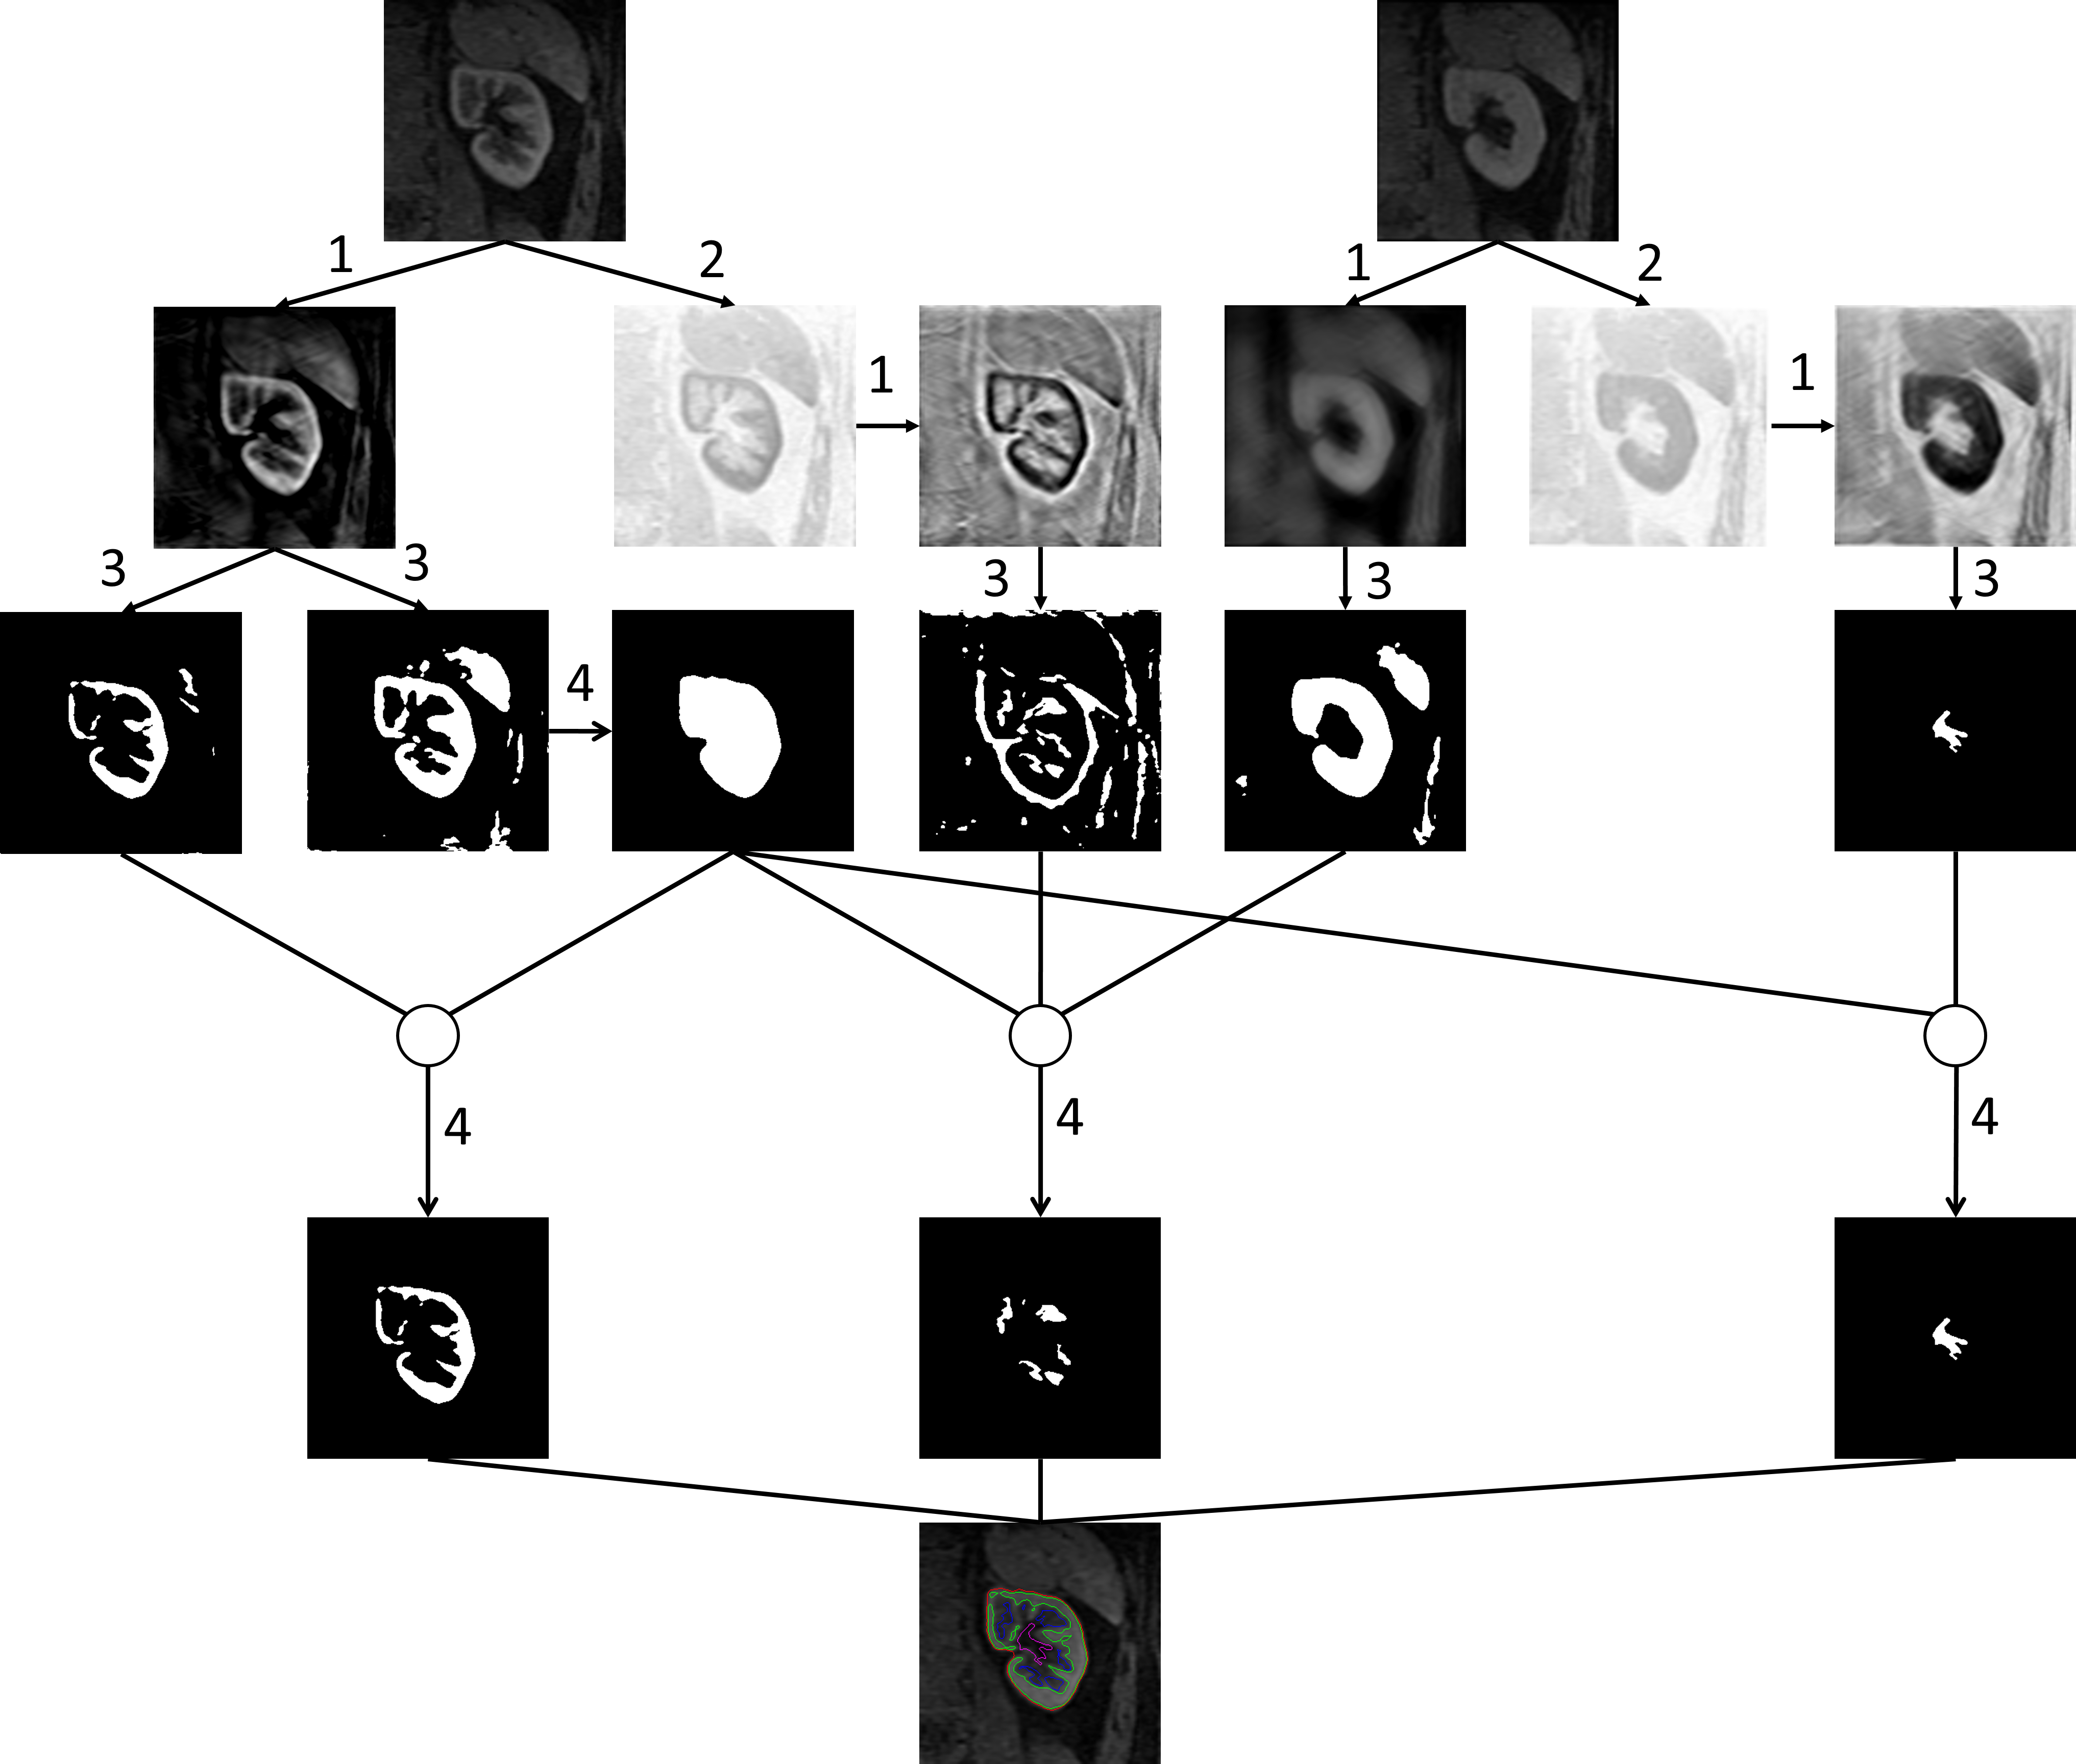
B. Kidney contour and seeds extraction Cortical phase, parenchymal phase and excretory phase, can be imaged in renal DCE-MRI. Typical images in the cortical phase and parenchymal phase are shown in Fig. 3. Two typical images of cortical and parenchymal phases were selected. Subsequently, the curvelet based enhancement, adaptive thresholding and mathematical morphology processing were embedded in the kidney contour and seeds extraction procedure, as shown in Fig. 2.
C. Supervised segmentation After acquiring the kidney contour and seed regions of cortex, medulla and pelvis, the time-intensity series of each pixel in the kidney contour were obtained. The seed regions of cortex, medulla and pelvis were given different labels, and the unseeded pixels were assigned to the labels using SVM and random walker [13], respectively. Radial basis kernel function (RBF) based multi-class C-SVM classifier was applied to classify the time-intensity series of unseeded pixels. The penalty parameter C and the kernel parameter γ associated with RBF kernel were set to 1 and the reciprocal of frame number, respectively. For the pixel classification based on Random walker, the weight between adjacent pixels was redefined as $$w_{ij}=exp(-\beta(g_{i}-g_{j})^{2})$$
where $$$g_{i}$$$ and $$$g_{j}$$$ refer to the time-intensity series of two adjacent pixels. The coefficient $$$\beta$$$ was set to be 90. Eight-connected lattice was used as the underlying structure.
Morphological manual segmentation
A total of 60 image sequences from 4 subjects were manually segmented by two experienced radiologists. One of the manual segmentations was regard as the reference standard, another manual segmentation was used to calculate the similarity between repeated manual segmentations.
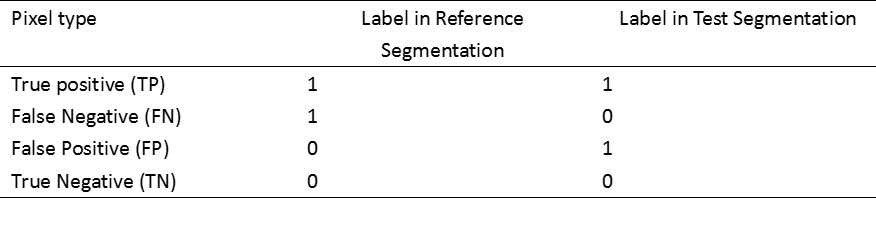
Data Analysis The automated segmentations and repeated manual segmentation were compared with reference manual segmentation. The segmentations of cortex, medulla and pelvis could be considered as binary maps with label 1 inside the ROI and 0 outside. Similarity indexes (SI) were then computed for cortex, medulla and pelvis which are a commonly used index to validate the efficiency of the test segmentation algorithm [8,9,14]. $$Similarity index SI= TP/(TP + FN + FP)$$ where TP, FN and FP were defined in Table 1.
Results and Discussion
A typical SVM and random walker segmentation result is shown in Fig. 3. Similarity indexes between manual segmentation and automated segmentations are illustrated in Fig. 4. The similarity between automated and manual segmentations is higher than that between repeated manual segmentations. The segmentation performance for cortex is better than that of medulla and pelvis with higher average similarity indexes and smaller standard deviations. This is probably because the contract between cortex and medulla in cortical phase is more distinguishable than the contract between medulla and pelvis in parenchymal phase.Conclusion
In this study, a supervised classification strategy is proposed to segment renal cortex, medulla and pelvis from DCE-MRI sequences. According to the similarity measures, the proposed automated method yields a relatively good similarity with manual segmentation and is more stable than manual segmentation.Acknowledgements
No acknowledgement found.References
[1] Stevens L A. et al. New England Journal of Medicine, 2006, 354(23): 2473-2483.
[2]. Rusinek H. et al. Magn Reson Med 2007;57(6):1159-1167.
[3]. Coulam CH.et al. J Magn Reson Imaging 2002;15(2):174-179.
[4]. Lv D et al. Engineering in Medicine and Biology Magazine, IEEE 2008;27(5):36-41.
[5]. Tsagaan B et al. Image Processing, 2001 Proceedings 2001 International Conference on. Volume 3: IEEE; 2001. p. 1059-1062.
[6]. Yuksel SE et al. International Congress Series. Volume 1281: Elsevier; 2005. p. 773-778.
[7]. Rao M. et al. International Journal of Radiation Oncology* Biology* Physics 2005;61(3):954-960.
[8] Chevaillier B. et al. Acoustics, Speech and Signal Processing, 2008. ICASSP 2008. IEEE International Conference on. IEEE, 2008: 525-528.
[9] Chevaillier B. et al. Neural processing letters, 2011, 34(1): 71-85.
[10]Yang X. et al. Medical image analysis, 2016, 32: 269-280.
[11] Abdelmunim H. et al. Computer Vision and Pattern Recognition Workshops, 2008. CVPRW'08. IEEE Computer Society Conference on. IEEE, 2008: 1-6.
[12] Gordillo N. et al. Magnetic resonance imaging, 2013, 31(8): 1426-1438. [13] Grady L. Pattern Analysis and Machine Intelligence, IEEE Transactions on, 2006, 28(11): 1768-1783. [14] Zijdenbos A P. et al. IEEE transactions on medical imaging, 1994, 13(4): 716-724.
Figures