5053
A Rapid Hybrid Spiral Spin-Echo Technique for Simultaneous Multi-Contrast Fat-Water Imaging1Imaging Research, Barrow Neurological Institute, Phoenix, AZ, United States
Synopsis
In the conventional MR setting, each contrast is typically acquired with a different scan/sequence, often resulting in long scan time and inter-scan misregistration. Simultaneous multi-contrast imaging has advantages such as good registration, reduced scan time, etc. In this project we propose a hybrid spiral SE technique for simultaneous T1, T2, and PD imaging, with fast scan speed and improved image quality.
Introduction
In the conventional MR setting, each contrast is typically acquired with a different scan/sequence, such as T1 contrast with SE/TSE or GRE, T2 contrast with TSE. This often leads to long scan time and inter-scan (/contrast) misregistration. For reduction of scan time, TSE has replaced SE for T2 imaging due to its fast speed. However, the T2 contrast is altered compared to conventional SE, primarily due to the train of repeated refocusing RF pulses. The proton density (PD) contrast can be acquired with (dual echo) TSE, but incurs extra scan time on top of the T2 scan. Therefore, in the clinical practice, the PD contrast is often sacrificed to reduce exam time, even though it may have advantages in certain applications, such as multiple-sclerosis1 and glioblastoma2. Simultaneous multi-contrast imaging3-6 and mapping7-9 have drawn increased interest in recent years due to the good inter-contrast registration and/or fast speed. In this project, we propose a hybrid spiral SE technique to simultaneously acquire data for T1, T2, and PD contrast, providing fast scan speed, improved contrast, and the potential for quantitative mapping.Methods
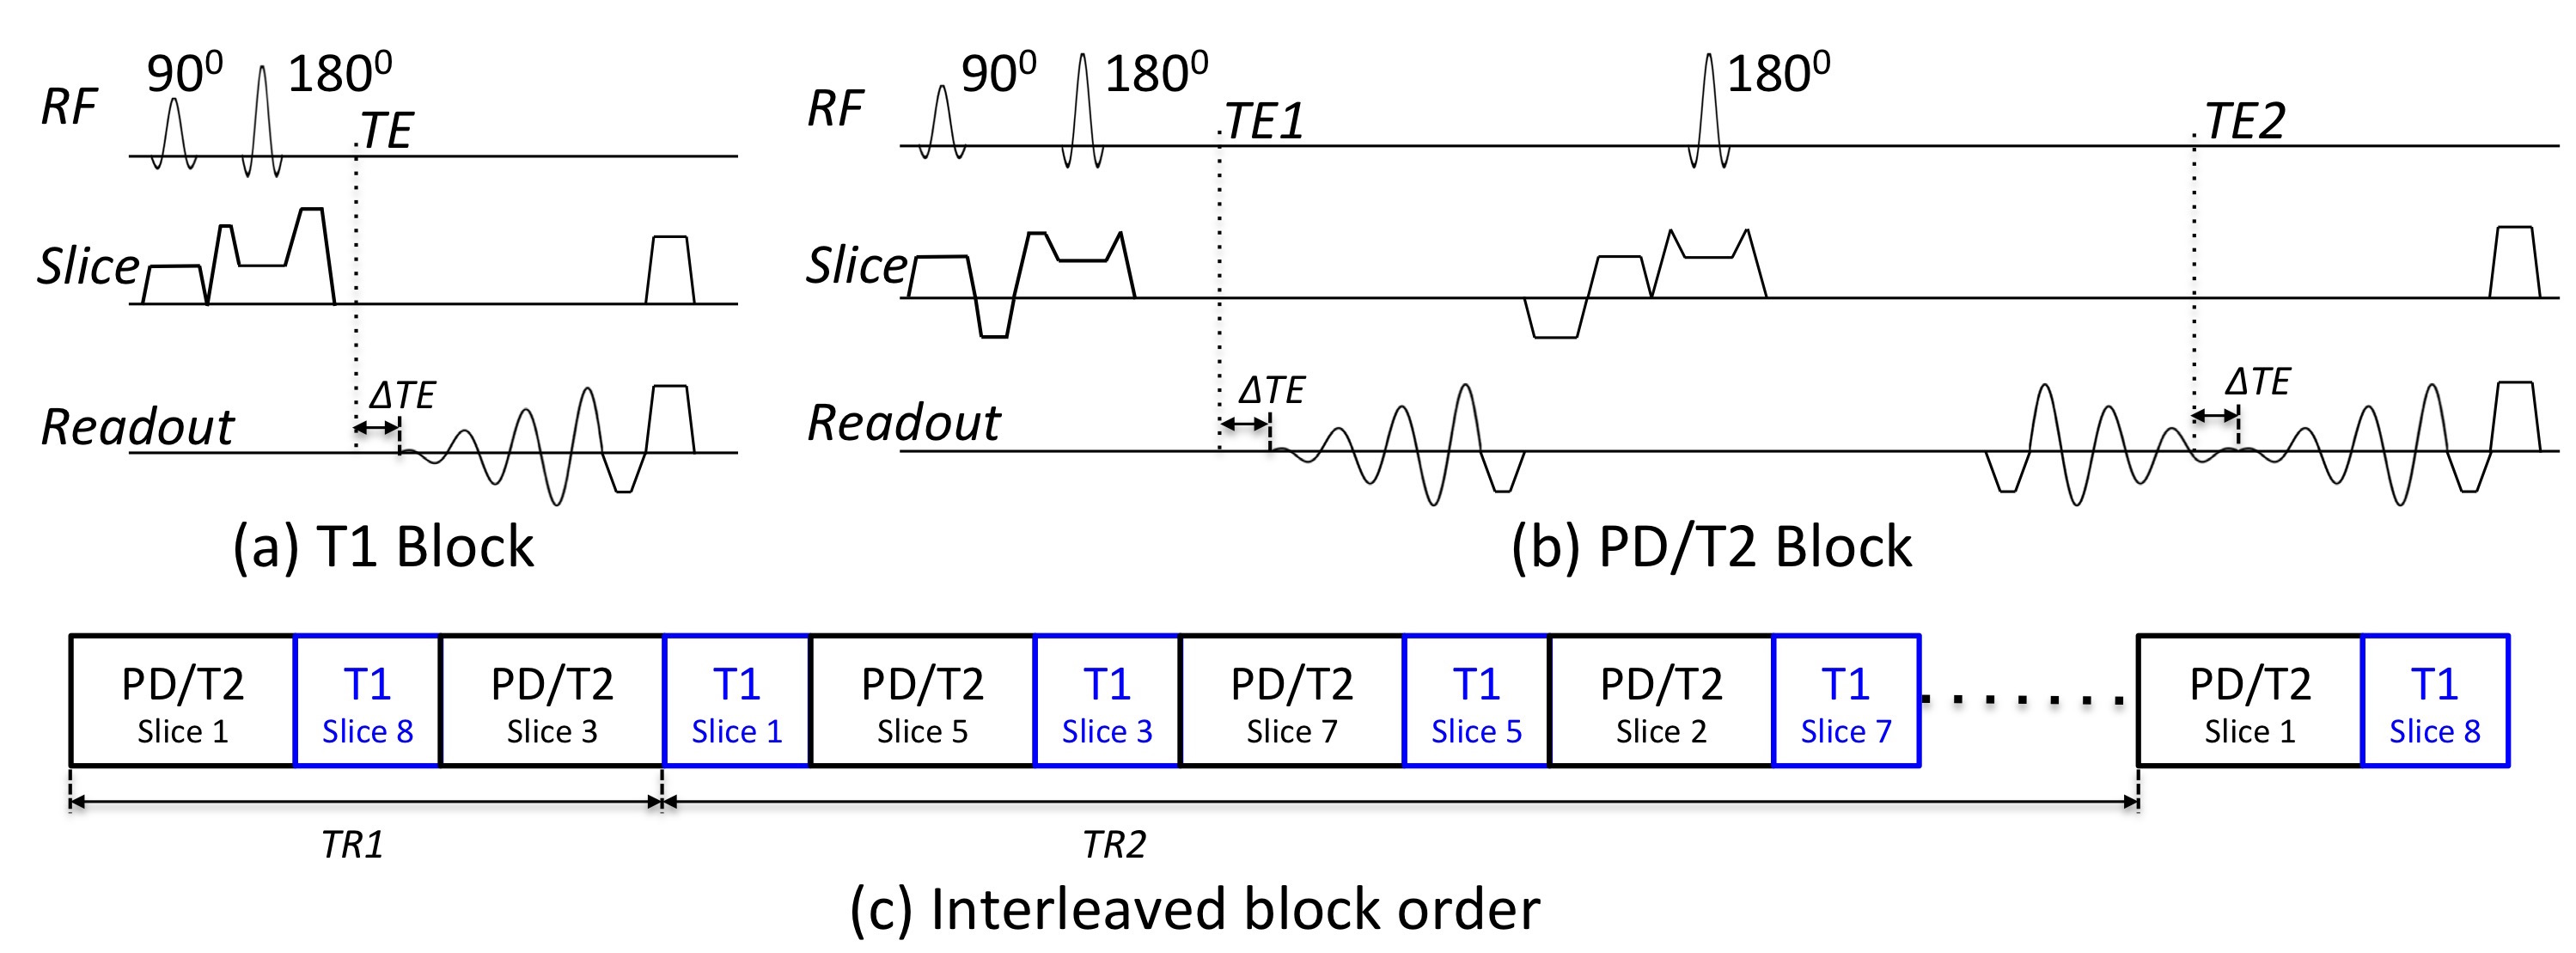
As illustrated in Fig. 1, the hybrid spiral SE sequence consists of two main imaging blocks: a short SE block with a spiral-out readout (Fig. 1a) for T1 data10, and a dual-echo SE block with hybrid spiral readout (Fig. 1b) for PD and T2 data11. To reduce flow artifacts, the T1 block uses a pair of large crushers, while the PD/T2 block uses gradient flow compensation on both echoes. To generate the desired T1 and PD/T2 contrast, suitable repetition times (TR1 and TR2, as defined in Fig. 1c) are set by interleaving the two blocks that are shifted by an appropriate number of slices, similar to the logic in FLAIR12. Additional dummy block(s) can be inserted in the sequence for a better manipulation of the TRs. Rapid sampling of k-space with spiral acquisition allows water-fat Dixon imaging while keeping the total scan time short.
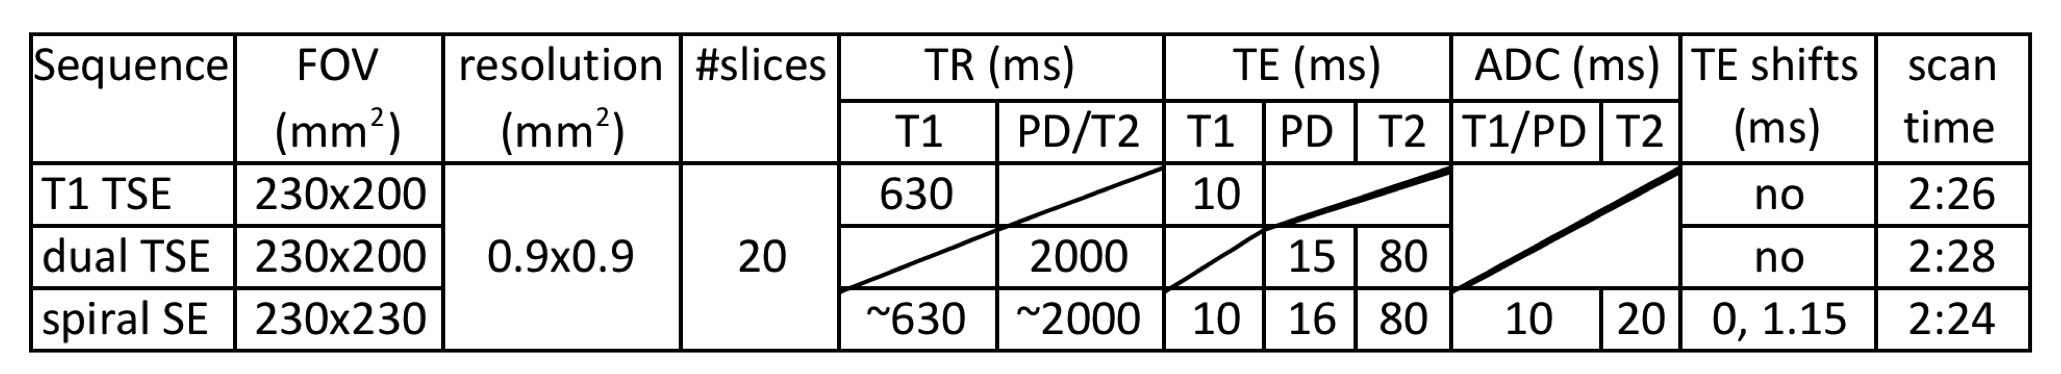
Volunteer data were acquired on a 3T Philips Ingenia scanner. All scan parameters are listed in Table 1. The total scan time of the Cartesian scans is 4:54 (2:26 for T1 TSE and 2:28 for dual echo TSE, without Dixon imaging), while the scan time of the spiral SE is 2:24 (with Dixon imaging).
Results and Discussion:
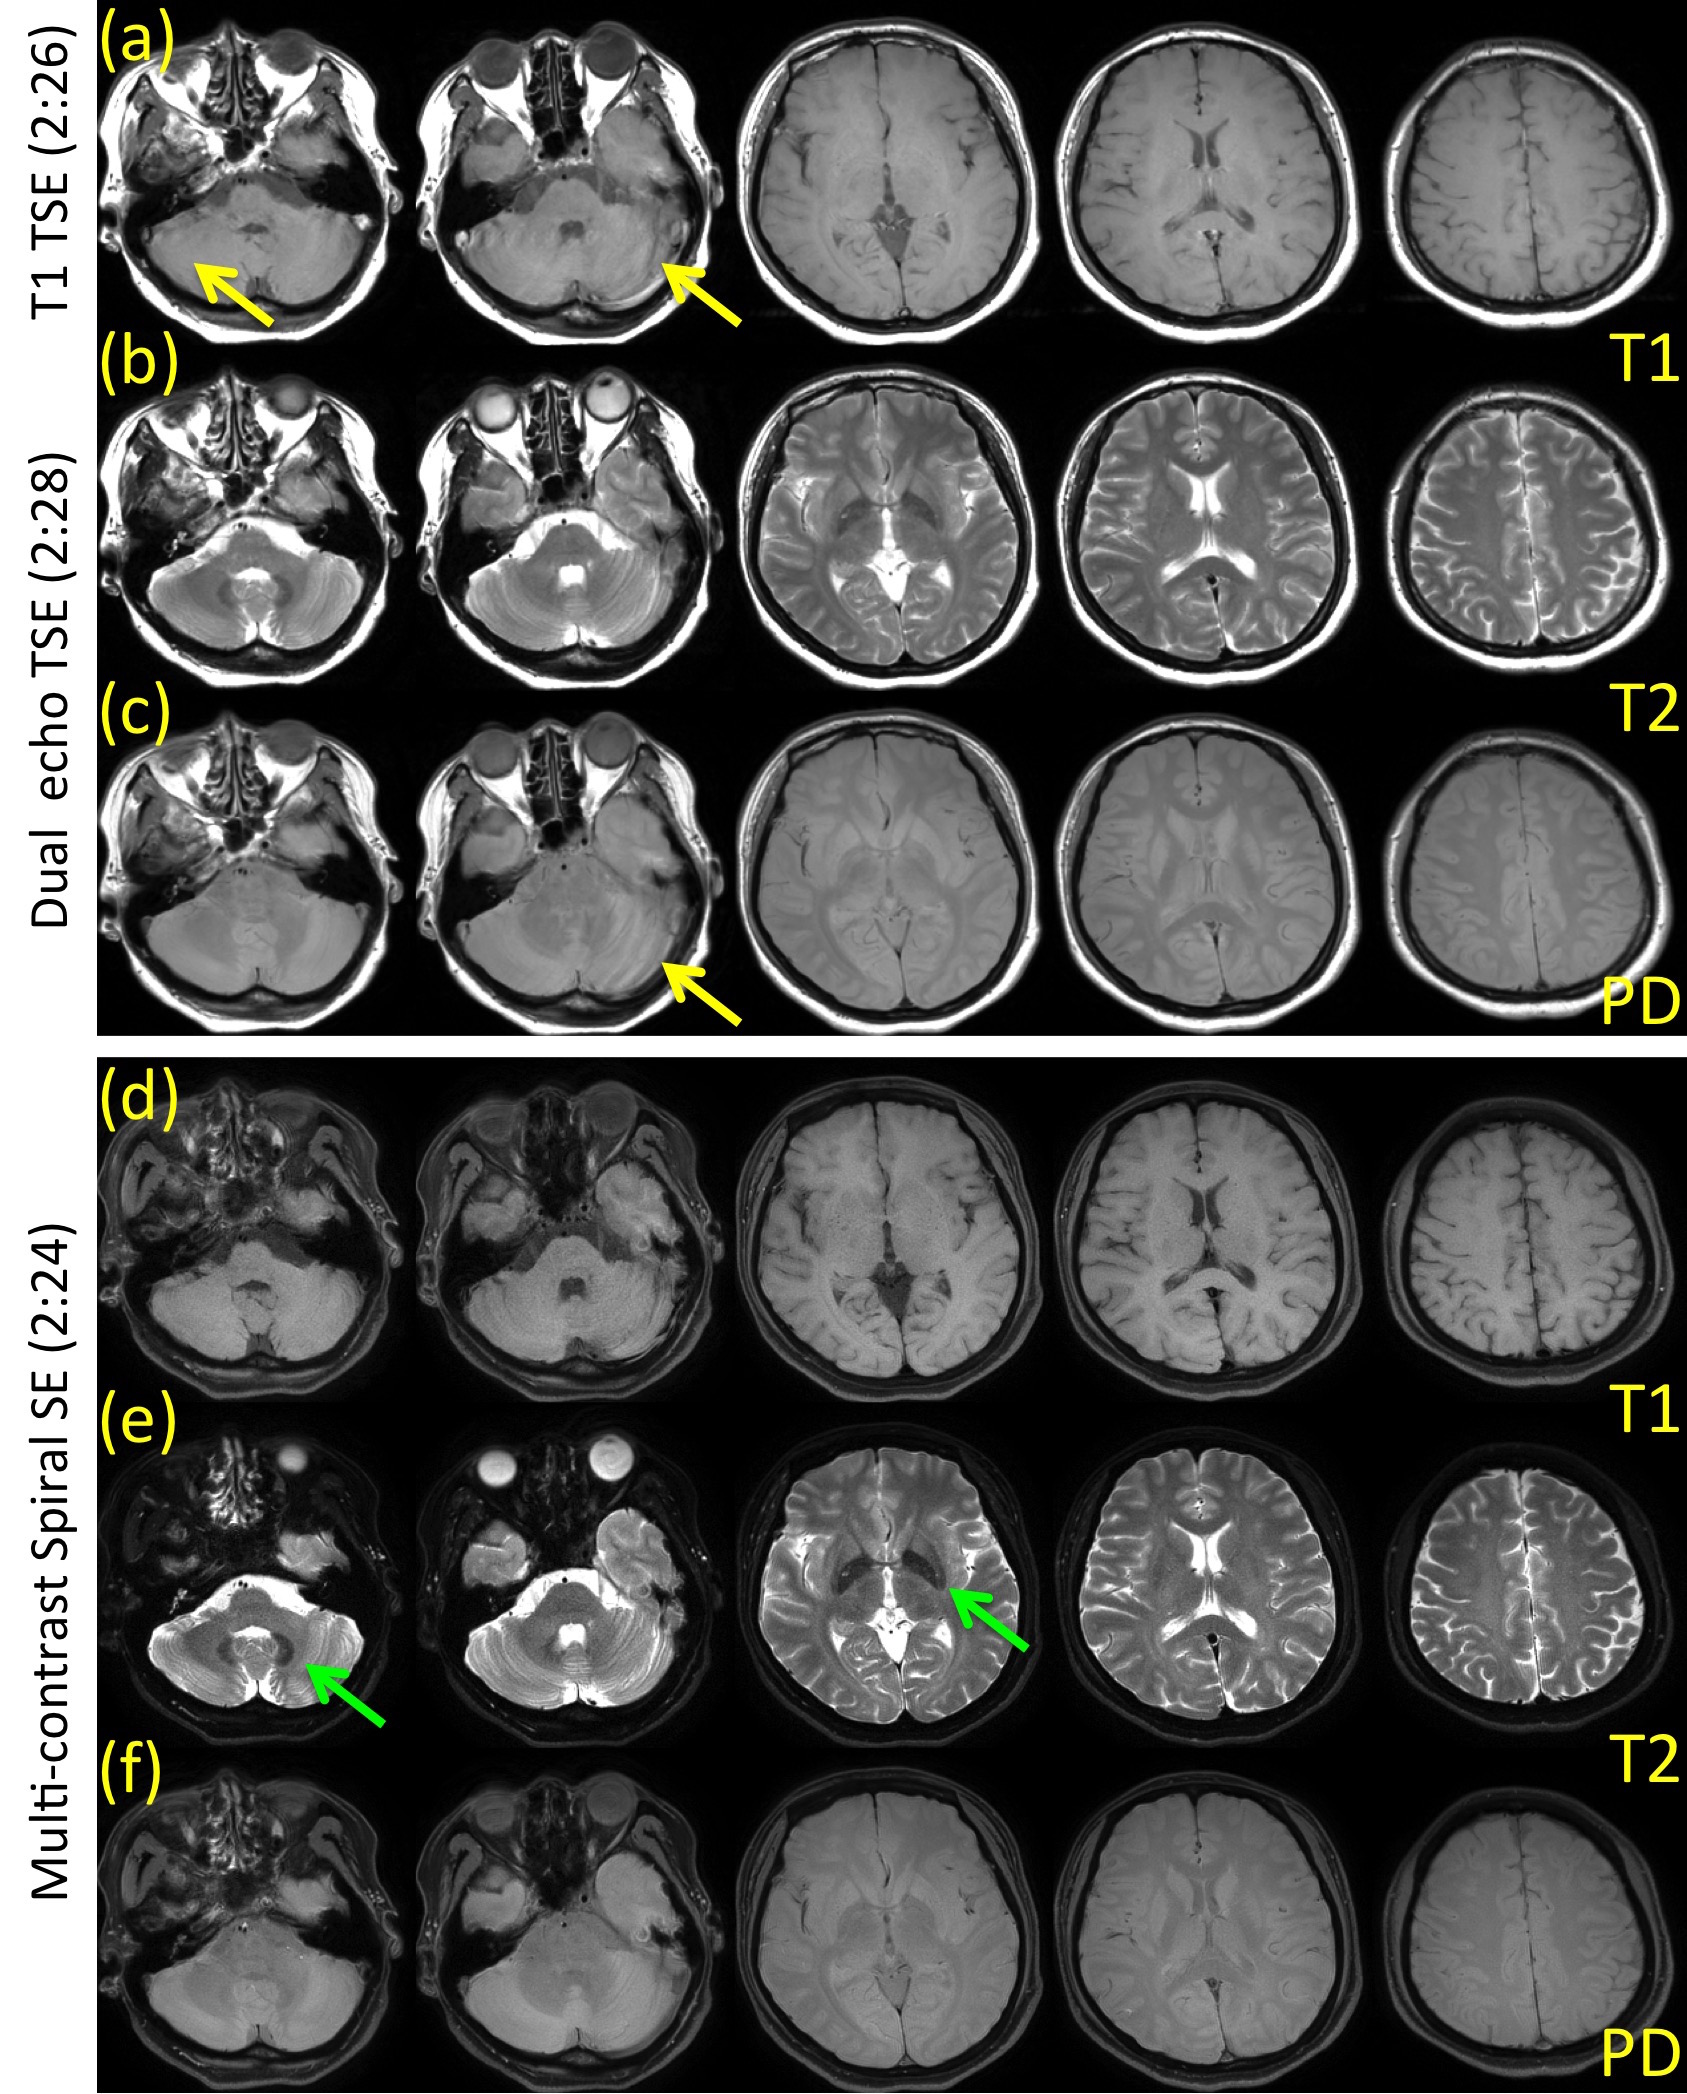
Figs. 2 shows T1, T2, and PD-weighted water-separated images acquired with the spiral TE (bottom panel). The images from the reference T1 TSE and dual echo TSE scans are shown in the top panel. Note that Dixon imaging is not used in the Cartesian TSE scans. In general, the overall image quality is comparable between Cartesian TSE and spiral SE. However, it is observed that the flow artifacts seen in the Cartesian T1 and PD images (pointed to by the yellow arrows in a and c) are minimized in the spiral results (d and f), attributed to the flow suppression in the T1 block and flow compensation in the PD/T2 block. It is also noticed that the spiral T2 images (e) exhibits better contrast in areas such as the dentate nuclei, red nuclei, globes pallidus, etc. (green arrows in e), which might help the diagnosis of diseases related to iron deposition. The T1 contrast in the spiral images (d) is slightly better than that in the Cartesian images (a), likely because of the RF echo train used in the latter sequence. The Cartesian images also look slightly blurrier (in the phase encoding direction) due to T2 signal decay in the TSE echo train.
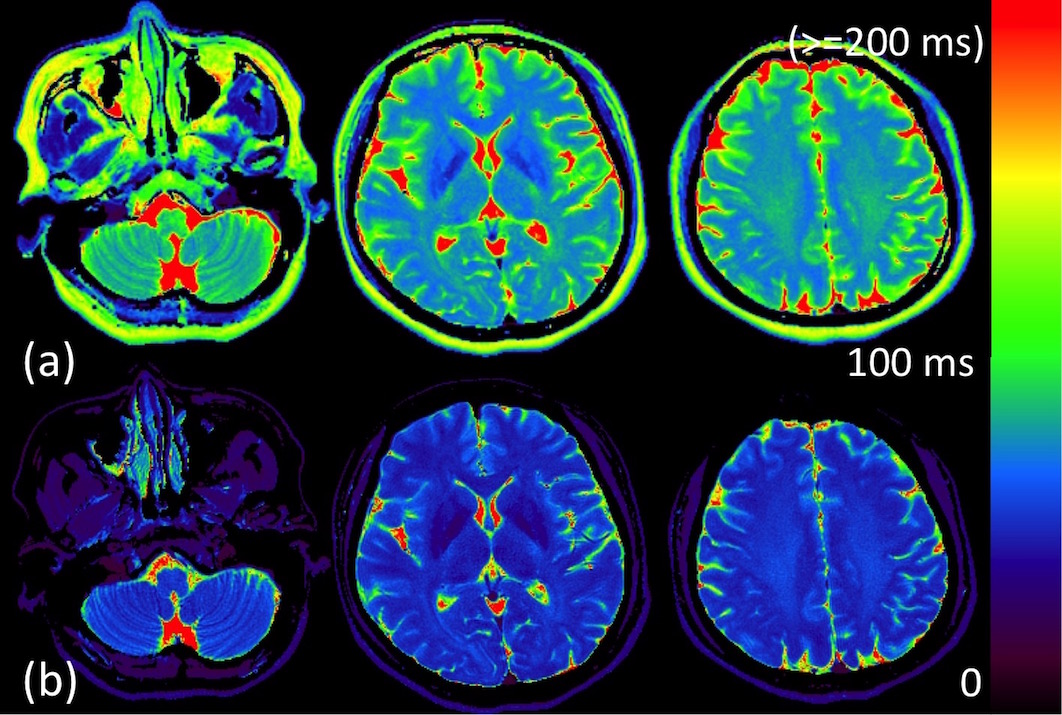
Fig. 3 shows the T2 maps approximately estimated from the PD/T2 data. The T2 values estimated from the spiral data are lower than those from the Cartesian data due to the difference between SE and TSE, as previously reported13. Although coarsely derived from only 2 data points, the T2 map may find use in certain applications, such as quantification of non-enhancing tumor burden in gliomas14. T1 mapping may also be possible by taking into account additional information such as the non-ideal slice profile, b1 inhomogeneity, etc, which is beyond the scope of this work.
Conclusion
Multi-contrast spiral SE imaging is a promising tool for rapid simultaneous T1, T2 and PD-weighted neuroimaging with improved image quality.Acknowledgements
This work was funded by Philips Healthcare.References
(1) Schmidt C, Hattingen E, Faehndrich J, et al. Detectability of Multiple Sclerosis Lesions with 3T MRI: A Comparison of Proton Density-Weighted and FLAIR Sequences. J Neuroradiol. 2012;39:51-56.
(2) Ellingson BM, Bendszus M, Boxerman J, et al. Consensus Recommendations for a Standardized Brain Tumor Imaging Protocol in Clinical Trials. Neuro-Oncology. 2015;17:1188-1198.
(3). Higuchi N, Oshio K, Momoshima S, et al. Two-Contrast RARE: A Fast Spin-Density and T2-Weighted Imaging Method. J Magn Reson Imaging. 1991;1:147.
(4). Hillenbrand C, Hahn D, Haase A, et al. MR CAT Scan: A Modular Approach for Hybrid Imaging. MAGMA. 2000;10:183-199.
(5). Mekle R, Wu EX, Meckel S, et al. Combo Acquisitions: Balancing Scan Time Reduction and Image Quality. Magn Reson Med. 2006;55:1093-1105.
(6). Fuchs K, Hezel F, Klix S, et al. Simultaneous Dual Contrast Weighting Using Double Echo Rapid Acquisition with Relaxation Enhancement (RARE) Imaging. Magn Reson Med. 2014;72:1590-1598.
(7). Deoni SCL, Peters TM, Rutt BK. High-Resolution T1 and T2 Mapping of the Brain in a Clinically Acceptable Time with DESPOT1 and DESPOT2. Magn Reson Med. 2005;53:237-241.
(8). Warntjes JBM, Leinhard OD, West J, et al. Rapid Magnetic Resonance Quantification on the Brain: Optimization for Clinical Usage. Magn Reson Med. 2008;60:320-329.
(9). Ma D, Gulani V, Seiberlich N, et al. Magnetic Resonance Fingerprinting. Nature. 2013;495:187-192.
(10) Li Z, Hu HH, Miller JH, et al. A Spiral Spin-Echo MR Imaging Technique for Improved Flow Artifact Suppression in T1-Weighted Post-Contrast Brain Imaging: A Comparison with Cartesian Turbo Spin-Echo. AJNR Am J Neuroradiol. 2016;37:642-647.
(11). Li Z, Wang D, Karis JP, et al. A Dual Spin-Echo Technique with Hybrid Spiral Readouts for Fast Simultaneous Proton Density- and T2-Weighted Fat-Water Imaging. Proceedings of ISMRM. 2016;24:1833.
(12) Listerud J, Mitchell J, Bagley L, et al. OIL FLAIR: Optimized Interleaved Fluid-Attenuated Inversion Recovery in 2D Fast Spin Echo. Magn Reson Med. 1996;36:320-325.
(13). Pai A, Li X, Majumdar S. A Comparative Study at 3T of Sequence Dependence of T2 Quantification in the Knee. Magn Reson Imaging. 2008;26:1215-1220.
(14) Ellingson BM, Lai A, Nguyen HN, et al. Quantification of Nonenhancing Tumor Burden in Gliomas Using Effective T2 Maps Derived from Dual-Echo Turbo Spin-Echo MRI. Clin Cancer Res. 2015;21:4373-4383.
Figures