5051
Using the inflow effect to determine velocity in the carotid artery: comparison with phase contrast velocity mapping1Radiology & Imaging Sciences, NIH Clinical Center, Bethesda, MD, United States
Synopsis
Phase contrast (PC) imaging is commonly employed for mapping velocities in cerebral arteries. This requires a dedicated sequence along with acquisition of two sets of image data. In addition, PC imaging can be compromised by residual eddy currents, motion, selection of velocity encoding value (VENC) and imaging plane in relation to the vessel. In this work, a magnitude based method exploiting the inflow effect was employed to determine velocity in the carotid arteries. A standard 3D T1w SPGR sequence was used eschewing the need for a dedicated sequence. By measuring signal in ROIs at two locations of the artery and jugular vein, velocity independent of B1 inhomogeneity can be derived. The effect of B1+ field was also taken into account. It was shown that the velocity estimated with this technique shows significant correlation with PC based velocity while showing no significant differences in the right and left CAs in 12 volunteers.
Purpose
To assess the feasibility of carotid artery (CA) velocity mapping using the inflow effect.Introduction
Phase contrast imaging is commonly employed for mapping velocities in cerebral arteries (1). In addition to direct applications of velocity mapping in carotids such as stenosis assessment and recanalization (2) or using velocity indices as marker of vasospasm (3), other applications include estimating CBF to determine tagging efficiency with pCASL (4) and possible assessment of post-labeling delay time in ASL. Two sets of image data are required for PC velocity mapping using a dedicated sequence. Here we explore the possibility of assessing velocity using the inflow effect with a routine 3D SPGR sequence.Methods
The method is based on several observations:
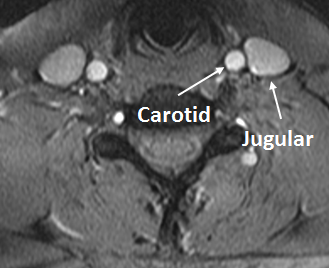
(a) Blood inflow affects the arterial signal but not the venous signal (b) The jugular vein runs in close proximity to the CA and can be employed for B1 inhomogeneity related normalization (c) Venous return from the brain is ~5 s after carotid arterial supply. Therefore, the venous signal is a reflection of blood signal at steady-state. (d) Differences in the venous signal along craniocaudal direction is a reflection of B1 inhomogeneity as the venous signal is the steady-state signal.
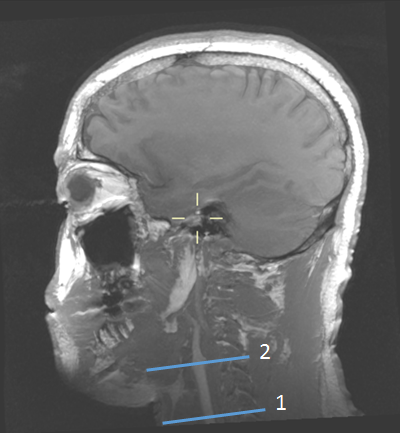
The velocity was determined in the following manner. Consider A1 and A2 to be the measured signals in ROIs in the artery and V1 and V2 signals in the jugular vein at levels 1 and 2 (in reformatted transverse plane), respectively. Let d be the distance between the two levels. Measured ROI signal A1 can be normalized to level 2 using A12 = A1×(V2/V1). Steady-state (SS) signal for blood with the SPGR sequence is given by fSS = (1 − E1×cosθ)/(1 − E1) where E1 = exp(−TR/T1) when M0 = 1. Normalizing to M0=1, provides signal A1N=(A12×fss)/V2. Similarly, A2N=(A2×fss)/V2 where fss is the longitudinal SS signal at level 2. Based on (5), it can be shown that the sequence indices where signal = A1N and A2N are given by
j1,2 = ln[(A1N,2N − fss)/(1−fss)] / ln(E1×cosθ) + 1
In which case velocity v = d/[(j1 – j2)×TR]
Twelve volunteers (7M,5F; age 43.5±14.5 yrs) were imaged on a Philips 3T Achieva TX scanner with multitransmit body coil and an 8-channel receiver head coil. Standard PC imaging was performed at a single slice location in the CA (VENC=90 cm/s) using 3D TOF for localization. Scan parameters for 3D T1w SPGR were: FOV = 25 cm, res = 1 mm3, TR/TE = 5.3/1.7 ms, FC, θ=15°, 185 slices, scan time: 3:58. Transmit field (B1+) inhomogeneity may be present at fields higher than 1.5T. A calibration method for the RF transmit field (AFI (6)) was employed in five volunteers to ascertain actual flip angle at level 2. Scan parameters were: FOV = 25 cm, TR1/TR2/TE = 8/40/2.3 ms, nominal flip = 45°, scan time: 3:50.
Results
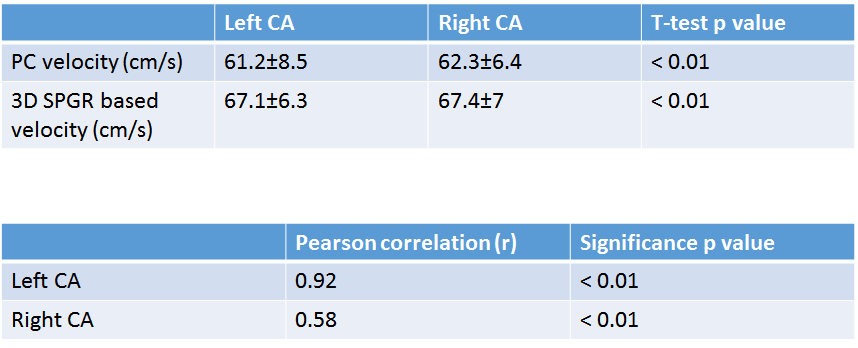
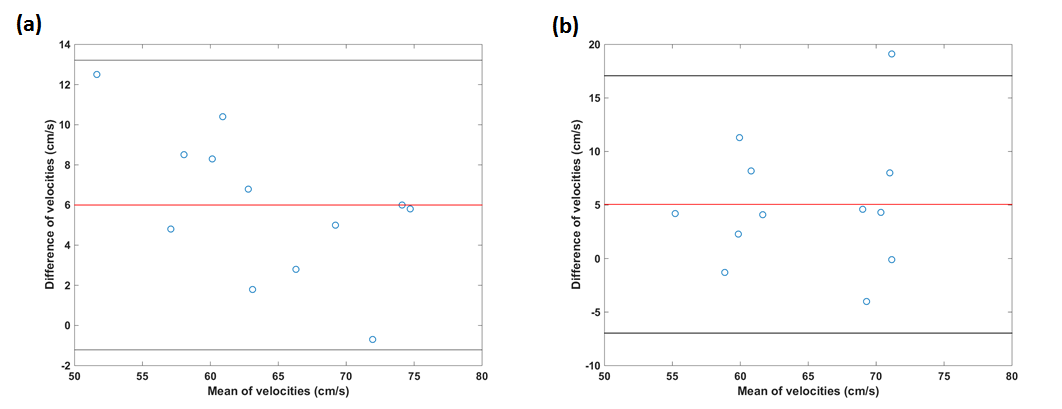
Figure 1 shows the carotid artery and jugular vein in close proximity to each other while Figure 2 shows the segment of carotid used for measurements at two levels. B1+ inhomogeneity in the vicinity of level 2 varied between 97-104% of nominal flip angle for all five volunteers in whom it was assessed resulting in an error of about −5% to 7.8% in estimated velocity values if not corrected. Figure 3 shows the velocities measured and the correlations. There was no significant difference between left and right CAs with the two methods. However, velocity values were significantly higher with our technique compared with PC for both left and right CAs. Figure 4 shows the Bland-Altman plots for velocities in left and right CA with the two methods.Discussion
For PC imaging, value of VENC used, slice placement in relation to vessel and residual eddy currents result in errors. Our magnitude based method is limited in straight segments of vessels although curvilinear reformatting could be employed. Differences in T1 of venous and arterial blood (7) results in a negligible error (<1%) in calculated velocities. In addition, a one-time calibration process as done here may result in minor errors (if not corrected on individual basis) as shown in Results section. The differences in velocity agreement between left and right CAs for the two methods could be attributed to variances resulting from ROI placement for the two methods, slice perpendicularity to the two arteries (for PC) and inaccuracies in measuring distance d.Conclusion
The magnitude based method described here could provide an alternate way for measuring flow velocity. A dedicated sequence may not needed be since 3D T1w SPGR is routinely employed in clinical head protocols.Acknowledgements
No acknowledgement found.References
(1) Enzmann D, Ross M, Marks M et al. Blood flow in major cerebral arteries measured by phase-contrast cine MR. Am J Neuroradiol 1994; 15:123-129.
(2) Harloff A, Albrecht F, Spreer J et al. 3D blood flow characteristics in the carotid artery bifurcation assessed by flow sensitive 4-D MRI at 3T. Magn Reson Med 2009;61: 65-74.
(3) Krejza J, Szydlik P, Liebeskind D et al. Age and sex variability and normal reference values for VMCA /VICA index. Am J Neuroradiol 2005; 26:730-735.
(4) Aslan S, Xu F, Wang P et al. Estimation of labeling efficiency in pseudo-continuous arterial spin labeling. Magn Reson Med 2010;63:765-771.
(5) Hanicke W, Merboldt K, Chien D et al. Signal strength in subsecond FLASH magnetic resonance imaging: the dynamic approach to steady state. Med Phys 1990; 17: 1004-1010.
(6) Yarnykh V. Actual flip-angle imaging in the pulsed steady state: a method for rapid three-dimensional mapping of the transmitted radiofrequency field. Magn Reson Med 2007; 57(1): 192-200.
(7) Lu H, Klingman C, Golay X et al. Determining the longitudinal relaxation time T1 of blood at 3T. Magn Reson Med 2004; 62:679-682.
Figures