5048
Optimal MRI pulse sequence to quantify iron-oxide nanoparticles at high concentration1Center for Magnetic Resonance Research, Department of Radiology, University of Minnesota, Minneapolis, MN, United States
Synopsis
Recent advances in nanotechnology have allowed for the effective use of iron oxide nanoparticles (IONP) in magnetic nanoparticle hyperthermia for cancer therapy and in cell tracking for immunotherapy. Noninvasive imaging techniques for tracking and quantifying IONPs in-vivo will be necessary for accurate assessment. In this study, we have tested four representative ultra-short T2 sensitive MRI pulse sequences, UTE, ZTE, SWIFT and MB-SWIFT, to compare their performance for measuring IONPs at clinically relevant high concentration range. Multiple performance metrics were evaluated, compared, and summarized.
Introduction
Recent advances in nanotechnology have allowed for the effective use of iron oxide nanoparticles (IONP) in several promising medical applications, including magnetic nanoparticle hyperthermia in cancer therapy and cell tracking [1-2]. Noninvasive imaging techniques for tracking and quantifying IONPs in-vivo are necessary for translational clinical applications. Relaxation time constant rate R1 and R2* were demonstrated to be sensitive to iron concentration, thus can be used to quantify IONPs [3-6]. In this study, we have tested four representative ultra-short T2 sensitive MRI pulse sequences, UTE [7], ZTE [8], SWIFT [9] and MB-SWIFT [10], to compare their performance for measuring IONPs at clinically relevant high concentration range.Method
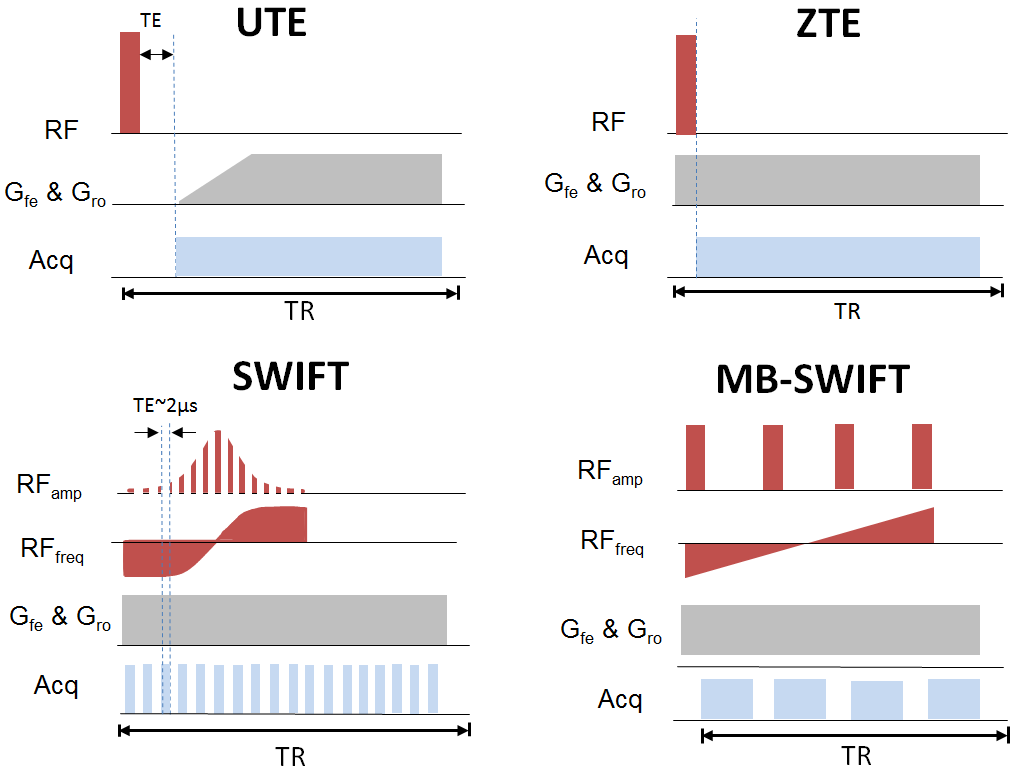
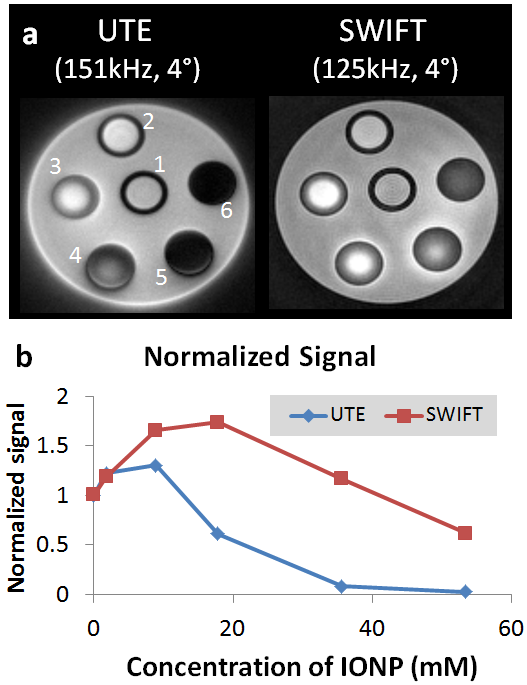
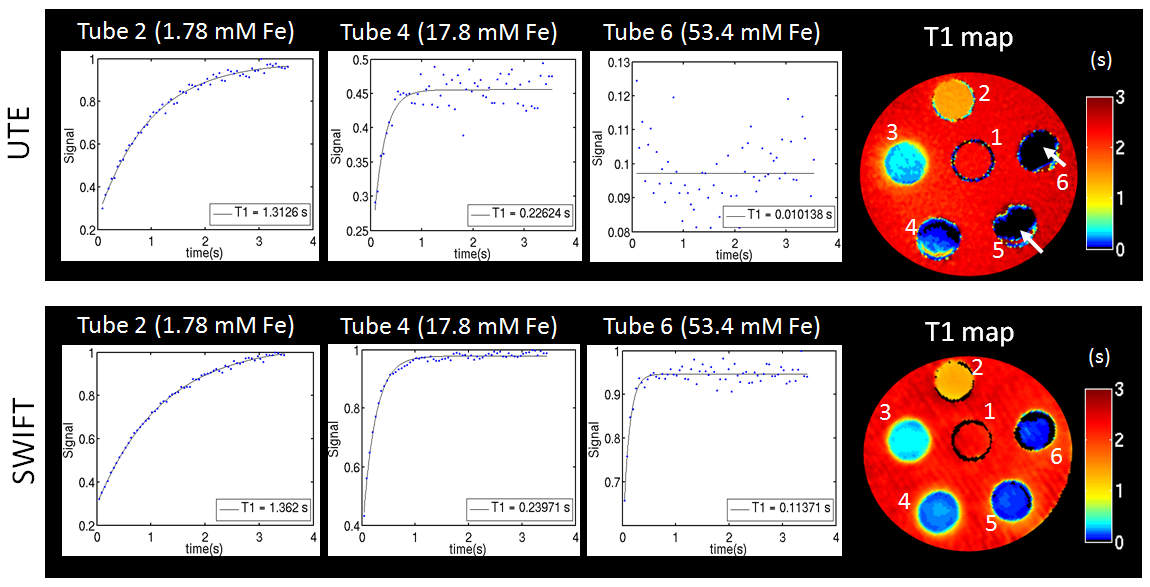
Diagrams of the sequences used in this study are presented in Fig. 1. All sequences use radial 3D acquisition. Images and T1 maps of the IONP phantom were acquired using a 9.4T scanner (Agilent Technologies, USA). The phantom was composed by six tubes of IONPs at different concentrations in agar immersed in a bigger bottle filled with saline. The concentration in tubes labeled 1 to 6, respectively, was equal to 0, 1.0, 8.9, 17.8, 35.6, and 53.4 mM (Fig. 2a). T1 maps were acquired by using a Look-Locker method with saturation pulse Tp=800 μs [4]. All images were reconstructed by an in-house developed program using gridding algorithm. The imaging parameters are showed in figure captions.Results and Discussions
In consideration of their unique features, the sequences were divided into two groups: 1) those using relatively low bandwidth (UTE and standard SWIFT), and 2) those using high bandwidth (ZTE and MB-SWIFT).
UTE and standard SWIFT were compared with similar parameters. The equivalent time delay after the RF pulse and beginning of acquisition for SWIFT and UTE are both equal to 2.5 μs. Despite the similarity of all used acquisition parameters, a simple analysis of SNR is not a valid comparison of these methods due to differences in ramped (UTE) and not ramped (SWIFT) acquisition, which yield different point spread functions [11]. However, a fair comparison is enabled by evaluating directly the T1 maps produced with each sequence. Fig 2a illustrates the different sensitivities of UTE and SWIFT to imaging samples with increasing concentration of IONP (shortening T2). At similar bandwidth and same flip angle, the normalized signal from SWIFT at concentration higher than 10 mM is considerably larger than that obtained with UTE (Fig. 2 b). A more direct demonstration of the quantitative performance is shown in Fig. 3. For samples with concentration higher than 30 mM Fe, the signal is almost at the noise level and no T1 information can be retrieved as showed in Fig. 3 (white arrow).
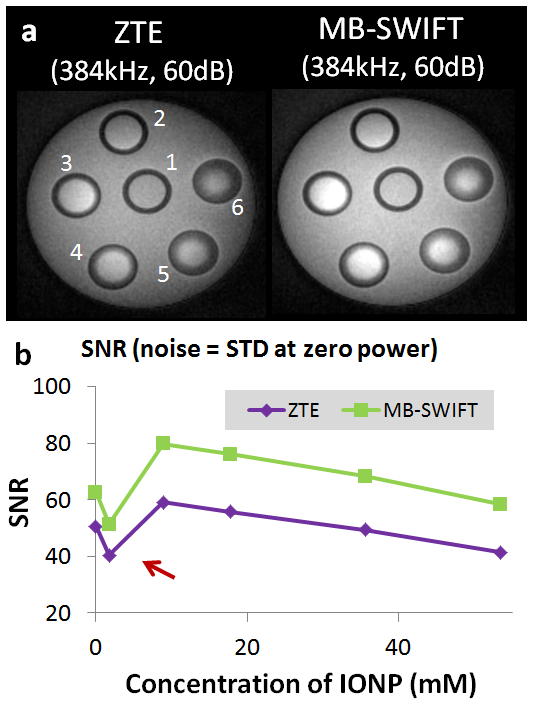
The comparison between ZTE and MB-SWIFT is more straightforward. The SNR values obtained with these two sequences, with noise defined as the STD of signal when using zero transmitter RF power, are plotted in Fig. 4. The bandwidth, RF power and acquisition time were matched to be the same. Since MB-SWIFT used multiple RF pulses with phase modulation for excitation in one TR cycle, the achieved flip angle is higher than that used in ZTE, thus giving higher SNR as shown. The disadvantage of MB-SWIFT as compared to ZTE is the longer time needed to achieve the same resolution with the same number of views. This could be improved for MB-SWIFT by using a super-resolution scheme [10], which however was not tested here.
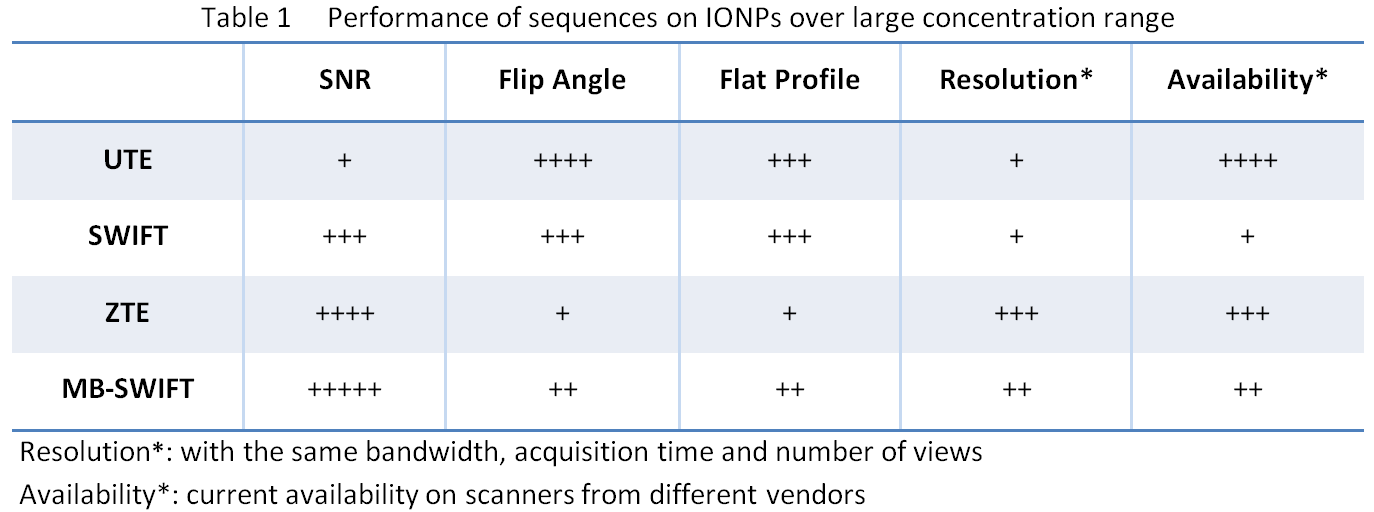
The overall comparison of these 4 sequences was symbolically summarized in Table 1. Applying the hard pulse when the gradient is “on” creates an uneven excitation profile for ZTE and MB-SWIFT. Indeed, due to higher RF efficiency MB-SWIFT allows improved excitation profile by decreasing lengths of the sub-pulses.
Conclusion
As a promising therapeutic and labeling agent, the specific clinical application scenarios for IONPs are various. Therefore, the optimal sequence for different applications could be different. If high flip angle and flat profile are more important than high SNR, SWIFT is probably a better choice than other sequences. If high SNR and highest achievable concentration of IONP are the goal, MB-SWIFT will be the optimal sequence. Or if high resolution and minimal acquisition time are more crucial, ZTE might be the better choice. The table provided can be used as a reference depending on what is the preferred factor in specific applications.Acknowledgements
This work was funded by: NIH P41 EB015894, WM KECK Foundation, NIH 1R21-AR068507-01A1.References
[1] Gneveckow U. et al. Medical physics 2004; 31(6):1444-1451. [2] Zhou R. et al. Magn Reson Med 2010;63(5):1154-1161. [3] Zhang J. et al. Magn Reson Med 2014;71(6):1982 [4] Hong W. et al. Magn Reson Med 2016,DOI: 10.1002/mrm.26371 [5] Zhang J. et al. Magn Reson Med 2016, DOI: 10.1002/mrm.26394 [6] Zhang J. et al. ISMRM, 2016 [7] Robson MD et al. J computer assisted tomography 2003;27(6):825-846 [8] Idiyatullin D et al. J Magn Reson 2006;181(2):342. [9] Weiger M et al. eMagRes 2012; 1: 311–322. [10] Idiyatullin D et al. Multi-Band-SWIFT. J Magn Reson 2015;251:19-25. [11] Rahmer J, et al. Magn Reson Med 2006;55(5):1075-1082.
Figures