5046
Optimal Control Pulse Design for Contrast in MRI: in vivo applications1CREATIS - CNRS UMR 5220 - INSERM U1206 - Université Lyon 1 - INSA Lyon - Université Jean Monnet Saint-Etienne, Villeurbanne, France, 2Department of Chemistry, Technische Universität München, Munich, Germany, 3Laboratoire Interdisciplinaire Carnot de Bourgogne, Dijon, France, 4Technische Universität München Institute for Advanced Study, Munich, Germany
Synopsis
Optimal control RF pulse design has recently been proposed to address the optimization of image contrast in MRI - in order to explore the theoretical contrast bound of a given imaged system. Their use has recently been validated on a real MRI scanner to contrast various in vitro samples. This abstract extends these results to in vivo applications, and shows that contrasts obtained with standard weighting strategies on rat and mouse brains can be improved or inverted. This demonstrates both the interest and flexibility that one can get when using optimal contrast pulses for in vitro and in vivo applications.
Purpose
Optimal control radio-frequency (RF) pulse design has recently been proposed to address the optimization of image contrast in MRI1,2. Pulses designed with optimal control ensure a certain degree of optimality, which allows the exploration of the theoretical contrast bound of a given imaged system. Their use has very recently been validated on a real MRI scanner to produce various contrasts on in vitro samples3. This abstract extends these results to in vivo applications, by creating contrasts on both rat and mouse brain images.Methods
Optimal control problems, via the resolution of the Pontryagin Maximum Principle4 (PMP), consist of computing the control that optimizes a user-defined cost function, given the dynamical evolution of the considered system. When applied to MRI, this comes down to the computation of the RF pulse that leads to a user-defined magnetization state, whose evolution is ruled by the Bloch equations.
In the context of
contrast optimization, the magnetization target state depends on the
desired contrast. Let $$$\overrightarrow{M_a}(t)$$$ and $$$\overrightarrow{M_b}(t)$$$ represent the magnetization
temporal evolution of respectively spins $$$a$$$ and $$$b$$$. The saturation
contrast is defined so that one spin
is saturated while the magnetization norm of the other one is
maximized at time ($$$t_f$$$):
$$C(w) = ||\overrightarrow{M_a}(t_f)||^2 - ||\overrightarrow{M_b}(t_f)||^2$$
where $$$\overrightarrow{w} = (w_x, w_y)$$$ is the pulse to be optimized. The pulse duration ($$$t_f$$$) is set long enough so that the pulse can optimally combine the effects of excitation and relaxation (T1 and T2) to produce the desired contrast. Following the PMP formalism, the optimal magnetization ($$$\overrightarrow{M}$$$) and costate ($$$\overrightarrow{P}$$$) trajectories must satisfy the Hamiltonian equations:
$$\dot{\overrightarrow{M}} =\frac{dH}{d\overrightarrow{P}} \quad \text{and} \quad \dot{\overrightarrow{P}} = -\frac{dH}{d\overrightarrow{M}}$$
with the following boundary conditions:
$$\overrightarrow{M}(t_0) = (0,0,M_0)^T \quad \text{and} \quad \overrightarrow{P}(t_f) = -\frac{dC}{d\overrightarrow{M}(t_f)}$$
The numerical resolution of these equations is performed with a gradient-ascent algorithm (GRAPE5), which iteratively reduces the cost function by updating the control field. Magnetic field inhomogeneities are taken into account in the system dynamics to make the pulse robust to deviations from the Larmor frequency.
Results
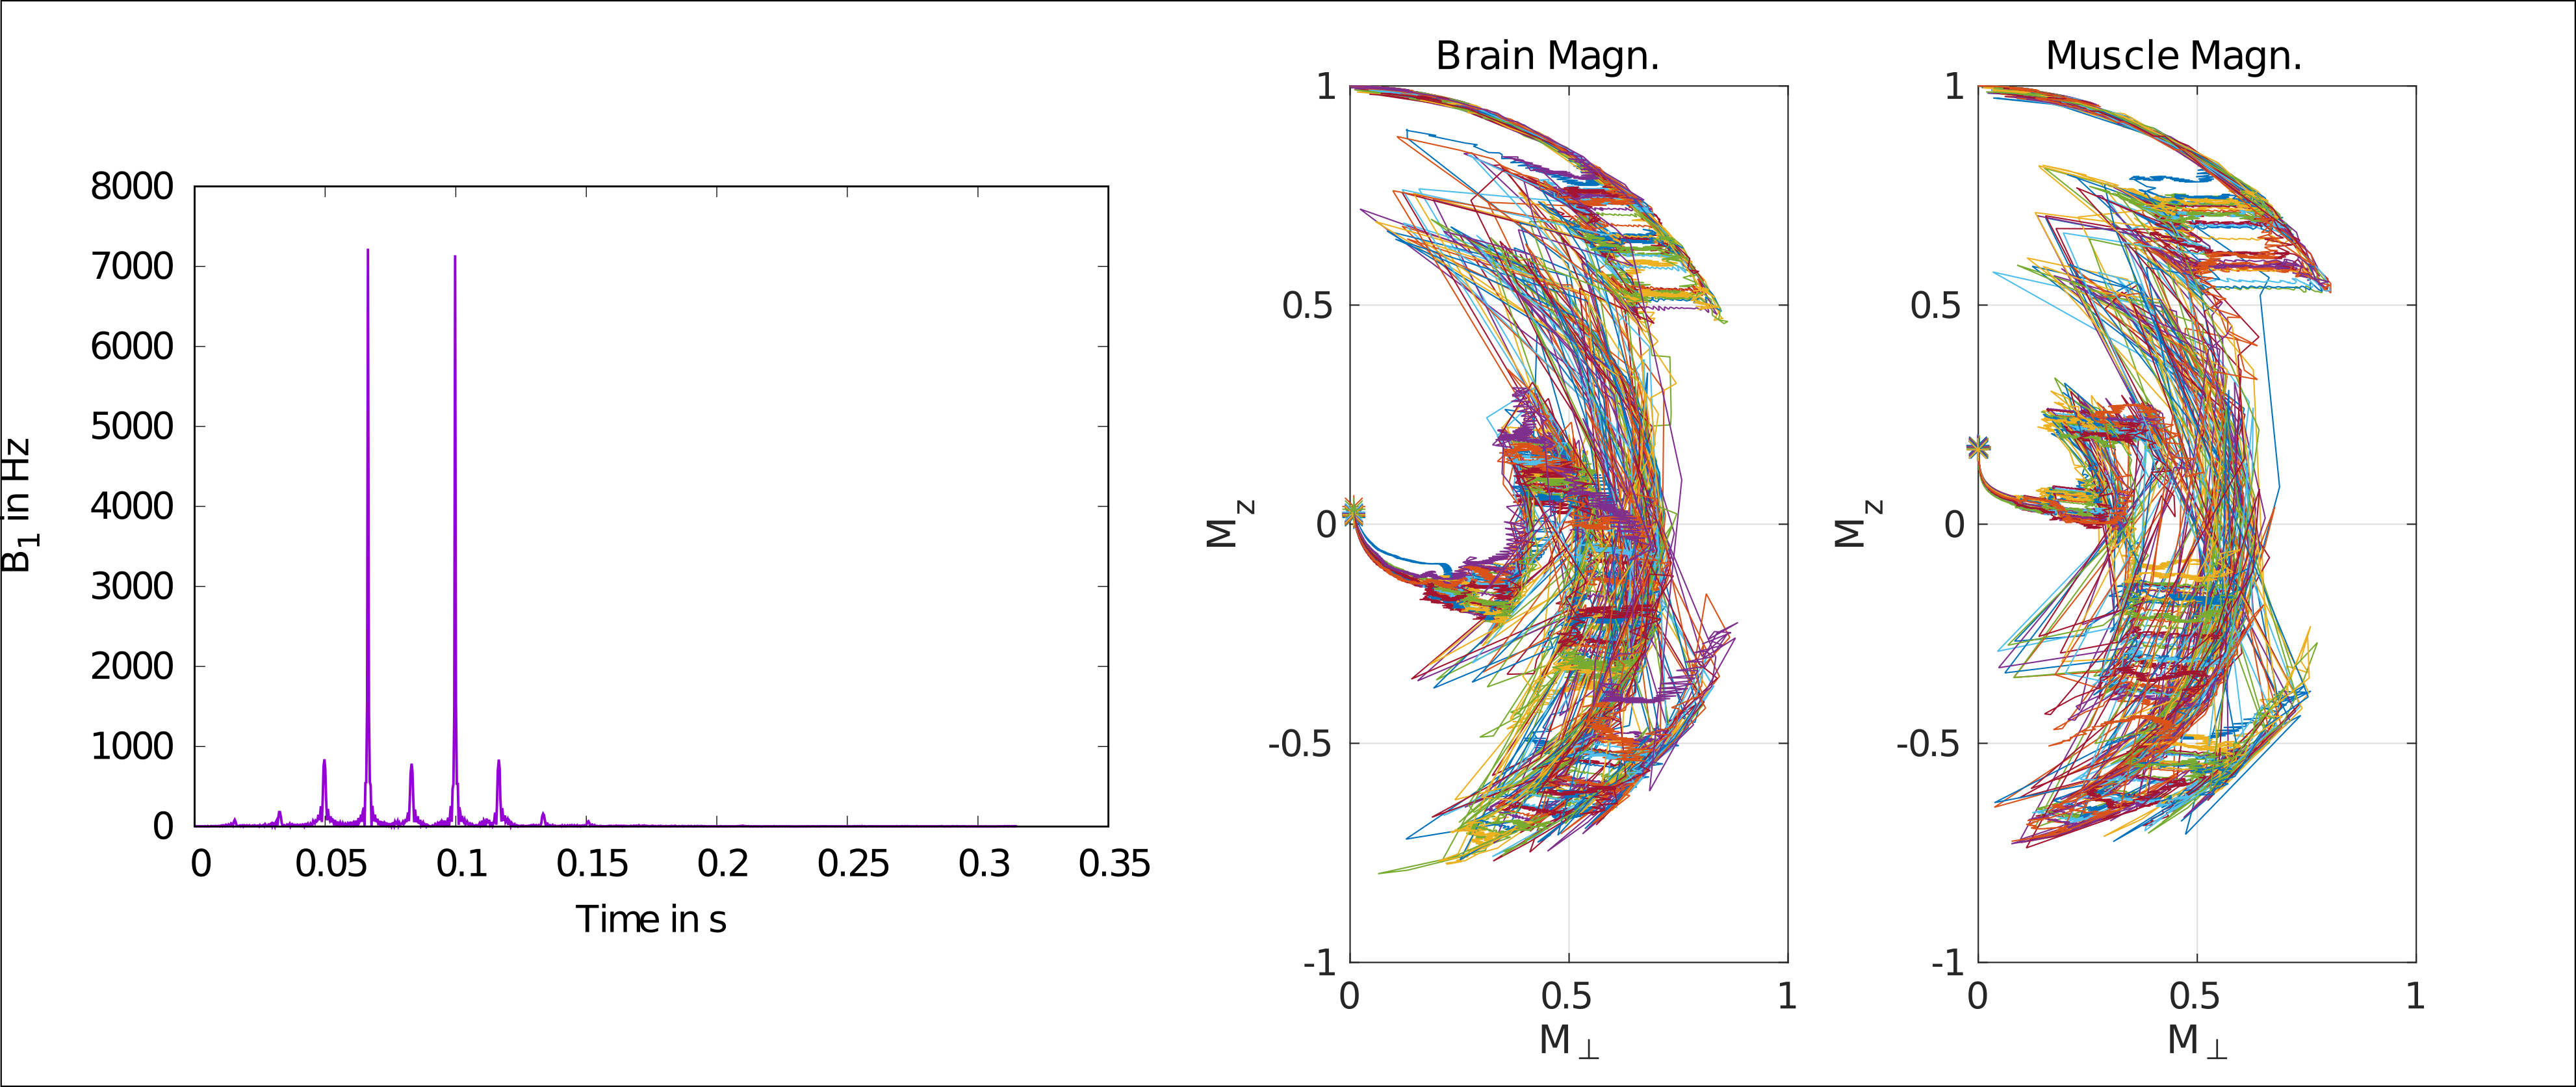
In vivo acquisitions were performed on adult mouse and rat brains in accordance with the rules of our institutional ethic committee on animal experimentation, on a 4.7 T Bruker MR system using quadrature coils. In both experiments, the optimal contrast pulse is used as a preparation pulse that creates longitudinal magnetization difference, i.e. contrast along the $$$M_Z$$$ axis. The magnetization is subsequently flipped onto the transverse plane with a slice-selective 90° pulse and refocused with a 180° pulse. TE is set as short as possible in order to preserve the contrast created at the time of acquisition. TR is set long enough to ensure complete longitudinal magnetization recovery. A RARE acceleration factor of 8 is used, with a centric encoding scheme.
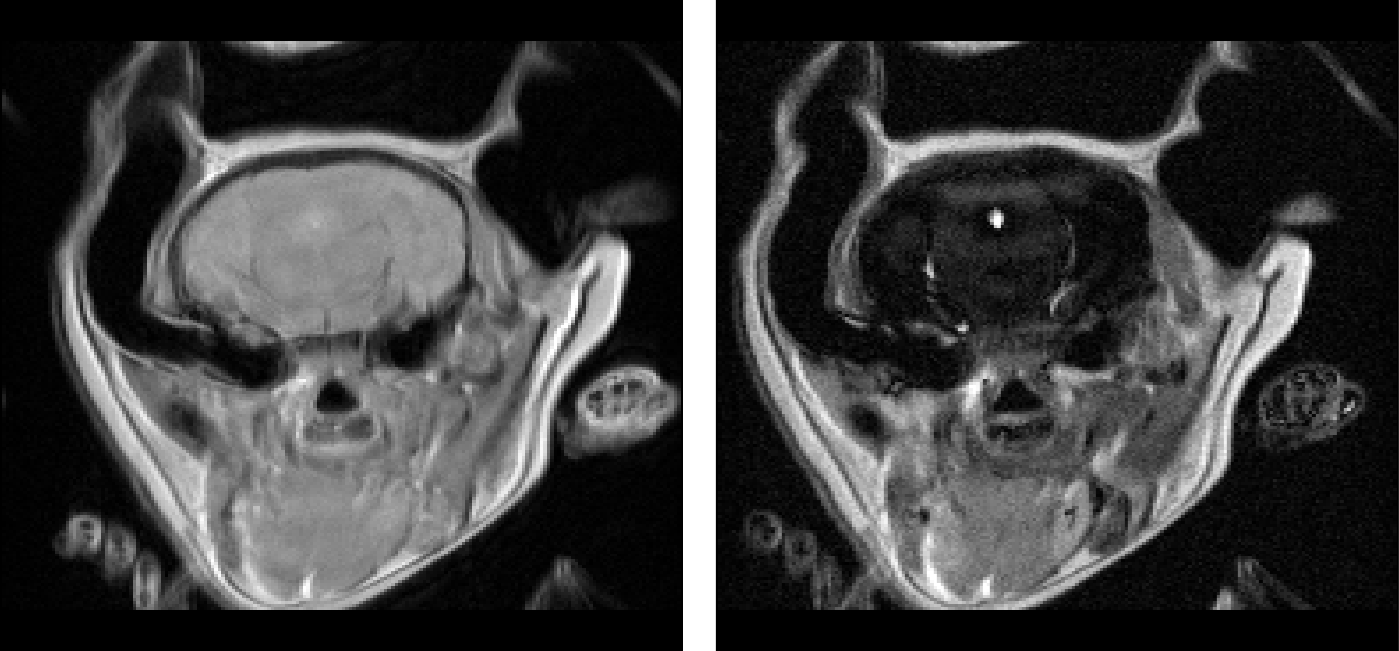
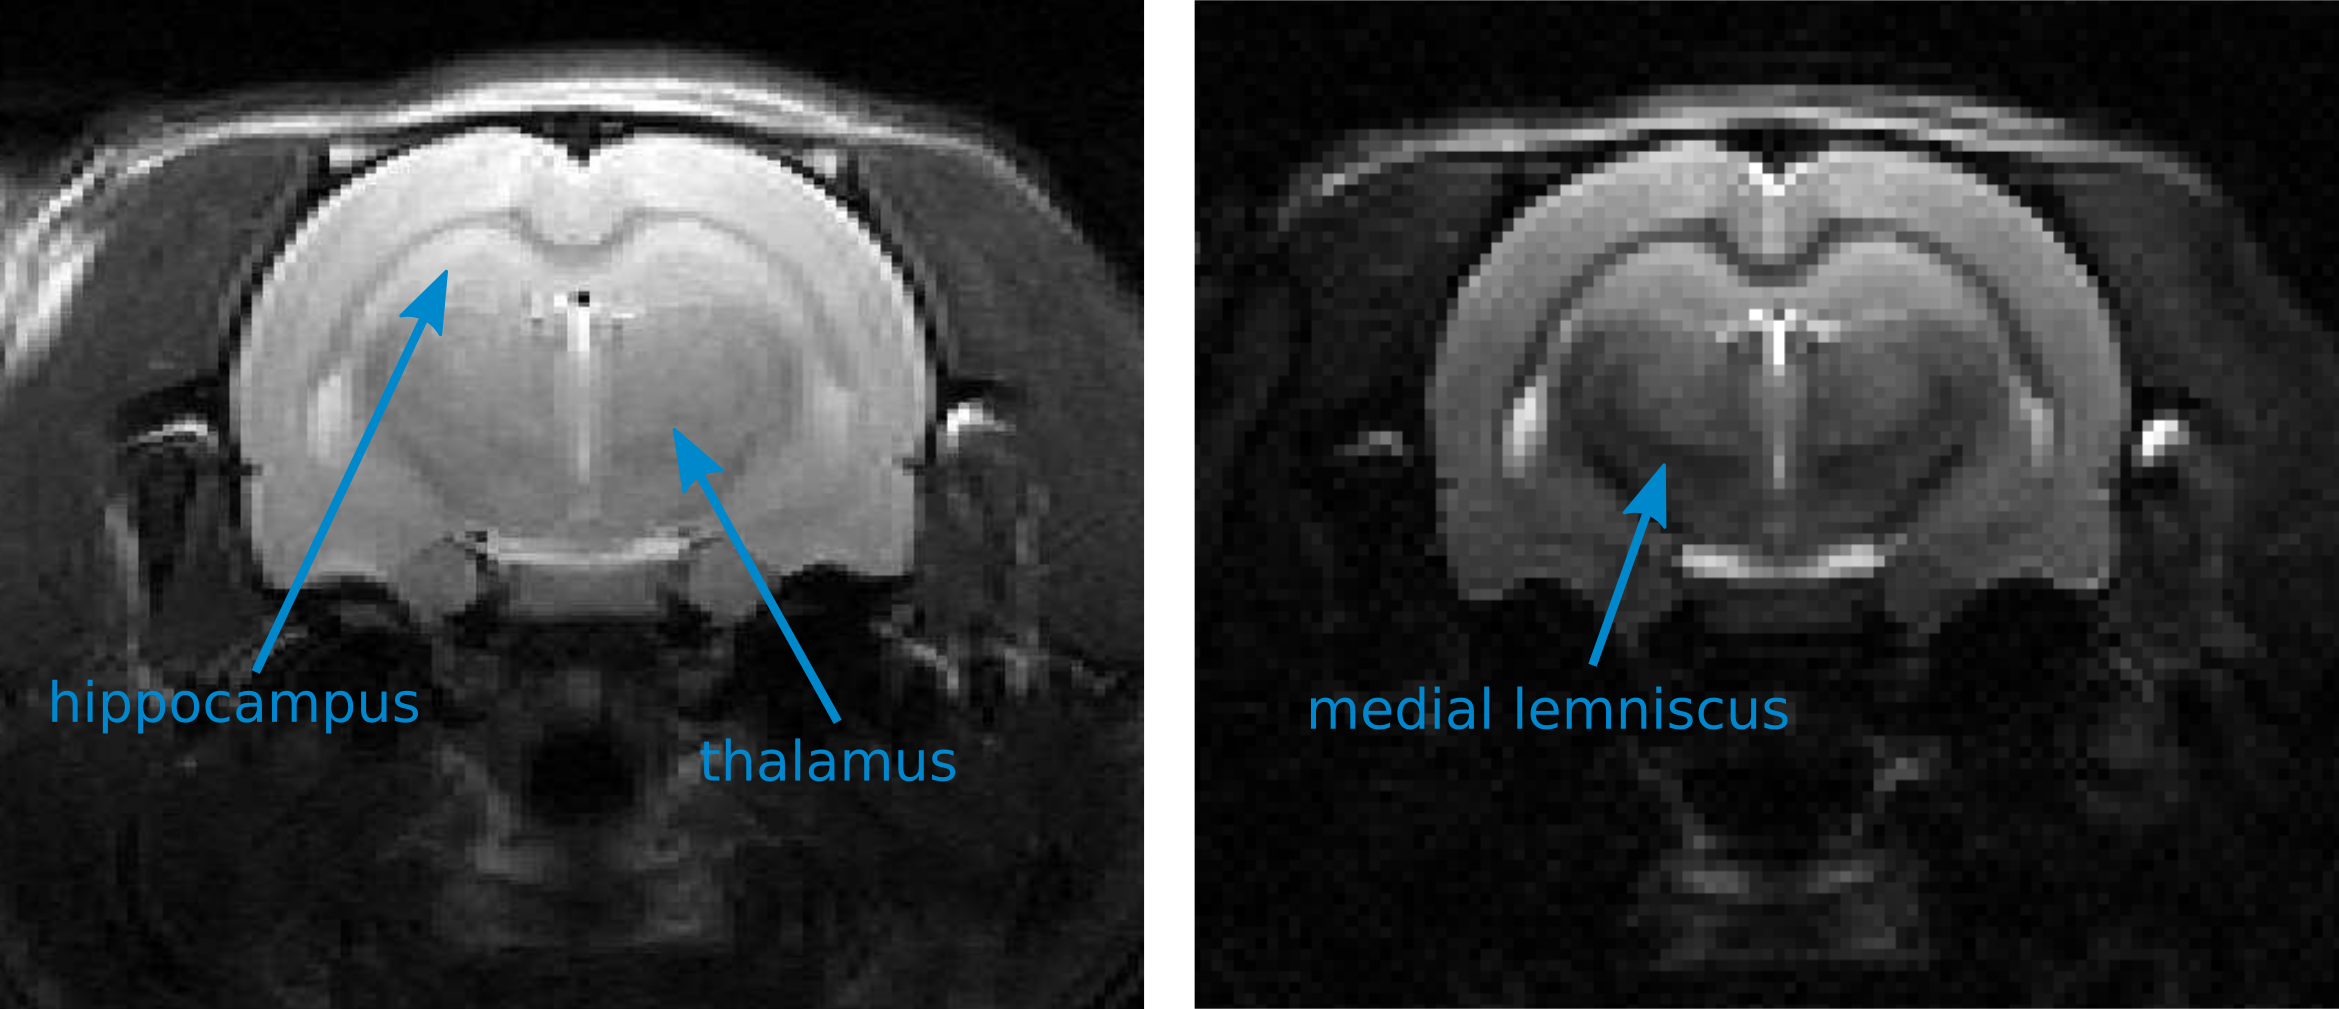
The mouse experiment consists of minimizing the signal coming from the brain ($$$[T1^b , T2^b] = [920, 66]$$$ ms) while maximizing the signal coming from the surrounding muscles. ($$$[T1^m , T2^m] = [1011, 30]$$$ ms). Average relaxation times were estimated by fitting the water peak inside a spectroscopy voxel at different TE and TR values. Figure 1 shows the optimal pulse amplitude together with the magnetization evolutions of the brain and muscle during the application of the pulse. The resulting images are shown in Figure 2. The rat experiment consists of maximizing the hippocampus signal while minimizing the thalamus signal. Average relaxation times are estimated to: $$$[T1^h , T2^h] = [921, 68]$$$ ms and $$$[T1^t , T2^t] = [832, 63]$$$ ms. Figure 3 compares standard T2 weighting, when TE is set to maximize the desired contrast (65.4 ms), with the image obtained with the optimal contrast pulse.
Discussion
Figure 2 illustrates the ability of optimal pulses to create contrasts that are impossible to obtain with classical weighting strategies. Because ($$$T2^b> T2^m$$$) and ($$$T1^b \approx T1^m$$$) standard weighting would lead to the opposite contrast. Here, the optimal pulse takes advantage of the relaxation times differences during the excitation to create the desired contrast. Figure 3 illustrates the ability of optimal pulses to enhance standard T2 contrast on rat brain structures. The visibility of the medial lemniscus is also greatly enhanced. In both experiments, it is worth noticing that the contrast is preserved on the whole slice despite the proximity of ear canals which create substantial B0 inhomogeneities.Conclusion
This abstract has demonstrated the applicability and pointed out the interest of using optimal contrast pulses for in vivo applications. Future work will consider SNR into the optimization scheme to optimize the contrast-to-noise ratio per unit of time.Acknowledgements
This work is supported by the ANR-DFG research program Explosys (GrantNo. ANR-14-CE35-0013-01; GL203/9-1) and from the Technische Universität München Institute for Advanced Study, funded by the German Excellence Initiative and the E. U. Seventh Framework Programme under Grant No.291763. This work was performed within the framework of the LABEX PRIMES (ANR-11-LABX-0063/ ANR-11-IDEX-0007).References
1. Lapert M, Zhang Y, Janich M, Glaser SJ, Sugny D. Exploring the physical limits of saturation contrast in magnetic resonance imaging” Scientific Reports, Nature Publishing Group, 2012, 2
2. Bonnard B, Cots O. Geometric numerical methods and results in the contrast imaging problem in nuclear magnetic resonance, Mathematical Models and Methods in Applied Sciences, World Scientific, 24, 187-21, 2014
3. Van Reeth E, Ratiney H, Tesch M, Glaser SJ, Sugny D. Optimizing MRI Contrast with B1 pulses using optimal control theory, IEEE 12th International Symposium on Biomedical Imaging (ISBI), 2016
4. Pontryagin L S, Mathematical theory of optimal processes, CRC Press, 1987.
5. Khaneja N, Reiss T, Kehlet C, Schulte-Herbrüggen T, Glaser SJ. “Optimal control of coupled spin dynamics: design of nmr pulse sequences by gradient ascent algorithms,” Journal of Magnetic Resonance, vol.172, no. 2, pp. 296 – 305, 2005.
Figures